EACC Bolivia
EACC Bolivia
EACC Bolivia
Create successful ePaper yourself
Turn your PDF publications into a flip-book with our unique Google optimized e-Paper software.
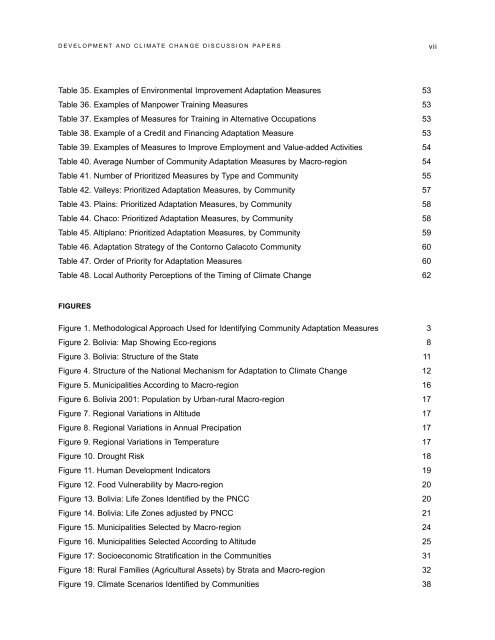
d E v E l o p m E n t A n d c l i m A t E c h A n g E d i s c U s s i o n pA p E R s<br />
vii<br />
table 35. Examples of Environmental improvement Adaptation measures 53<br />
table 36. Examples of manpower training measures 53<br />
table 37. Examples of measures for training in Alternative occupations 53<br />
table 38. Example of a credit and financing Adaptation measure 53<br />
table 39. Examples of measures to improve Employment and value-added Activities 54<br />
table 40. Average number of community Adaptation measures by macro-region 54<br />
table 41. number of prioritized measures by type and community 55<br />
table 42. valleys: prioritized Adaptation measures, by community 57<br />
table 43. plains: prioritized Adaptation measures, by community 58<br />
table 44. chaco: prioritized Adaptation measures, by community 58<br />
table 45. Altiplano: prioritized Adaptation measures, by community 59<br />
table 46. Adaptation strategy of the contorno calacoto community 60<br />
table 47. order of priority for Adaptation measures 60<br />
table 48. local Authority perceptions of the timing of climate change 62<br />
Figures<br />
figure 1. methodological Approach Used for identifying community Adaptation measures 3<br />
figure 2. <strong>Bolivia</strong>: map showing Eco-regions 8<br />
figure 3. <strong>Bolivia</strong>: structure of the state 11<br />
figure 4. structure of the national mechanism for Adaptation to climate change 12<br />
figure 5. municipalities According to macro-region 16<br />
figure 6. <strong>Bolivia</strong> 2001: population by Urban-rural macro-region 17<br />
figure 7. Regional variations in Altitude 17<br />
figure 8. Regional variations in Annual precipation 17<br />
figure 9. Regional variations in temperature 17<br />
figure 10. drought Risk 18<br />
figure 11. human development indicators 19<br />
figure 12. food vulnerability by macro-region 20<br />
figure 13. <strong>Bolivia</strong>: life Zones identified by the pncc 20<br />
figure 14. <strong>Bolivia</strong>: life Zones adjusted by pncc 21<br />
figure 15. municipalities selected by macro-region 24<br />
figure 16. municipalities selected According to Altitude 25<br />
figure 17: socioeconomic stratification in the communities 31<br />
figure 18: Rural families (Agricultural Assets) by strata and macro-region 32<br />
figure 19. climate scenarios identified by communities 38


