Bahrain : Complete Profile - What is GIS - World Health Organization
Bahrain : Complete Profile - What is GIS - World Health Organization
Bahrain : Complete Profile - What is GIS - World Health Organization

Create successful ePaper yourself
Turn your PDF publications into a flip-book with our unique Google optimized e-Paper software.
<strong>Health</strong> Systems <strong>Profile</strong>-<strong>Bahrain</strong><br />
Regional <strong>Health</strong> Systems Observatory- EMRO<br />
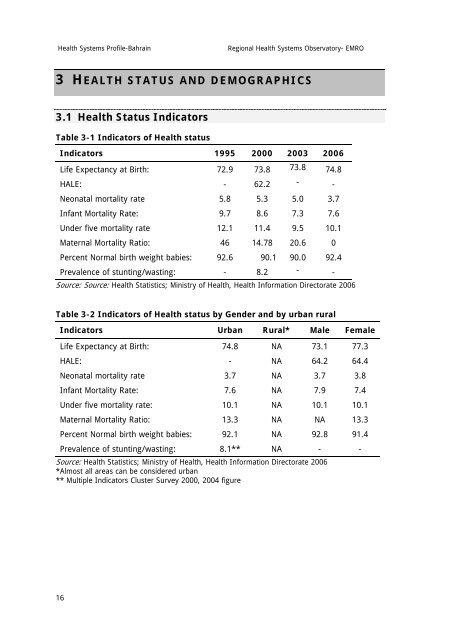
3 HEALTH STATUS AND DEMOGRAPHICS<br />
3.1 <strong>Health</strong> Status Indicators<br />
Table 3-1 Indicators of <strong>Health</strong> status<br />
Indicators 1995 2000 2003 2006<br />
Life Expectancy at Birth: 72.9 73.8 73.8 74.8<br />
HALE: - 62.2 - -<br />
Neonatal mortality rate 5.8 5.3 5.0 3.7<br />
Infant Mortality Rate: 9.7 8.6 7.3 7.6<br />
Under five mortality rate 12.1 11.4 9.5 10.1<br />
Maternal Mortality Ratio: 46 14.78 20.6 0<br />
Percent Normal birth weight babies: 92.6 90.1 90.0 92.4<br />
Prevalence of stunting/wasting: - 8.2 - -<br />
Source: Source: <strong>Health</strong> Stat<strong>is</strong>tics; Min<strong>is</strong>try of <strong>Health</strong>, <strong>Health</strong> Information Directorate 2006<br />
Table 3-2 Indicators of <strong>Health</strong> status by Gender and by urban rural<br />
Indicators Urban Rural* Male Female<br />
Life Expectancy at Birth: 74.8 NA 73.1 77.3<br />
HALE: - NA 64.2 64.4<br />
Neonatal mortality rate 3.7 NA 3.7 3.8<br />
Infant Mortality Rate: 7.6 NA 7.9 7.4<br />
Under five mortality rate: 10.1 NA 10.1 10.1<br />
Maternal Mortality Ratio: 13.3 NA NA 13.3<br />
Percent Normal birth weight babies: 92.1 NA 92.8 91.4<br />
Prevalence of stunting/wasting: 8.1** NA - -<br />
Source: <strong>Health</strong> Stat<strong>is</strong>tics; Min<strong>is</strong>try of <strong>Health</strong>, <strong>Health</strong> Information Directorate 2006<br />
*Almost all areas can be considered urban<br />
** Multiple Indicators Cluster Survey 2000, 2004 figure<br />
16