An overview of Emerging Trend Detection (ETD) - Webpages Ursinus
An overview of Emerging Trend Detection (ETD) - Webpages Ursinus
An overview of Emerging Trend Detection (ETD) - Webpages Ursinus

You also want an ePaper? Increase the reach of your titles
YUMPU automatically turns print PDFs into web optimized ePapers that Google loves.
<strong>An</strong> <strong>overview</strong> <strong>of</strong> <strong>Emerging</strong> <strong>Trend</strong><br />
<strong>Detection</strong> (<strong>ETD</strong>)<br />
1. INTRODUCTION<br />
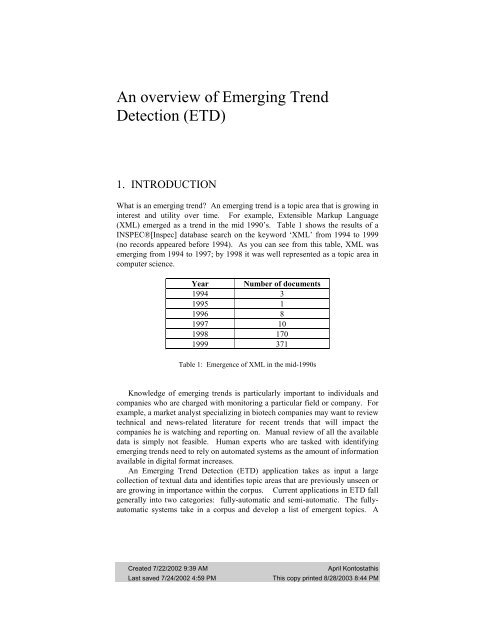
What is an emerging trend? <strong>An</strong> emerging trend is a topic area that is growing in<br />
interest and utility over time. For example, Extensible Markup Language<br />
(XML) emerged as a trend in the mid 1990’s. Table 1 shows the results <strong>of</strong> a<br />
INSPEC®[Inspec] database search on the keyword ‘XML’ from 1994 to 1999<br />
(no records appeared before 1994). As you can see from this table, XML was<br />
emerging from 1994 to 1997; by 1998 it was well represented as a topic area in<br />
computer science.<br />
Year Number <strong>of</strong> documents<br />
1994 3<br />
1995 1<br />
1996 8<br />
1997 10<br />
1998 170<br />
1999 371<br />
Table 1: Emergence <strong>of</strong> XML in the mid-1990s<br />
Knowledge <strong>of</strong> emerging trends is particularly important to individuals and<br />
companies who are charged with monitoring a particular field or company. For<br />
example, a market analyst specializing in biotech companies may want to review<br />
technical and news-related literature for recent trends that will impact the<br />
companies he is watching and reporting on. Manual review <strong>of</strong> all the available<br />
data is simply not feasible. Human experts who are tasked with identifying<br />
emerging trends need to rely on automated systems as the amount <strong>of</strong> information<br />
available in digital format increases.<br />
<strong>An</strong> <strong>Emerging</strong> <strong>Trend</strong> <strong>Detection</strong> (<strong>ETD</strong>) application takes as input a large<br />
collection <strong>of</strong> textual data and identifies topic areas that are previously unseen or<br />
are growing in importance within the corpus. Current applications in <strong>ETD</strong> fall<br />
generally into two categories: fully-automatic and semi-automatic. The fullyautomatic<br />
systems take in a corpus and develop a list <strong>of</strong> emergent topics. A<br />
Created 7/22/2002 9:39 AM April Kontostathis<br />
Last saved 7/24/2002 4:59 PM This copy printed 8/28/2003 8:44 PM
human reviewer would then peruse these topics and the supporting evidence<br />
found by the system to determine which are truly emerging trends. These<br />
systems <strong>of</strong>ten include a visual component that allows the user to track the topic<br />
in an intuitive manner [Davison][Swan]. Semi-automatic systems rely on user<br />
input as a first step in detecting an emerging trend [Porter][Roy]. These systems<br />
will then provide the user with evidence to indicate if the input topic is really<br />
emerging, usually in the form <strong>of</strong> user-friendly reports and screens that<br />
summarize the evidence available on the topic.<br />
We begin with a detailed description <strong>of</strong> several semi-automatic and fullyautomatic<br />
<strong>ETD</strong> systems in section 2. We discuss the components <strong>of</strong> an <strong>ETD</strong><br />
system including: linguistic and statistical features, learning algorithms, training<br />
and test set generation, visualization and evaluation. In section 3 we review the<br />
<strong>ETD</strong> capabilities in commercial products. Our conclusions are presented in<br />
section 4. In section 5 Dan Phelps, from Kodak, describes the role <strong>of</strong> <strong>ETD</strong><br />
systems in modern corporate decision making processes.<br />
2. <strong>ETD</strong> SYSTEMS<br />
As mentioned above, <strong>ETD</strong> systems can be classified as either fully automatic or<br />
semi-automatic. Semi-automatic systems require user input as a first step in<br />
detecting the emerging trends in a topic area. We have developed both fully and<br />
semi automatic systems which have successfully identified emerging trends. In<br />
this section we provide an <strong>overview</strong> <strong>of</strong> the components that are included in most<br />
<strong>ETD</strong> systems (input data sets, attributes used for processing, learning<br />
algorithms, visualization, evaluation), followed by a detailed description <strong>of</strong><br />
several <strong>ETD</strong> systems<br />
We begin with a discussion on the data that is used in <strong>ETD</strong> systems. The<br />
most commonly used data repository for <strong>ETD</strong> emerged from the Topic<br />
<strong>Detection</strong> and Tracking (TDT) project [TDT] that began in 1997. TDT research<br />
develops algorithms for discovering and threading together topically related<br />
material in streams <strong>of</strong> data, such as newswire and broadcast news, in both<br />
English and Mandarin Chinese. The TDT project, while not directly focused on<br />
emerging trend detection, has nonetheless encouraged the development <strong>of</strong><br />
various fully automated systems that track topic changes through time. Several<br />
<strong>of</strong> those algorithms will be described in this section.<br />
As part <strong>of</strong> the TDT initiative several data sets have been created. The TDT<br />
data sets are sets <strong>of</strong> news stories and event descriptors. Each story/event pair is<br />
assigned a relevance judgement. A relevance judgement is an indicator about<br />
the relevance <strong>of</strong> the given story to an event. See table 2 for several examples <strong>of</strong><br />
the relevance judgement assignment to a story/event pair. Thus, the TDT data<br />
sets can be used as both training and test sets for <strong>ETD</strong> algorithms. The<br />
Linguistic Data Consortium (LDC) [LDC] currently has three TDT corpora<br />
available for system development, the TDT Pilot study (TDT-Pilot), the TDT<br />
Phase 2 (TDT2), the TDT Phase 3 (TDT3), as well as the TDT3 Arabic<br />
supplement.<br />
Created 7/22/2002 9:39 AM April Kontostathis<br />
Last saved 7/24/2002 4:59 PM This copy printed 8/28/2003 8:44 PM
Story Description Event Relevance<br />
Judgement<br />
Story describes Oklahoma City Yes<br />
survivor’s reaction after<br />
Oklahoma City<br />
Bombing<br />
Bombing<br />
Story describes US Terrorism No<br />
survivor’s reaction after<br />
Oklahoma City<br />
Bombing<br />
Response<br />
Story describes FBI’s Oklahoma City Yes<br />
increased use <strong>of</strong><br />
survellance in<br />
government buildings<br />
as a result <strong>of</strong> the<br />
Oklahoma City<br />
Bombing<br />
Bombing<br />
Story describes FBI’s US Terrorism Yes<br />
increased use <strong>of</strong><br />
survellance in<br />
government buildings<br />
as a result <strong>of</strong> the<br />
Oklahoma City<br />
Bombing<br />
Response<br />
Table 2: Story/event pairs<br />
Not all <strong>of</strong> the systems we describe rely on the TDT data sets. Other<br />
approaches to creation <strong>of</strong> test data have been used, such as manually assigning<br />
relevance judgements to the input data and comparing the system results to the<br />
results produced by a human reviewer. This approach is tedious and necessarily<br />
limits the size <strong>of</strong> the data set. Some <strong>of</strong> the systems we present use online<br />
databases such as the INSPEC®[Inspec] database, which contains engineering<br />
abstracts, or the US Patent database [USPTO], which allows searching <strong>of</strong> all<br />
published US Patents. The input data set, along with the selection <strong>of</strong> appropriate<br />
attributes that describe the input, is a critical component <strong>of</strong> each <strong>ETD</strong> system.<br />
Attribute selection is at the core <strong>of</strong> the tracking process, since it is the attributes<br />
that describe each input record and ultimately determine the trends.<br />
The attributes obtained from the corpus data are input to the<br />
methods/techniques employed by each <strong>ETD</strong> system we describe below. As you<br />
will see, some research groups use traditional IR methodologies to detect<br />
Created 7/22/2002 9:39 AM April Kontostathis<br />
Last saved 7/24/2002 4:59 PM This copy printed 8/28/2003 8:44 PM
emerging trends, while others have focused on more traditional machine<br />
learning approaches such as those used in data mining applications.<br />
Work in the areas <strong>of</strong> visualization-supported trend detection has explored<br />
techniques for identifying topics. When a user is trying to understand a large<br />
amount <strong>of</strong> data, a system that allows an <strong>overview</strong>, at multiple levels <strong>of</strong> detail and<br />
from multiple perspectives, is particularly helpful. One <strong>of</strong> the simplest<br />
approaches is a histogram, where bars indicate discrete values <strong>of</strong> actual data at<br />
some discrete time value. Information visualization is meant to complement<br />
machine learning approaches for trend detection. Plotting the patterns along a<br />
timeline allows us to see the rate <strong>of</strong> change <strong>of</strong> a pattern over time. For each<br />
algorithm described below, we will discuss the visualization component,<br />
showing how the component enhances the trend detection capabilities <strong>of</strong> the<br />
system.<br />
The evaluation <strong>of</strong> an emerging trend detection system can be based on<br />
formal metrics, such as precision (the percentage <strong>of</strong> selected items that the<br />
system got right) and recall (the proportion <strong>of</strong> the target items that the system<br />
found), or by less formal, subjective means (e.g., answers to questions such as:<br />
Is the visualization understandable?). The particulars <strong>of</strong> an evaluation are<br />
related to the goals <strong>of</strong> the method and thus can vary greatly, but some<br />
justification and interpretation <strong>of</strong> the results should always exist to validate a<br />
given system.<br />
2.1 Technology Opportunities <strong>An</strong>alysis (TOA)<br />
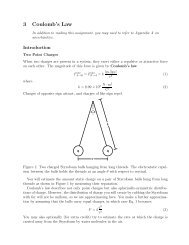
Alan L. Porter and Michael J. Detampel describe a semi-automatic trend<br />
detection system for technology opportunities analysis in [Porter]. The first step<br />
<strong>of</strong> the process is the extraction <strong>of</strong> documents from the knowledge area to be<br />
studied from a database <strong>of</strong> abstracts, such as INSPEC®[Inspec]. The extraction<br />
process requires the development <strong>of</strong> a list <strong>of</strong> potential keywords by a domain<br />
expert. These keywords are then combined into queries using appropriate<br />
Boolean operators to generate comprehensive and accurate searches. The target<br />
databases are also identified in this phase (ex. INSPEC®[Inspec],<br />
COMPENDEX® [Compendex], US Patents [USPTO], etc.).<br />
The queries are then input to the Technology Opportunities <strong>An</strong>alysis<br />
Knowbot (TOAK), a customer s<strong>of</strong>tware package also referred to as TOAS<br />
(Technology Opportunities <strong>An</strong>alysis System). TOAK extracts the relevant<br />
documents (abstracts) and provides bibliometric analysis <strong>of</strong> the data.<br />
Bibliometrics uses information such as word counts, date information, word cooccurrence<br />
information, citation information and publication information to<br />
track activity in a subject area. TOAK facilitates the analysis <strong>of</strong> the data<br />
available within the documents. For example, lists <strong>of</strong> frequently occurring<br />
keywords can be quickly generated, as can lists <strong>of</strong> author affiliations, countries,<br />
or states.<br />
Created 7/22/2002 9:39 AM April Kontostathis<br />
Last saved 7/24/2002 4:59 PM This copy printed 8/28/2003 8:44 PM
In [Porter], the authors present an example <strong>of</strong> how the TOAK system can be<br />
used to track trends in the multichip module sub field <strong>of</strong> electronic and<br />
manufacturing and assembly. Figure 1 (from [Porter]) shows a list <strong>of</strong> keywords<br />
that appear frequently with ‘multichip module’ in the INSPEC®[Inspec]<br />
database. The authors observed that multichip modules and integrated circuits<br />
(particularly hybrid integrated circuits) co-occurred very frequently. <strong>An</strong><br />
additional search using the US Patent database showed that many patents had<br />
been issued in the area <strong>of</strong> multichip modules. Furthermore, the integrated<br />
circuits activity was more likely to be US based, while large scale integration<br />
activity was more likely to be based in Japan.<br />
TOAK is meant to be used by a human expert in an interactive and iterative<br />
fashion. The user generates initial queries, reviews the results and is able to<br />
revise the searches based on his/her domain knowledge. TOA represents an<br />
alternative approach to the time-consuming literature search and review tasks<br />
necessary for market analysis, technology planning, strategic planning or<br />
research.<br />
Figure 1: Sample output from TOAK showing keywords that co-occur with multichip<br />
modules<br />
Input Data and Attributes<br />
The INSPEC®[Inspec] database served as the corpus for TOA and its related<br />
s<strong>of</strong>tware, TOAK. (Major national and international publication databases, along<br />
with a major U.S. Patent database [USPTO] are other corpus possibilities.) Two<br />
opportunities exist for attribute selection. First (Table 3), a list <strong>of</strong> keywords (a<br />
Created 7/22/2002 9:39 AM April Kontostathis<br />
Last saved 7/24/2002 4:59 PM This copy printed 8/28/2003 8:44 PM
single word or multiple words) and their possible combinations (using Boolean<br />
operators) are supplied to TOAK, which retrieves all relevant items. The<br />
number <strong>of</strong> keyword occurrences and keyword co-occurrences – the appearance<br />
<strong>of</strong> two keywords in the same item – are calculated per year and over all years. A<br />
second pass (Table 4) involves selecting all phrases (single- and multi-word)<br />
from a specific field and calculating the number <strong>of</strong> items that contain each<br />
phrase. For example, every phrase in the keyword field <strong>of</strong> all items may be<br />
counted, or every phrase in the affiliation field. [Porter]<br />
Attribute Detail Generation<br />
n-grams1 Examples: multichip modules, ball grid<br />
array<br />
Manual<br />
Frequency Number <strong>of</strong> each n-grams occurrence Automatic<br />
Frequency Number <strong>of</strong> each n-grams co-occurrence (see<br />
text)<br />
Automatic<br />
Date Given by year Automatic<br />
Table 3: TOA First Pass Attributes<br />
Attribute Detail Generation<br />
Field A section <strong>of</strong> an item. Examples: keyword,<br />
city<br />
Manual<br />
Frequency Number <strong>of</strong> each n-gram in a field Automatic<br />
Table 4: TOA Second Pass Attributes<br />
Learning Algorithms<br />
Like most <strong>of</strong> the systems to facilitate trend detection in textual collections,<br />
TOA relies on the expertise <strong>of</strong> the user who is researching a given area. TOAK<br />
provides access to many different data sources, including INSPEC®[Inspec],<br />
Engineering Index [COMPENDEX], US Patents [USPTO] and others, but is<br />
necessarily limited as not all R&D work is patented or published. The power <strong>of</strong><br />
TOAK resides in the visual interface and easy access to different views <strong>of</strong> the<br />
data. There are no inherent learning algorithms present in the system; the user is<br />
solely responsible for trend detection.<br />
1 an n-gram is a sequence <strong>of</strong> n words. For example, the phrase “stock market” is a<br />
bigram (or 2-gram).<br />
Created 7/22/2002 9:39 AM April Kontostathis<br />
Last saved 7/24/2002 4:59 PM This copy printed 8/28/2003 8:44 PM
Visualization<br />
Central Res. Lab.,<br />
Hitachi Ltd. Japan<br />
Dept. <strong>of</strong> Appl. Phys., Osaka Univ., Japan<br />
NTT Basic Res. Labs.,<br />
Kanagawa, Japan<br />
Cavendish Lab.,<br />
Cambridge Univ., UK<br />
Nat. Inst. <strong>of</strong> Stand.<br />
& Technol. USA<br />
Electrotech. Lab.,<br />
Ibaraki, Japan<br />
Inst. <strong>of</strong> Ind. Sci.,<br />
Tokyo Univ. Japan<br />
Dept. <strong>of</strong> Electron. & Electr. Eng.,<br />
Inst. <strong>of</strong> Sci. & Ind.<br />
Res., Japan Adv. Res. Lab.,<br />
Glasgow Univ., UK<br />
Hitachi Ltd., ,<br />
Dept. <strong>of</strong> Electr. Eng., Minnesota Univ.,<br />
Minneapolis, MN, USA<br />
Japan<br />
Dept. <strong>of</strong> Ceramic Eng., Yonsei Univ.<br />
South Korea<br />
Naval Res. Lab.USA<br />
IBM Thomas J. Watson<br />
Res. Center<br />
Figure 2: Research organizations that are afflilated with research in nanotechnology<br />
Visualizations in TOA include frequency tables, histograms, weighted ratios,<br />
log-log graphs, Fisher-Pry curves, and technology maps [Porter]. These tools<br />
present information graphically using various linking and clustering approaches<br />
such as multi-dimensional scaling. In multi-dimensional scaling the goal is to<br />
reduce an n dimensional space to 2 or 3 dimensions. For example, figure 2<br />
(taken from [Porter and Jhu]) shows a mapping <strong>of</strong> the organizations that are<br />
affiliated with research in nanotechnology. In this case thre are 40 affiliations,<br />
and the map will have 40 nodes. A path-erasing algorithm is used to build a<br />
proximity matrix to connect the nodes. This handles the problem <strong>of</strong> distortion, a<br />
common problem that occurs when mapping a high dimensional spatial relation<br />
to a 2D or 3D space. TOA can also present maps based on other attributes that<br />
are available in the data. Attributes such as source, country <strong>of</strong> origin or author<br />
are commonly used. Similar techniques are used to generate keywords maps<br />
that represent relationships among frequently occurring index terms, and<br />
principal components maps that represent relationships among conceptual<br />
clusters. These maps represent co-occurrence and correlative information<br />
gathered from within the dataset.<br />
Created 7/22/2002 9:39 AM April Kontostathis<br />
Last saved 7/24/2002 4:59 PM This copy printed 8/28/2003 8:44 PM
Evaluation<br />
Identification <strong>of</strong> trends is left to the user in this semi-automatic method. But<br />
TOA can be evaluated on how well it presents information to the user who must<br />
make emerging trend judgments. Visualizations are meant to significantly<br />
increase understanding <strong>of</strong> the data, and intuitively do. But there is no support<br />
for the efficacy <strong>of</strong> these tools, apart from the authors’ claims. Solutions exist for<br />
evaluating this type <strong>of</strong> method. For example, independent sources or focus<br />
groups could strengthen the argument that the visualizations are indeed helpful.<br />
ThemeRiver [section 2.5] takes this usability approach for evaluation. Formal<br />
metrics, even with a semi-automatic method, can also be utilized as in CIMEL<br />
[section 2.2].<br />
2.2 Constructive, collaborative inquiry-based multimedia elearning(CIMEL)<br />
CIMEL is a multi-media framework for constructive and collaborative inquirybased<br />
learning [Blank]. The semi-automatic trend detection methodology<br />
described in [Roy] has been integrated into the CIMEL system in order to<br />
enhance computer science education. A multimedia tutorial has been developed<br />
to guide students through the process <strong>of</strong> emerging trend detection. Through the<br />
detection <strong>of</strong> incipient emerging trends, the students see the role that current<br />
topics play in course-related research areas. Early studies <strong>of</strong> this methodology,<br />
using students in an upper-level computer science course, show that use <strong>of</strong> the<br />
methodology improves the number <strong>of</strong> incipient emerging trends identified.<br />
Our semi-automatic algorithm employs a more robust methodology than<br />
TOA because the user base is assumed to be individuals who are learning a<br />
particular area, as opposed to domain experts. The methodology relies on web<br />
resources to identify candidate emerging trends. Classroom knowledge, along<br />
with automated ‘assistants’, is then used to evaluate the identified candidates.<br />
This methodology is particularly focused on incipient trends (those that are<br />
occur for the first time).<br />
Identify a main topic area for research (ex. Object databases)<br />
Identify recent conferences and workshops in this area (ex.<br />
OOPSLA for Object Oriented Programming)<br />
Review content and create a list <strong>of</strong> candidate emerging trends<br />
Evaluate each emerging trend identified in step 3, using general<br />
web research tools (ex. Google search)<br />
For each emerging trend remaining after step 4, verify the trend<br />
using an INSPEC®[Inspec] database search<br />
Table 5: Methodology for detecting emerging trends<br />
Created 7/22/2002 9:39 AM April Kontostathis<br />
Last saved 7/24/2002 4:59 PM This copy printed 8/28/2003 8:44 PM
The methodology is outlined in table 5. In the step 2 <strong>of</strong> this methodology<br />
(after a main topic area has been identified) the user is directed to a list <strong>of</strong> recent<br />
conferences and workshops and instructed to review the content to identify a list<br />
<strong>of</strong> candidate emerging trends. Next, the user is directed to a general-purpose<br />
web search engine to find other references to candidate emerging trends<br />
identified in step 3. Searches on the emerging trend phase, along with terms<br />
such as ‘recent research,’ ‘new approach,’ etc. are employed to improve the<br />
precision <strong>of</strong> the search results. The user is provided with a detailed algorithm<br />
that includes parameters for evaluation <strong>of</strong> the pages returned from the search<br />
engine. The candidate emerging trend may be rejected as a result <strong>of</strong> this search.<br />
In addition, other candidate emerging trends may be identified in this step.<br />
Figure 3: CIMEL Tutorial<br />
Finally the student is asked to verify candidate emerging trends using<br />
document count, author and venue spread using an INSPEC®[Inspec] database<br />
search. Again, to make the trend detection process easier, this step has been<br />
automated [Gevry]. Students are only required to enter the candidate emerging<br />
trend (Figure 3) which they have already identified in steps 3 and 4 while the<br />
database search tool automatically generates document count, unique author<br />
sets, unique co-author sets, a list <strong>of</strong> unique venues, etc. pertaining to the chosen<br />
candidate emerging trend. The tool also provides a link to the corresponding<br />
abstracts, which can be accessed by clicking on individual document titles. This<br />
feature <strong>of</strong> the tool is important, as the student still has to make his or her own<br />
Created 7/22/2002 9:39 AM April Kontostathis<br />
Last saved 7/24/2002 4:59 PM This copy printed 8/28/2003 8:44 PM
decision, considering the information provided by the tool and using the<br />
heuristics provided in the tutorial, to validate a candidate emerging trend. Again,<br />
the user is given specific parameters for determining if the candidate emerging<br />
trend is truly an incipient emerging trend.<br />
For example, the students in an upper-level Object Oriented S<strong>of</strong>tware<br />
Engineering course would be asked to find an emerging trend in the field <strong>of</strong><br />
Object Databases. Several conference web sites would be provided, including<br />
the Conference on Object-Oriented Programming, Systems, Languages, and<br />
Applications (OOPSLA) website. A manual review <strong>of</strong> the content <strong>of</strong> papers<br />
presented at OOPSLA ’01 should lead the student to the candidate emerging<br />
trend ‘XML Databases.’ A search <strong>of</strong> the web using Google would detect<br />
additional papers related to XML databases, providing further evidence that this<br />
is an emerging trend. Finally, the student would be directed to the<br />
INSPEC®[Inspec] database. A search on XML () Databases ()<br />
Object-oriented will reveal the information shown in table 6. Further inspection<br />
shows multiple author sets and publication venues, confirming that XML<br />
Databases is an incipient emerging trend in the field <strong>of</strong> Object Databases.<br />
Year Number <strong>of</strong> documents<br />
Prior to 1999 0<br />
1999 5<br />
2000 11<br />
2001 5<br />
Table 6: Evidence <strong>of</strong> XML Databases as an incipient emerging trend<br />
Input Data and Attributes<br />
The corpus for this semi-automatic methodology can be any web resource.<br />
A description <strong>of</strong> the main topic is chosen, which can consist <strong>of</strong> any text. <strong>An</strong><br />
initial search <strong>of</strong> recent conferences and workshops is performed to identify<br />
candidate emerging trends. Phrases associated with emerging trends 2 are used<br />
in conjunction with either the main topic or the candidate emerging trends to<br />
locate candidate emerging trends using a web search engine. Several attributes<br />
guide this initial decision-making process (Table 7), including the current year,<br />
the number <strong>of</strong> times either the main topic or candidate emerging trend appears<br />
on the page, the number <strong>of</strong> supporting terms on the page, and the line or<br />
paragraph containing the main topic/candidate emerging trend and supporting<br />
term. [Roy] The validation step (Table 8) involves automatically calculating<br />
2 The list <strong>of</strong> current supporting terms: most recent contribution, recent research, a new<br />
paradigm, hot topics, emergent, newest entry, cutting edge strategies, first public<br />
review, future, recent trend, next generation, novel, new approach, proposed, current<br />
issues.<br />
Created 7/22/2002 9:39 AM April Kontostathis<br />
Last saved 7/24/2002 4:59 PM This copy printed 8/28/2003 8:44 PM
four frequencies across time: the number <strong>of</strong> unique documents, unique authors,<br />
unique author sets, and unique venues [Gevry]. These frequencies help the user<br />
make a final emerging trend determination. For example, an increase in the<br />
number <strong>of</strong> documents that reference the main topic and candidate emerging<br />
trend over time indicates a true emerging trend. On the other hand, if one or two<br />
documents appear in different years by the same author, the trend is not<br />
emerging. [Roy].<br />
Attribute Detail Generation<br />
n-gram Main topic, e.g., object databases Manual<br />
n-gram Candidate<br />
Databases<br />
trend, e.g., XML Manual<br />
n-gram Supporting terms Automatic<br />
n-gram Search item – any Boolean Automatic<br />
combination <strong>of</strong> the previous<br />
Date<br />
attributes, e.g., XML novel<br />
Given by year Automatic<br />
Frequency Number <strong>of</strong> times main Automatic<br />
Frequency<br />
topic/candidate trend occurs on page<br />
Number <strong>of</strong> times helper term occurs<br />
on page<br />
Automatic<br />
n-gram Line or paragraph containing the Manual<br />
main topic/candidate trend and<br />
helper term in a given document<br />
Table 7: CIMEL Initial Step Attributes<br />
Attribute Detail Generation<br />
Frequency Number <strong>of</strong> unique authors, per year Automatic<br />
Frequency Number <strong>of</strong> unique documents, per<br />
year<br />
Automatic<br />
Frequency Number <strong>of</strong> unique author sets, per<br />
year<br />
Automatic<br />
Frequency Number <strong>of</strong> unique venues, per year Automatic<br />
Table 8: CIMEL Validation Step Attributes<br />
Learning Algorithms<br />
Like TOA, the CIMEL system relies on the user to detect emerging trends.<br />
No machine learning component is included. Instead CIMEL relies on a<br />
precisely defined manual process. Like TOA, this system is restricted by the<br />
Created 7/22/2002 9:39 AM April Kontostathis<br />
Last saved 7/24/2002 4:59 PM This copy printed 8/28/2003 8:44 PM
electronic availability <strong>of</strong> documentation in a given subject area. Furthermore,<br />
the INSPEC®[Inspec] query tool is currently based on abstracts that are<br />
downloaded to a local database, which must be periodically refreshed. Unlike<br />
TOA, CIMEL provides specific parameters for identifying an emerging trend,<br />
rather than solely relying on the domain expertise <strong>of</strong> the user.<br />
Visualization<br />
At the current time the visualization component for trend detection CIMEL<br />
is under development.<br />
Evaluation<br />
Two groups <strong>of</strong> students in a Programming Languages class were asked to<br />
identify emerging trends in the area <strong>of</strong> Inheritance. Group B (experimental)<br />
viewed a multimedia tutorial on the methodology and case study; Group A<br />
(control) did not. Hypothesis testing was performed on the standard precision<br />
metric <strong>of</strong> the groups. Precision for a student was found by dividing the number<br />
<strong>of</strong> actual emerging trends found (one or two for this experiment) by the number<br />
<strong>of</strong> total trends found (two, if the student completed the assignment). Recall was<br />
not determined since a complete list <strong>of</strong> emerging trends was not available. A<br />
lower tail t-test concluded with 95% confidence that the mean precision <strong>of</strong><br />
students that used the methodology (Group B) was significantly greater than the<br />
mean precision <strong>of</strong> students that did not use the methodology (Group A). These<br />
results suggest that detecting emerging trends is much more likely when using<br />
the methodology [Roy Thesis].<br />
2.3 TimeMines<br />
The TimeMines system [Swan] takes free text data, with explicit date tags, and<br />
develops an <strong>overview</strong> timeline <strong>of</strong> the most important topics covered by the<br />
corpus. Figure 4 (taken from [Swan]) presents the sample output from<br />
TimeMines. TimeMines relies on Information Extraction (IE) and Natural<br />
Language Processing (NLP) techniques to gather the data. The system uses<br />
hypothesis testing techniques to determine the most relevant topics in a given<br />
timeframe. Only the ‘most significant and important information’ (as<br />
determined by the program) is presented to the user.<br />
TimeMines begins its processing with a default model which assumes the<br />
occurrence <strong>of</strong> a feature depends only on its base rate <strong>of</strong> occurrence, and does not<br />
vary with time. Each feature in a document is compared to the default model. A<br />
statistical test is used to determine if the feature being tested is significantly<br />
different than what the model would expect. If so, the feature is kept for future<br />
processing, if the feature is not significantly different than the baseline, it is<br />
ignored.<br />
Created 7/22/2002 9:39 AM April Kontostathis<br />
Last saved 7/24/2002 4:59 PM This copy printed 8/28/2003 8:44 PM
Figure 4: TimeMines sample output<br />
The reduced set <strong>of</strong> features that is developed using the first round <strong>of</strong><br />
hypothesis testing is then input into a second processing phase which groups<br />
related features together. The grouping again relies on probabilistic techniques<br />
that combine terms that tend to appear in the same timeframes into a single<br />
topic. Finally, a threshold is used to determine which topics are most important<br />
and these are displayed via the timeline interface (figure 4). The threshold is set<br />
manually, and was determined empirically.<br />
Like TOA, TimeMines present a model <strong>of</strong> the data, without drawing any<br />
specific conclusions about whether or not a topic is emergent. It simply presents<br />
the most important topics to the user, and relies on the user’s domain knowledge<br />
for evaluation <strong>of</strong> the topics.<br />
Input Data and Attributes<br />
The TDT and TDT-2 corpora were date tagged and part-<strong>of</strong>-speech tagged<br />
with JTAG [Xu] for this method (TDT-2 was preliminarily tagged with Nymble<br />
[Bikel]). In the TimeMines system, an initial attribute list <strong>of</strong> all “named<br />
entities” and certain noun phrases is generated. A named entity is defined as a<br />
specified person, location, or organization (found by the Badger IE system<br />
[Fisher] in the given example). Noun phrases match the regular expression<br />
(N|J)*N for up to five words, where N is a noun, J is an adjective, | indicates<br />
union, and * indicates zero or more occurrences. The date-specified documents<br />
are thus represented as a “bag <strong>of</strong> attributes”, where each attribute is true or false<br />
(i.e., whether the named entity or noun phrase is contained in the document or<br />
not). The attributes are shown in table 9.<br />
Attributes Detail Generation<br />
n-gram Person, location, or organization Automatic<br />
Created 7/22/2002 9:39 AM April Kontostathis<br />
Last saved 7/24/2002 4:59 PM This copy printed 8/28/2003 8:44 PM
Regular Follows (N|J)*N pattern for up to five Automatic<br />
expression words, e.g., hot topic research<br />
Presence “True” if the n-gram or regular<br />
expression occurs in the document,<br />
else “False”. Each document has a<br />
presence attribute for every n-gram<br />
and regular expression.<br />
Automatic<br />
Date Given by day Automatic<br />
Table 9: TimeMines Attributes<br />
Learning Algorithms<br />
There are two separate machine learning aspects present in the TimeMines<br />
application. First, TimeMines must select the ‘most significant and important<br />
information’ to display. To do this, TimeMines must extract the ‘most<br />
significant’ features from the input documents.<br />
TimeMines uses a statistical model based on hypothesis testing to choose the<br />
most relevant features. The system assumes a stationary random model for all<br />
features (noun phrases and named entities) extracted from the corpus. The<br />
stationary random model assumes that all features are stationary (meaning they<br />
do not vary over time) and the random processes generating any pair <strong>of</strong> features<br />
are independent. Features whose actual distribution matches this model are<br />
considered to contain no new information and are discarded. Features that vary<br />
greatly from the model are kept for further processing. The hypothesis testing is<br />
time dependent. In other words, for a specific block <strong>of</strong> time, a feature either<br />
matches the model (at a given threshold) or violates the model. Thus the phrase<br />
‘Oklahoma City Bombing’ may be significant for one time slice, but not<br />
significant for another.<br />
After the feature set has been condensed, TimeMines uses another learning<br />
algorithm, again based on hypothesis testing. Using the reduced feature set,<br />
TimeMines checks for features within a given time period that have similar<br />
distributions. These features are grouped into a single ‘topic.’ Thus each time<br />
period may be assigned a small number <strong>of</strong> topic areas, represented by a larger<br />
number <strong>of</strong> features.<br />
One potential drawback <strong>of</strong> ranking the general topics derived from the<br />
significant attributes was discussed [Swan]. The occurrence <strong>of</strong> an attribute is<br />
measured against all other occurrences <strong>of</strong> it in the corpus, thus a consistently<br />
heavily used attribute may not distinguish itself properly. The Kenneth Starr-<br />
President Clinton investigation is unquestionably the most covered story in the<br />
TDT-2 corpus, yet ranked 12 th because it is so prevalent throughout. Against a<br />
longer time period, including time after coverage had died down, the story<br />
probably would have ranked 1 st .<br />
Created 7/22/2002 9:39 AM April Kontostathis<br />
Last saved 7/24/2002 4:59 PM This copy printed 8/28/2003 8:44 PM
Like all <strong>of</strong> the algorithms we present here, the final determination <strong>of</strong> whether<br />
or not a topic is emerging is left to the user, but unlike CIMEL [section 2.2] and<br />
TOA [section 2.1], the user does not direct the TimeMines system. This system<br />
is completely automated; given a time-tagged corpus and it responds with a<br />
graphical representation <strong>of</strong> the topics that dominate the corpus during specific<br />
time periods.<br />
Visualization<br />
TimeMines generates timelines automatically for visualization <strong>of</strong> temporal<br />
locality <strong>of</strong> topics and the identification <strong>of</strong> new information within a topic. The<br />
x–axis represents time, while the y-axis represents the relative importance <strong>of</strong> a<br />
topic. The most statistically significant topic appears at the top (Figure 4). Each<br />
block in the visualization interface includes all the terms used to describe a topic<br />
and thus indicates the coverage within the corpus. Clicking on a term (named<br />
entity or noun phrase) pops up a menu <strong>of</strong> all the associated features <strong>of</strong> that type<br />
within the topic, and a sub-menu option allows the user to choose this feature as<br />
the label, or to obtain more information about the feature. However no effort is<br />
made to infer any hierarchical structure in the appearance <strong>of</strong> the feature in the<br />
timeline.<br />
Evaluation<br />
Two hypotheses are evaluated: Do term occurrence and co-occurrence<br />
measures properly group documents into logical time-dependent stories, and, are<br />
the stories themselves meaningful to people? [Swan] A randomization test<br />
[Edgington] was conducted to support the first hypothesis. The documents were<br />
shuffled and assigned an alternate date, but were otherwise left intact. From an<br />
information retrieval (IR) standpoint the corpus looked the same, since term<br />
frequency and inverse document frequency were preserved. The authors<br />
concluded results from the test overwhelming suggest the groupings are logical<br />
and not random.<br />
The second hypothesis was explored with two methods <strong>of</strong> evaluation but<br />
results were inconclusive. The first evaluation method used precision and recall<br />
metrics from IR. The January 1996 Facts on File [Facts] listed 24 major stories,<br />
which were used as the “truth” set to compare with the TimeMines-generated<br />
major stories. Precision was defined as the number <strong>of</strong> Facts on File major<br />
stories found by TimeMines divided by the total number <strong>of</strong> Facts on File major<br />
stories. Recall was defined as the number <strong>of</strong> Facts on File major stories found<br />
by TimeMines divided by the total number <strong>of</strong> TimeMines-generated major<br />
stories. A precision <strong>of</strong> 0.25, a recall <strong>of</strong> 0.29, and an examination <strong>of</strong> the stories<br />
listed in the truth and generated sets suggested an incompatibility between the<br />
two sets. Whether the underlying problem was the specific truth set or the use<br />
<strong>of</strong> precision and recall was not addressed.<br />
The second evaluation method attempted to tune the 2 threshold. Four<br />
students manually determined whether the automatic groupings related to zero,<br />
Created 7/22/2002 9:39 AM April Kontostathis<br />
Last saved 7/24/2002 4:59 PM This copy printed 8/28/2003 8:44 PM
one, or multiple topics. But based on a pair wise Kappa statistic, the manual<br />
results could not be distinguished from random results. [Swan, Allan]<br />
2.4 New Event <strong>Detection</strong><br />
New event detection, also referred to as first story detection, is specifically<br />
included as a subtask in the TDT initiative. New event detection requires<br />
identifying those news stories that discuss an event that has not already been<br />
reported in earlier stories. New event detection operates without a predefined<br />
query. Typically algorithms look for keywords in a news story and compare the<br />
story with earlier stories. New event detection insists that the input be processed<br />
sequentially in date order. Only past stories can be used for evaluation, not the<br />
entire corpus.<br />
A new event detection algorithm based on a single pass clustering algorithm<br />
is presented in [Allan]. The content <strong>of</strong> each story is represented as a query.<br />
When a new story is processed, all the existing queries (previous stories) are run<br />
against it. If the ‘match’ exceeds a predefined threshold (discussed below) the<br />
new story is assumed to be a continuation <strong>of</strong> the query story. Otherwise it is<br />
marked as a new story.<br />
<strong>An</strong> interesting characteristic <strong>of</strong> news stories is that events <strong>of</strong>ten occur in<br />
bursts. Figure 5, taken from [Yang] shows a temporal histogram <strong>of</strong> an event<br />
where the X axis represents time in terms <strong>of</strong> days (1 through 365) and the Y axis<br />
is the story count per day.<br />
Figure 5: temporal histogram <strong>of</strong> news data<br />
News stories discussing the same event tend to be in temporal proximity and<br />
hence lexical similarity and temporal proximity are considered to be two criteria<br />
Created 7/22/2002 9:39 AM April Kontostathis<br />
Last saved 7/24/2002 4:59 PM This copy printed 8/28/2003 8:44 PM
for document clustering. Also, a time gap between the bursts as indicated in the<br />
graph discriminates between two distinct events. New event detection uses a<br />
classifier-based approach to identify new stories. The system incorporates the<br />
use <strong>of</strong> temporal proximity and is more likely to match stories that appear in the<br />
same timeframe.<br />
With proper tuning the algorithm was able to separate news stories related to<br />
the Oklahoma City Bombing from those about the World Trade Center<br />
bombing. However, some stories could not be detected. For example, the crash<br />
<strong>of</strong> Flight 427 could not be distinguished from other airplane accidents, and the<br />
OJ Simpson trial could not be separated from other court cases.<br />
Input Data and Attributes<br />
All stories in the TDT corpus deemed relevant to 25 selected “events” were<br />
processed. For new event detection, each story is represented by a query and<br />
threshold. Table 10 lists all the attributes required for the query. The N most<br />
frequent single words comprise the query, and are weighted and assigned a<br />
“belief” value by the Inquery system [Allan, Ballesteros, et al.], indicating the<br />
relevance <strong>of</strong> the word in the story to the query. Belief is calculated using term<br />
frequency and inverse document frequency. Term frequency is defined by the<br />
number <strong>of</strong> times the word occurs in the story, the length <strong>of</strong> the story, and the<br />
average length <strong>of</strong> a story in the collection. Inverse document frequency is the<br />
log <strong>of</strong> the number <strong>of</strong> stories in the collection divided by the number <strong>of</strong> stories<br />
that contain the word.<br />
Attribute Detail Generation<br />
Unigram A single word Automatic<br />
Frequency Number <strong>of</strong> times unigram occurs,<br />
per story<br />
Automatic<br />
Count Total number <strong>of</strong> unigrams, per story Automatic<br />
Mean Average number <strong>of</strong> unigrams per<br />
story<br />
Automatic<br />
Frequency Number <strong>of</strong> stories in which unigram<br />
occurs<br />
Automatic<br />
Count Number <strong>of</strong> stories Automatic<br />
Date Given by available granularities Automatic<br />
Table 10: New Event <strong>Detection</strong> Attributes<br />
Learning Algorithms<br />
The algorithm presented in [Allan] is based on a single-pass clustering<br />
algorithm that detects new stories by comparing each story processed to all <strong>of</strong><br />
the previous stories detected, which are saved as queries in the system. As each<br />
Created 7/22/2002 9:39 AM April Kontostathis<br />
Last saved 7/24/2002 4:59 PM This copy printed 8/28/2003 8:44 PM
incoming story is processed, all previous ‘queries’ are run against it. If a story<br />
does not match any <strong>of</strong> the existing queries, the story is considered a new event.<br />
The system relies on a threshold to match the queries to the incoming stories.<br />
The initial threshold for a query is set by evaluating the query with the story<br />
from which it originated. If a subsequent story meets or exceeds this initial<br />
threshold for the query, the story is considered a match. The threshold function<br />
uses the evaluation function <strong>of</strong> the Inquery system [Allan, Ballesteros, et al].<br />
Since new event detection demands that documents be processed in order,<br />
traditional IR metrics such as such as document frequency (number <strong>of</strong><br />
documents containing the term) and average document length are not readily<br />
available. To overcome this problem, an auxiliary collection is used. The<br />
thresholding function was adapted further to take advantage <strong>of</strong> the time<br />
dependent nature <strong>of</strong> the news story collection. A time penalty was added to the<br />
threshold, increasing the value required to ‘match’ a story, as the stories grow<br />
further apart over time.<br />
Like the TimeMines system, the new event detection system described here<br />
is completed automated. Given a corpus, it provides a list <strong>of</strong> ‘new events’ in the<br />
form <strong>of</strong> news stories that first describe an occurrence. New event detection<br />
differs from emerging trend detection because it is not interested in the gradual<br />
change <strong>of</strong> a topic over time. Instead it is focused on the sudden appearance <strong>of</strong><br />
an unforeseen event.<br />
Visualization<br />
The new event detection system is based on Lighthouse [Leuski and Allan],<br />
an interactive information retrieval system, which provides a ranked list <strong>of</strong><br />
search results together with 2 and 3 dimensional visualizations <strong>of</strong> interdocument<br />
similarities. After events are extracted, a visual timeline is<br />
constructed to show how those events occur in time or how they relate to one<br />
another.<br />
Evaluation<br />
Since this is a detection task, miss (false negative) and false alarm (false<br />
positive) rates were examined more thoroughly than the more conventional<br />
precision and recall [Allan, Papka, et al.]. Arriving at meaningful thresholds for<br />
these rates was difficult, and as a complement, <strong>Detection</strong> Error Trade<strong>of</strong>f (DET)<br />
curves [Martin] were studied. DET curves highlight how miss and false alarm<br />
rates vary with respect to each other (each is plotted on an axis in a plane). A<br />
perfect system with zero misses and false alarms would be positioned at the<br />
origin, thus, DET curves “closer” to the origin are generally better. “Close” was<br />
defined as the Euclidean distance from the DET curve to the origin [Allan,<br />
Papka, et al.].<br />
Eleven passes were taken through the corpus, removing zero to ten leading<br />
stories about an event. Using nearly all (400) single-word attributes in the<br />
Created 7/22/2002 9:39 AM April Kontostathis<br />
Last saved 7/24/2002 4:59 PM This copy printed 8/28/2003 8:44 PM
queries resulted in averages <strong>of</strong> 46% for the miss rate, 1.46% for the false alarm<br />
rate, 54% for recall, and 45% for precision.<br />
2.5 ThemeRiver<br />
Similar to TimeMines, ThemeRiver [Havre] summaries the main topics in a<br />
corpus and presents a summary <strong>of</strong> the importance <strong>of</strong> each topic via a robust user<br />
interface. The topical changes over time are shown as a river <strong>of</strong> information.<br />
The ‘river’ is made up <strong>of</strong> multiple streams. Each stream represents a topic and<br />
each topic represented by a color and maintains its place in the river, relative to<br />
other topics. See figure 6 for an example.<br />
Figure 6: ThemeRiver sample output [taken from Havre]<br />
The river metaphor allows the user to track the importance <strong>of</strong> a topic over<br />
time (represented on the horizontal access). The data represented in figure 6 is<br />
from Fidel Castro’s speeches. You can see that Castro frequently mentioned oil<br />
just before American oil refineries were confiscated in 1960 (shown as the<br />
second vertical line from the left in figure 6). Oil is the large bubble<br />
immediately preceding this dotted line in the middle <strong>of</strong> the river. At no other<br />
time did Castro dwell on that topic in the 18-month period represented by this<br />
corpus.<br />
Such patterns in the data may confirm or refute the user’s knowledge <strong>of</strong><br />
hypotheses about the collection. Like TOA and TimeMines, ThemeRiver<br />
does not presume to indicate which topics are emergent. The visualization is<br />
Created 7/22/2002 9:39 AM April Kontostathis<br />
Last saved 7/24/2002 4:59 PM This copy printed 8/28/2003 8:44 PM
intended to provide the user with information about the corpus. ThemeRiver<br />
presents a topic- or feature-centered view <strong>of</strong> the data. This topic-centered view<br />
is a distinguishing characteristic <strong>of</strong> <strong>ETD</strong>. Related areas in information retrieval,<br />
such as text filtering and text categorization, usually are document-centered.<br />
Input Data and Attributes<br />
The corpus in the example presented consisted <strong>of</strong> speeches, interviews,<br />
articles, and other text about Fidel Castro over a 40-year period. ThemeRiver<br />
automatically generates a list <strong>of</strong> possible topics, called “theme words”, <strong>of</strong> which<br />
a subset is manually chosen for the attributes (the example narrowed the list to<br />
64). Counts <strong>of</strong> how many documents contained a particular theme word for<br />
each time interval provide the input for the method. <strong>An</strong> alternate count, using<br />
the number <strong>of</strong> occurrences <strong>of</strong> the theme word for each time interval was<br />
suggested but not implemented. [Havre, Hetzler, Whitney, et al.]<br />
The automatic method for generating the initial list <strong>of</strong> theme words was not<br />
specified, nor was the procedure for deciding which or how many <strong>of</strong> the theme<br />
words should be included in the subset as an actual attribute. It does appear that<br />
counts are computed after these attributes are chosen, effectively making this<br />
attribute selection a manual process (i.e., not automatic based strictly on the<br />
counts, see Table 11).<br />
Attribute Detail Generation<br />
Unigram A single word Manual<br />
Frequency Number <strong>of</strong> documents in which Automatic<br />
Date<br />
unigram occurs, per time interval<br />
Given by month Automatic<br />
Table 11: ThemeRiver Attributes<br />
Learning Algorithms<br />
The ThemeRiver application does not use a learning algorithm per se.<br />
Like TOA, it provides a view <strong>of</strong> the data that an experienced domain expert can<br />
use to confirm or refute a hypothesis about the data. ThemeRiver begins by<br />
binning time-tagged data into time intervals. A set <strong>of</strong> terms, or themes, that<br />
represent the data is chosen and the ‘river’ is developed based on the strength <strong>of</strong><br />
each theme in the collection. The themes are chosen by automatically<br />
developing a list <strong>of</strong> words that are present in the data and then manually<br />
selecting a subset that represent various topics. The number <strong>of</strong> documents<br />
containing the word determines the strength <strong>of</strong> each theme in each time interval.<br />
Other methods <strong>of</strong> developing the themes and strengths are possible. The visual<br />
component <strong>of</strong> ThemeRiver is the most important aspect <strong>of</strong> this work,<br />
particularly as it applies to trend detection.<br />
Created 7/22/2002 9:39 AM April Kontostathis<br />
Last saved 7/24/2002 4:59 PM This copy printed 8/28/2003 8:44 PM
Visualization<br />
The ThemeRiver system uses the river metaphor to show the flow <strong>of</strong> data<br />
over time (Figure 6). While the “river” flows horizontally, each vertical section<br />
<strong>of</strong> the river corresponds to an ordered time slice and a colored current within the<br />
“river” identifies each topic or theme. The width <strong>of</strong> the “river” changes with the<br />
emergence or disappearance <strong>of</strong> topic thereby making the system effective in<br />
cases where there is no major variation in topic. Thus the width <strong>of</strong> the river<br />
represents the collective strength <strong>of</strong> the selected theme.<br />
The curves in figure 6 show how interpolation is done to obtain a river<br />
metaphor. The idea is to produce a smooth curve with positive stream width for<br />
better visual tracking <strong>of</strong> stream across time. Even though this technique aids<br />
human pattern recognition, a histogram may be more accurate. The algorithm<br />
interpolates between points to generate the smooth curves (continuity in the flow<br />
<strong>of</strong> the river).<br />
Figure 7: Color family representation for ThemeRiver, taken from [Havre, Hetzler, et.al.]<br />
ThemeRiver makes judicious use <strong>of</strong> color, leveraging human perception<br />
and cognitive abilities. Themes are sorted into related groups, represented by a<br />
color family. This allows viewing <strong>of</strong> a large number <strong>of</strong> themes that can easily<br />
be separated due to color variation. For example in figure 7, “germany”,<br />
“unification”, “gdr” and “kohl” are represented by different shades <strong>of</strong> green and<br />
hence can easily be identified as belonging to same group.<br />
Created 7/22/2002 9:39 AM April Kontostathis<br />
Last saved 7/24/2002 4:59 PM This copy printed 8/28/2003 8:44 PM
Evaluation<br />
Evaluation, or usability in such visual applications, was conducted with two<br />
users [Havre, Hetzler, Whitney, et al.]. After given some background<br />
information about the data, the users were asked about specifics that fell under<br />
the following five general questions:<br />
• Did the users understand the visualization?<br />
• Could they determine differences in theme discussion?<br />
• Did the visualization prompt new observations about the data?<br />
• Did the users interpret the visualization in any unexpected ways?<br />
• How did the interpretation <strong>of</strong> the visualization differ from that <strong>of</strong> a<br />
histogram?<br />
Observation, verbal protocol, and a questionnaire were used to gather<br />
feedback. This evaluation method is formalized well, but it lacks significance<br />
due to the small sample.<br />
2.6 PatentMiner<br />
The PatentMiner system was developed to discover trends in patent data using a<br />
dynamically generated SQL query based upon selection criteria given by the<br />
user [Lent]. The system is connected to an IBM DB2 database containing all<br />
granted US patents [USPTO]. There are two major components to the system,<br />
phrase identification using sequential pattern mining [Agrawal & Srikant, 1995;<br />
Srikant & Agrawal, 1996] and trend detection using shape queries [2].<br />
The phrases that matched a increasing usage query on US patents [USPTO]<br />
in the category “Induced Nuclear Reactions: Processes, Systems and Elements”<br />
are shown in figure 8.<br />
Created 7/22/2002 9:39 AM April Kontostathis<br />
Last saved 7/24/2002 4:59 PM This copy printed 8/28/2003 8:44 PM
Figure 8: PatentMiner Sample Output<br />
Input Data and Attributes<br />
<strong>An</strong> IBM DB2 database containing all US Patents [USPTO] served as the<br />
basis for the corpus. Several procedures prepare the data for attribute extraction.<br />
Stopwords are removed. Long integer transaction ID’s are assigned to the<br />
remaining words, indicating position in the document and occurrences <strong>of</strong><br />
sentence, paragraph, and section boundaries. After a subset <strong>of</strong> patents is<br />
specified by category and date range, the Generalized Sequential Patterns (GSP)<br />
algorithm [Srikant] selects user-defined attributes, called “phrases”. A phrase<br />
can be any sequence <strong>of</strong> words, with a minimum and maximum “gap” between<br />
any <strong>of</strong> the words. Gaps can be described in terms <strong>of</strong> words, sentences,<br />
paragraphs, or sections. For example, if the minimum sentence gap is one for<br />
the phrase “emerging trends”, than “emerging” and “trends” must occur in<br />
separate sentences. Or if the maximum paragraph gap is one, than “emerging”<br />
and “trends” must occur in the same paragraph. A transaction time window<br />
indicates the number <strong>of</strong> words to group together before counting gap length.<br />
Only phrases above a minimum “support” – the percentage <strong>of</strong> all phrases that<br />
contain the user-defined phrase – are considered. A shape definition language<br />
(SDL) [Agrawal, Psaila, et al.] specifies which types <strong>of</strong> trends (e.g., upwards,<br />
spiked, etc.) are displayed. [Lent] Table 12 summarizes the attributes.<br />
The number <strong>of</strong> phrases selected can be substantial, given their very openended<br />
nature. Two pruning methods are discussed in [Lent]. A non-maximal<br />
phrase <strong>of</strong> a maximal phrase may be ignored if the support <strong>of</strong> the two phrases is<br />
Created 7/22/2002 9:39 AM April Kontostathis<br />
Last saved 7/24/2002 4:59 PM This copy printed 8/28/2003 8:44 PM
similar. Or, a syntactic sub-phrase (general, high-level) might be preferred over<br />
a larger phrase (specific, low-level) initially, after which specific low-levels<br />
could be easier to pinpoint.<br />
Attribute Detail Generation<br />
n-gram Search phrase, e.g., emerging trends Manual<br />
Size Minimum gap, with distinct gaps for words,<br />
sentences, paragraphs, and sections.<br />
Manual<br />
Size Maximum gap, with distinct gaps for words,<br />
sentences, paragraphs, and sections.<br />
Manual<br />
Size Transaction time window, groups words in a<br />
phrase before determining gaps<br />
Manual<br />
Ratio Support, found number <strong>of</strong> search phrases<br />
divided by total number <strong>of</strong> phrases<br />
Manual<br />
Date Given by available granularities Manual<br />
Shape Graphical trend appearance over time, e.g.,<br />
spiked or downwards<br />
Manual<br />
Table 12: PatentMiner Attributes<br />
Learning Algorithms<br />
Most <strong>of</strong> the systems presented in this survey use traditional IR techniques to<br />
extract features from the text corpus that serves as input; the PatentMiner system<br />
takes a different approach. PatentMiner adapts a sequential pattern matching<br />
technique that is frequently used in data mining systems. This technique treats<br />
each word in the corpus as a transaction. The pattern matching system looks for<br />
frequently occurring patterns <strong>of</strong> words. The words may be adjacent, or<br />
separated by a variable number <strong>of</strong> other words (up to some maximum that is set<br />
by the user). This technique allows the system to identify frequently cooccurring<br />
terms and treat them as a single topic. [Lent] refers to the resulting<br />
collection <strong>of</strong> words as a phrase.<br />
As with TimeMines, documents in the input data set are binned into various<br />
collections based on their date information. The above technique is used to<br />
extract phrases from each bin and the frequency <strong>of</strong> occurrence <strong>of</strong> each phrase in<br />
all bins is calculated. A shape query is used to determine which phrases to<br />
extract, based on the user’s inquiry.<br />
The shape query processing is another learning tool borrowed from data<br />
mining [2]. In the PatentMiner system, the phrase frequency counts represent a<br />
data store that can be mined using the shape query tool. The shape query has the<br />
ability to match upward and downward slopes based on the frequency counts.<br />
For example, a rapidly emerging phrase may have be frequency occurring for<br />
two concurrent time slices, then level <strong>of</strong>f, before continuing on an upward trend.<br />
The shape query allows the user to graphically define various shapes for trend<br />
Created 7/22/2002 9:39 AM April Kontostathis<br />
Last saved 7/24/2002 4:59 PM This copy printed 8/28/2003 8:44 PM
detection (or other applications) and will retrieve the phrases with frequency<br />
count distributions that match the graph.<br />
Like ThemeRiver, TimeMines and others, the PatentMiner system<br />
presents a list <strong>of</strong> phrases to the user. The domain expert must then identify the<br />
true trends.<br />
Visualization<br />
The system is interactive; a histogram is displayed showing the occurrences<br />
<strong>of</strong> patents by year based on the user’s selection criteria. The user has the ability<br />
to later on focus on a specific time period and to select various shape queries to<br />
explore the trends.<br />
Evaluation<br />
Like TOA, the PatentMiner system lacks an evaluation component. While it<br />
automatically generates and displays potential trends [Lent], no claim is made<br />
on the validity <strong>of</strong> those trends. The visualization is intuitive, but no user study<br />
on its effectiveness is reported. Furthermore, no metrics are presented that<br />
verify that the data conveyed reflects reality.<br />
2.7 HDDI<br />
Our research has led to the development <strong>of</strong> the Hierarchical Distributed<br />
Dynamic Indexing (HDDI) system [Pottenger, et al. – 2001, Bader, et al. –<br />
2001, Bouskila and Pottenger - 2000]. The HDDI system provides core text<br />
processing including information/feature extraction, text mining/machine<br />
learning algorithms and support for evaluation for many applications, including<br />
<strong>ETD</strong>.<br />
[Pottenger and Yang – 2001] describes an algorithm for detecting emerging<br />
trends in text collections based on semantically determined clusters <strong>of</strong> terms.<br />
The HDDI system is used to extract linguistic features from a repository <strong>of</strong><br />
textual data and to generate clusters based on the semantic similarity <strong>of</strong> these<br />
features. The algorithm takes a snapshot <strong>of</strong> the statistical state <strong>of</strong> a collection at<br />
multiple points in time. The rate <strong>of</strong> change in the size <strong>of</strong> the clusters and in the<br />
frequency and association <strong>of</strong> features is used as input to a neural network that<br />
classifies topics as emerging or non-emerging.<br />
In follow-on experiments we were able to duplicate the precision achieved<br />
by the neural network with the C4.5 decision tree learning algorithm [Zhou].<br />
The run time performance was significantly better with the decision tree<br />
approach. These experiments show that it is possible to detect emerging<br />
concepts in an on-line environment.<br />
We modeled the complex non-linear classification process using neural<br />
networks. The datasets, which included three years <strong>of</strong> abstracts related to<br />
processor and pipeline patent applications, were separated by year and a set <strong>of</strong><br />
Created 7/22/2002 9:39 AM April Kontostathis<br />
Last saved 7/24/2002 4:59 PM This copy printed 8/28/2003 8:44 PM
concepts and clusters was developed for each year. In order to develop a<br />
training set, 14530 concepts were extracted and manually labeled. The system<br />
was, for example, able to correctly identify “Low power CMOS with DRAM” as<br />
an emerging trend in this dataset.<br />
Like most other algorithms that we have reviewed, these algorithms rely on<br />
the domain expert for the final determination; thus the goal <strong>of</strong> the system is to<br />
screen out non-emerging topics whenever possible. Unlike the first story<br />
detection algorithms, our research focuses on integrative or non-disruptive<br />
emergence <strong>of</strong> topics, as opposed to the appearance <strong>of</strong> completely new topics.<br />
Threshold [0,1] +<br />
Positive Output<br />
[0,1]<br />
><br />
Input Features<br />
Yes : <strong>Emerging</strong> Concept<br />
Negative Output<br />
[0,1]<br />
Output Layer<br />
Hidden Layer<br />
Input Layer<br />
Created 7/22/2002 9:39 AM April Kontostathis<br />
Last saved 7/24/2002 4:59 PM This copy printed 8/28/2003 8:44 PM<br />
No<br />
Figure 9: Using a neural net to detect emerging trends<br />
Input Data and Attributes<br />
Four databases were used to formulate a corpus: the US patent database<br />
[USPTO], the IBM patent database [Delphion], the INSPEC®[Inspec] database,<br />
and the COMPENDEX® [Compendex] database. Initial attribute selection
(Table 10) requires parsing and tagging before extraction. The parser retains<br />
only relevant sections <strong>of</strong> the original documents. The tagger attaches a part-<strong>of</strong>speech<br />
label to each word using lexical and contextual rules. A finite-state<br />
machine extracts complex noun phrases (“concepts”) according to the regular<br />
expression<br />
C?(G|P|J)*N+(I*D?C?(G|P|J)*N+)*<br />
where C is a cardinal number, G is verb (gerund or present participle), P is a<br />
verb (past participle), J is an adjective, N is a noun, I is a preposition, D is a<br />
determiner, ? indicates zero or one occurrence, | indicates union, * indicates zero<br />
or more occurrences, and + indicates one or more occurrence [Bader]. Counts<br />
<strong>of</strong> each concept and counts <strong>of</strong> co-occurrence <strong>of</strong> concept pairs are recorded<br />
[Pottenger, Yang].<br />
A similarity between concept pairs is calculated based on co-occurrence<br />
information. The concepts are then grouped into regions <strong>of</strong> semantic locality<br />
[Chen, H.], [Pottenger]. The mean and standard deviation <strong>of</strong> the similarity,<br />
along with a parameter <strong>of</strong> the number <strong>of</strong> standard deviations, determine the<br />
threshold ¡ used in the first step <strong>of</strong> the sLoc algorithm [Bouskila and Pottenger,<br />
2000] for finding such regions; cluster size is used in the last step (both are<br />
pruning mechanisms). As ¡ increases, the number <strong>of</strong> arcs decreases, resulting in<br />
smaller but more focused semantic regions. Too large a ¡ could produce no<br />
regions, while too small a ¡ could produce too many regions. Thus, statistically<br />
finding the optimum values for ¡ (and the related ¢ ) is worthwhile, and work<br />
continues in this area. Empirical research supports an optimum value <strong>of</strong> =<br />
1.65. [Yang] The identification <strong>of</strong> clusters is an unsupervised learning step,<br />
which produces values used as attributes used in the supervised learning process<br />
discussed below.<br />
<strong>An</strong> emerging concept satisfies two principles: it should grow semantically<br />
richer over time (i.e., occur with more concepts in its region), and it should<br />
occur more <strong>of</strong>ten as more items reference it [Pottenger and Yang]. Using a<br />
cluster-based rather than an item-based approach, an artificial neural network<br />
model takes seven inputs (and one tuning threshold parameter) to classify a<br />
concept as emerging or not [Pottenger and Yang]. The seven inputs are<br />
described in Table 14.<br />
Attribute Detail Generation<br />
Regular A concept (see text for Automatic<br />
expression definition), e.g., emerging hot<br />
topic detection<br />
Frequency Number <strong>of</strong> times each concept<br />
occurs over all documents<br />
Automatic<br />
Frequency Number <strong>of</strong> co-occurrence <strong>of</strong> Automatic<br />
concept pairs over all<br />
Created 7/22/2002 9:39 AM April Kontostathis<br />
Last saved 7/24/2002 4:59 PM This copy printed 8/28/2003 8:44 PM
Similarity<br />
documents<br />
Arc weight between concepts Automatic<br />
Mean Average arc weight Automatic<br />
Standard<br />
Deviation<br />
Arc weight standard deviation Automatic<br />
Table 13: HDDI Attributes for Regions <strong>of</strong> Semantic Locality Identification<br />
Attribute Detail Generation<br />
Frequency Number <strong>of</strong> times concept occurs in<br />
trial year<br />
Automatic<br />
Frequency Number <strong>of</strong> times concept occurs in<br />
the year before trial year<br />
Automatic<br />
Frequency Number <strong>of</strong> times concept occurs in<br />
the year 2 years before trial year<br />
Automatic<br />
Frequency Total number <strong>of</strong> times concept occurs<br />
in all years before trial year<br />
Automatic<br />
Count Number <strong>of</strong> concepts in cluster Automatic<br />
containing the concept in trial year<br />
Count Number <strong>of</strong> concepts in cluster Automatic<br />
Count<br />
containing the concept in the year<br />
before trial year<br />
Number <strong>of</strong> words in the concept with<br />
length at least four<br />
Automatic<br />
Table 14: HDDI Attributes for <strong>Emerging</strong> <strong>Trend</strong> <strong>Detection</strong><br />
Learning Algorithms<br />
As mentioned above, our fundamental premise is that computer algorithms<br />
can detect emerging trends by tracing changes in concept frequency and<br />
association over time. Our approach involves separating the data into timedetermined<br />
bins (like PatentMiner and TimeMines) and taking a snapshot <strong>of</strong> the<br />
semantic relationships between terms. Two particular features were important<br />
in our model. Similar to other algorithms, the frequency <strong>of</strong> occurrence <strong>of</strong> a term<br />
should increase if the term is related to an emerging trend. Also, the term<br />
should co-occur with an increasing number <strong>of</strong> other terms if it is an emerging<br />
trend. To our knowledge, only our system has exploited term co-occurrence for<br />
automatic <strong>ETD</strong>.<br />
The first learning model we employed is a feed-forward, back-progation<br />
artificial neural network (figure 9). We used a standard 3-layer network (one<br />
Created 7/22/2002 9:39 AM April Kontostathis<br />
Last saved 7/24/2002 4:59 PM This copy printed 8/28/2003 8:44 PM
input layer, one hidden layer, one output layer). The number <strong>of</strong> hidden neurons<br />
was varied to optimize our results.<br />
The attributes were extracted as described in the previous section and used as<br />
input to both the neural network model [Pottenger and Yang], and to various<br />
other data mining algorithms such as c4.5 decision trees, support vector<br />
machines, etc. [Zhou]. In all cases, we determined that the algorithms could be<br />
trained to detect emerging trends. As with other systems, precision was fairly<br />
low (although much better than the baseline) and final determination as to<br />
whether or not a term displayed by the system represents an emerging trend<br />
must be left to a domain expert.<br />
Visualization<br />
Visualization is ongoing for trend detection within the HDDI system.<br />
Evaluation<br />
Both concept extraction and trend detection evaluations were performed.<br />
For concept extraction [Bader], mean precision (number <strong>of</strong> auto-generated<br />
correct concepts / total number <strong>of</strong> auto-generated concepts) and mean recall<br />
(number <strong>of</strong> auto-generated correct concepts / total number <strong>of</strong> human-generated<br />
concepts) were calculated for three collections. The Grainger DLI database<br />
[UIUC], the US Patent Office [USPTO] and IBM patent databases [Delphion],<br />
and Boeing Airline [need ref?] safety documents had precision ranges <strong>of</strong> [91.0,<br />
96.4], [95.2, 99.2], and [91.0, 96.4] respectively, and recall ranges <strong>of</strong> [77.4,<br />
91.3], [75.6, 90.6], and [61.9, 74.2] respectively, both with 95% confidence.<br />
Automatic trend detection was measured by precision, recall, and Fβ<br />
[Pottenger and Yang]. <strong>An</strong> average precision <strong>of</strong> 0.317 constituted a 4.62 factor<br />
<strong>of</strong> improvement over baseline precision; recall averaged 0.359. Either metric<br />
could be improved by altering the neural network threshold parameter. Since<br />
good recall was the primary focus, Fβ, a weighted average <strong>of</strong> precision and<br />
recall with parameter , was also examined. β is the precision weight and<br />
F<br />
2.8 Other Related Work<br />
β<br />
=<br />
2 )<br />
( 1+<br />
β ⋅ precision ⋅ recall<br />
.<br />
2<br />
β ⋅ precision + recall<br />
Feldman and Dagan propose a technique for development <strong>of</strong> a hierarchical data<br />
structure from text databases in [Feldman]. This data structure then facilitates<br />
the study <strong>of</strong> concept distributions in text. The authors propose comparing the<br />
concept distributions from adjacent time periods. This approach to trend<br />
analysis seems promising; however, we were not able to obtain a more detailed<br />
description <strong>of</strong> the approach, or the experimental results, so we are unable to<br />
present a more comprehensive summary. Feldman has also been active in the<br />
Created 7/22/2002 9:39 AM April Kontostathis<br />
Last saved 7/24/2002 4:59 PM This copy printed 8/28/2003 8:44 PM
development <strong>of</strong> commercial products for emerging trend detection<br />
[ClearForest].<br />
We have focused on research efforts that are based upon the extraction <strong>of</strong><br />
trend information from various text databases; however, several research groups<br />
are using a different approach. [Chen and Carr] [Popescul. etal.] and<br />
[Leydesdorff ] present algorithms that use citation information for trend analysis<br />
and tracking.<br />
Several systems focus more on the visualization <strong>of</strong> textual data and can be<br />
adapted to trend detection at the discretion <strong>of</strong> the user. One such system,<br />
Envision [Nowell], allows users to explore trends in digital library metadata<br />
(including publication dates) graphically to identify emerging concepts. It is<br />
basically a multimedia digital library <strong>of</strong> computer science literature, with fulltext<br />
searching and full-content retrieval capabilities. The system employs the<br />
use colors and shapes to convey important characteristics <strong>of</strong> documents, for<br />
example, the interface uses color to show the degree <strong>of</strong> relevance.<br />
Plaisant, etal. describe a visual environment called LifeLines for reviewing<br />
personal medical histories in [Plaisant]. The visualization environment<br />
described in their work exploits the timeline concept to present a summary view<br />
<strong>of</strong> patient data.<br />
The E<strong>An</strong>alyst [Lavrenko] analyzes two types <strong>of</strong> data, textual and numerical,<br />
both with timestamps. The system predicts trends in numerical data based on the<br />
content <strong>of</strong> textual data preceding the trend. For example, the system predicts the<br />
trend in stock prices based on articles published before the trend occurs.<br />
3. COMMERCIAL SOFTWARE AVAILABILITY<br />
Commercial s<strong>of</strong>tware products are available to aid a company interested in <strong>ETD</strong>.<br />
Some companies specialize in providing content [LexisNexis] [Moreover]<br />
[Northern Light] [IDC] [GartnerG2] [Factiva], some provide general purpose<br />
information retrieval capabilities such as text extraction [Applied Semantics]<br />
[Captiva], document management [HyBrix] [Banter], search and retrieval<br />
[Banter] [HyBrix] [LexisNexis] [Text<strong>An</strong>alyst], categorization [Interwoven]<br />
[Invention Machine] [Semio] [Ser Solutions] [LexiQuest] [Stratify] [Verity],<br />
and clustering [Autonomy] [ClearForest] [Invention Machine] [Text<strong>An</strong>alyst]<br />
[Thought Share]. While all <strong>of</strong> these products can be used to facilitate an <strong>ETD</strong><br />
effort, only a few companies that we found have capabilities specifically geared<br />
toward trend analysis and detection. These products are discussed in this<br />
section.<br />
3.1 Autonomy<br />
Autonomy takes a corpus and produces a set <strong>of</strong> information clusters from within<br />
the data. These clusters can be used to identify new topics in the data by taking<br />
the cluster map from a previous time period and comparing it to the current one.<br />
Autonomy includes a cluster mapping tool called Spectrograph, which displays<br />
Created 7/22/2002 9:39 AM April Kontostathis<br />
Last saved 7/24/2002 4:59 PM This copy printed 8/28/2003 8:44 PM
a view <strong>of</strong> the clusters over time. This tool is designed to show trends in clusters,<br />
including the appearance/disappearance <strong>of</strong> topics, the spread and the cluster size.<br />
Applied to documents, the tool shows how the content stream changes over<br />
time, allowing the user to track trends and identify emerging trends.<br />
Like the research tools described in the previous section, the Spectrograph is<br />
designed to provide the user with a view into the data. The domain expect can<br />
then use the data to form more general conclusions.<br />
3.2 LexiQuest Mine<br />
LexiQuest products use advanced natural language processing technology to<br />
access, manage and retrieve textual information. LexiQuest Mine is a text<br />
mining tool designed to help the user obtain new insights by identifying key<br />
concepts and the relationships between them. It employs a combination <strong>of</strong><br />
dictionary-based linquistic analysis and statistical proximity matching to identify<br />
key concepts as well as the degree <strong>of</strong> relationship between concepts.<br />
Concept identification is achieved through the use <strong>of</strong> unabridged dictionaries<br />
and thesauri. A large medical database, MeSH, may also be used. These<br />
contain terms that may consist <strong>of</strong> multiple words. Term occurrences and term<br />
co-occurrences are counted either by paragraph or document and are used to<br />
build relational concept maps. No machine learning algorithms are employed.<br />
These relationships are displayed in a graphical map that displays the<br />
cumulative occurrence <strong>of</strong> concepts, and can be utilized for trend observation.<br />
Further analysis can be done by importing LexiMine data into the related<br />
Clementine [Clementine] tool. Ultimately the validity <strong>of</strong> the trend is left to the<br />
human domain expert and is not quantified in any way.<br />
Peugeot is using LexiQuest Mine to monitor the activities <strong>of</strong> their<br />
competitors via web data.<br />
3.3 ClearForest<br />
ClearForest provides a platform and products to extract relevant information<br />
from large amounts <strong>of</strong> text and present summary information to the user. Two<br />
particular products: ClearResearch and ClearSight are particularly helpful for<br />
<strong>ETD</strong> applications. ClearResearch is designed to present a single-screen view <strong>of</strong><br />
complex inter-relationships, enabling users to view news and research content in<br />
context ClearSight provides simple, graphic visualizations <strong>of</strong> relationships<br />
between companies, people and events in the business world. It also provides<br />
real-time updates <strong>of</strong> new product launches, management changes, emerging<br />
technologies, etc. in any specified context. Users can also drill down further into<br />
each topic to view more information or read related articles.<br />
Created 7/22/2002 9:39 AM April Kontostathis<br />
Last saved 7/24/2002 4:59 PM This copy printed 8/28/2003 8:44 PM
4. CONCLUSIONS AND FUTURE WORK<br />
We have described several semi-automatic and fully-automatic <strong>ETD</strong> systems,<br />
providing detailed information related to linguistic and statistical features,<br />
learning algorithms, training and test set generation, visualization and<br />
evaluation. This review <strong>of</strong> the literature indicates that much progress has been<br />
toward automating the process <strong>of</strong> detecting emerging trends, but there is room<br />
for improvement. All <strong>of</strong> the projects we found rely on a human domain expert<br />
to separate the emerging trends from noise in the system. Research projects that<br />
focus on creating effective processes to detect emerging trends, developing<br />
effective visualizations, and applying various learning algorithms to assist with<br />
<strong>ETD</strong> can and should continue. We are in the process <strong>of</strong> building an IT<br />
Infrastructure that includes algorithms for formal evaluation <strong>of</strong> <strong>ETD</strong> systems<br />
(www.xxx.com).<br />
Furthermore, we discovered that few projects have used formal evaluation<br />
methodologies to determine the effectiveness <strong>of</strong> the systems being created.<br />
Development and use <strong>of</strong> effective metrics for evaluation <strong>of</strong> <strong>ETD</strong> systems is<br />
critical. The results published to date simply do not allow us to compare<br />
systems to one another. Wider use <strong>of</strong> the TDT [TDT] data sets is encouraged.<br />
Usability studies should be conducted for visualization systems. Additional<br />
data sets geared specifically toward trend detection should be developed.<br />
Toward this end, we have developed a back end system to the CIMEL tutorial<br />
[Blank]. This system will gather together the data generated by the students<br />
who use the tutorial. Eventually we will be able to automatically build training<br />
sets from this data.<br />
We also note that projects tend to focus either on applying machine learning<br />
techniques to trend detection, or on the use <strong>of</strong> visualization techniques. Both<br />
techniques, when used alone, have proved inadequate thus far. Techniques that<br />
blend the use <strong>of</strong> visualization with machines learning may hold more promise.<br />
We are expanding our HDDI system to include a visualization component for<br />
trend detection. Early prototypes seem intuitively promising, but, as noted<br />
above, usability studies must be conducted to prove the effectiveness <strong>of</strong> our<br />
approach.<br />
5. INDUSTRIAL COUNTERPOINT: IS <strong>ETD</strong><br />
USEFUL? – Dan Phelps<br />
Background: The Information Mining Group at Eastman Kodak has been<br />
following developments in the text mining field since 1998. Initially, our<br />
interest was in using text mining tools to help us do a better job <strong>of</strong> understanding<br />
the content <strong>of</strong> patents as part <strong>of</strong> our patent intelligence work. More recently, we<br />
have expanded our interest to include mining the science and technology<br />
literature to get an earlier indication <strong>of</strong> new developments that our R&D<br />
Created 7/22/2002 9:39 AM April Kontostathis<br />
Last saved 7/24/2002 4:59 PM This copy printed 8/28/2003 8:44 PM
management should consider in doing their tactical and strategic planning. We<br />
have had practical experience identifying suitable data sources, working with<br />
both custom and commercial tools, and presenting information in a form that our<br />
clients find useful. This background gives me a good perspective for<br />
commenting on the potential usefulness <strong>of</strong> <strong>Emerging</strong> <strong>Trend</strong> <strong>Detection</strong> tools and<br />
some <strong>of</strong> the challenges that will come up in actually trying to use them in the<br />
corporate environment.<br />
The objective <strong>of</strong> <strong>Emerging</strong> <strong>Trend</strong> <strong>Detection</strong> is to provide an alert that new<br />
developments are happening in a specific area <strong>of</strong> interest in an automated way.<br />
It is assumed that a detected trend is an indication that some event has occurred.<br />
The person using the <strong>ETD</strong> s<strong>of</strong>tware will have to look at the data to determine the<br />
underlying development. Whether the development is important or not is a<br />
judgment call that depends on the situation and the particular information needs<br />
<strong>of</strong> the person evaluating the data.<br />
The need to become aware <strong>of</strong> new developments in science, technology, or<br />
business is critical to decision makers at all levels <strong>of</strong> a corporation. These<br />
people need to make better data-driven decisions as part <strong>of</strong> their daily work.<br />
They need data that is complete and available in a timely manner. Traditionally,<br />
people have learned about most new developments by reading various types <strong>of</strong><br />
text documents or getting the information from someone else who has read the<br />
documents. As the pace <strong>of</strong> new developments accelerates and the number <strong>of</strong><br />
documents increases exponentially, it will no longer be possible for an<br />
individual to keep up with what is happening using manual processes. There is<br />
a clear need for new tools and methodologies to bring some level <strong>of</strong> automation<br />
to these processes. <strong>ETD</strong> tools have the potential to play an important role in<br />
identifying new developments for corporate decision makers. These tools<br />
should help make it possible to look through more data sources for new<br />
developments and do it in less time than relying on current manual methods.<br />
To better understand what capabilities an <strong>ETD</strong> tool must have to be useful,<br />
one has to look at who will be using the tool. There are three broad classes <strong>of</strong><br />
potential users in a corporation. The first is the analyst or information<br />
pr<strong>of</strong>essional who works to fulfill the information needs <strong>of</strong> others. The second is<br />
the individual contributor looking for information relevant to his own project.<br />
The third is a manager who needs to make strategic and/or tactical decisions.<br />
The analyst works with information as the main component <strong>of</strong> his job. This<br />
person works on projects specified by clients. The output <strong>of</strong> a given project will<br />
be a report delivered to the client for use in the decision making process. The<br />
analyst is trained in information retrieval techniques, text mining techniques,<br />
etc. and is familiar with the various information sources needed to complete a<br />
given project. He or she has to be able to communicate the results <strong>of</strong> the work<br />
in a form the client can easily use and understand. Taking time to learn new<br />
tools and methodologies is an expected part <strong>of</strong> the job.<br />
<strong>An</strong> <strong>ETD</strong> tool targeted for use by analysts can be quite complex because the<br />
analyst will be given sufficient training to become pr<strong>of</strong>icient in its use. Since the<br />
analyst would be using the tool for multiple projects, she will learn the<br />
Created 7/22/2002 9:39 AM April Kontostathis<br />
Last saved 7/24/2002 4:59 PM This copy printed 8/28/2003 8:44 PM
capabilities and limitations <strong>of</strong> the tool and only apply it where it is appropriate.<br />
One would expect a sophisticated user interface that would allow the analyst to<br />
access the relevant data sources, process the underlying text, and display the<br />
results in a meaningful way using computer graphics visualization techniques.<br />
The visualization scheme used must draw the analyst’s attention to the trend and<br />
then allow the analyst to drill down in the data to find out what development(s)<br />
lead to the trend. The determination <strong>of</strong> whether or not a detected trend is<br />
important is complicated by the fact that the analyst does not always know what<br />
her client would judge to be important. Interaction between the analyst and the<br />
client is critical to make sure the needs <strong>of</strong> the client are met. This is typically an<br />
iterative process as the analyst learns more about what information the client<br />
really needs and the client finds out what information is actually available.<br />
Once the analysis is done, the <strong>ETD</strong> tool should have the ability to export<br />
information to facilitate the report generation process.<br />
The scientist, engineer, or business person wanting to use an <strong>ETD</strong> tool to<br />
obtain project specific information needs a tool that is easy to learn and very<br />
intuitive use. Connecting to the appropriate data sources and the processing <strong>of</strong><br />
the data inside the <strong>ETD</strong> tool must be transparent to the user. This person will<br />
typically have limited training in the tool and will use it only occasionally. He<br />
will not have the time to learn all the nuances <strong>of</strong> using the s<strong>of</strong>tware. The<br />
information that comes out automatically will be what he will use. A simple<br />
graphical user interface with easily interpreted graphical visualizations is<br />
required. This person has the advantage that he is doing the work for himself so<br />
he can make the determination whether a newly detected trend is actually<br />
important or not.<br />
<strong>An</strong> <strong>ETD</strong> tool meant to be used by management personnel must automatically<br />
be connected to the appropriate data sources, have an intuitive user interface, be<br />
very easy to learn, and provide output that is consistent with a format the<br />
manager is comfortable with. Extremely sophisticated visualizations that are<br />
difficult to interpret and require high levels <strong>of</strong> interaction will not be useful in<br />
this environment. In the current corporate culture, managers will not have the<br />
time to take any but the most cursory training in new tools. This means they<br />
will probably not be able to operate the <strong>ETD</strong> tool effectively to do the complete<br />
analysis themselves. They are typically much more comfortable having an<br />
analyst assemble the information and provide a executive summary. The<br />
summarized information and the underlying data could be presented to them<br />
using a browser format that would allow them to look at the high level results<br />
and then drill down into the detail when they find something they are<br />
particularly interested in.<br />
No matter how capable an <strong>ETD</strong> tool becomes, the quality <strong>of</strong> the output will<br />
depend on the quality <strong>of</strong> the input data. Since <strong>ETD</strong> tools are supposed to<br />
identify new developments, the data processed through the tool must be current.<br />
There are several news type services (Dow Jones Interactive, Reuters, etc.) that<br />
supply all types <strong>of</strong> news on a continuous basis. Currently there are not<br />
equivalent services for science and technology types <strong>of</strong> information. One has to<br />
Created 7/22/2002 9:39 AM April Kontostathis<br />
Last saved 7/24/2002 4:59 PM This copy printed 8/28/2003 8:44 PM
search a variety <strong>of</strong> sources to find the required information. The sampling<br />
frequency used to extract the data from the news feed needs to reflect the<br />
rapidity in which things change in the area. Business and financial events<br />
happen much more frequently than changes in technology. One might set up the<br />
<strong>ETD</strong> tool to collect data each day and then process it looking for new trends.<br />
Since developments in science and technology happen at a slower pace, it might<br />
be appropriate to work in blocks <strong>of</strong> one week or one month. Processing<br />
information in one year blocks may be ok for a retrospective look at what has<br />
happened, but is not acceptable for most decision making situations.<br />
<strong>ETD</strong> systems will have to be personalized to meet the needs <strong>of</strong> specific<br />
clients. The <strong>ETD</strong> algorithms will eventually become quite good at determining<br />
that something has happened. However, whether or not the development is<br />
significant depends on the needs <strong>of</strong> the person looking at the data. Broadly<br />
speaking, there are two types <strong>of</strong> client pr<strong>of</strong>ile information that must be obtained.<br />
The first is the definition <strong>of</strong> the area <strong>of</strong> interest and the second is the definition<br />
<strong>of</strong> what characterizes an important event in the area. Traditional alerting<br />
systems handled the first problem by setting up a user pr<strong>of</strong>ile containing a<br />
search query that was run on a periodic basis against specified data sources.<br />
Typically, the query was built on a trial and error basis by the information<br />
pr<strong>of</strong>essional and the client. This was an iterative process. Some <strong>of</strong> the newer<br />
knowledge management systems use document training sets to build the<br />
“query”. Which approach will work best with a given <strong>ETD</strong> tool remains to be<br />
seen. Either process can take a significant amount <strong>of</strong> time for the client who<br />
wants the information. There is also the problem that the client’s areas <strong>of</strong><br />
interest will expand and change over time. Each time this happens, a new<br />
pr<strong>of</strong>ile will have to be generated.<br />
The problem <strong>of</strong> determining what is a significant event for a given user is<br />
handled in interactive systems by letting the decision maker work directly with<br />
the tool. If the decision maker is unwilling to work directly with the tool, then<br />
an analyst will have to interview the decision maker and get basic guidelines to<br />
work with. He can then do the analysis and give the decision maker a list <strong>of</strong><br />
potentially significant events from which to choose from. It would be best if<br />
these suggested developments where presented in a browser format that would<br />
allow the decision maker to drill down into the detail underlying any<br />
development he found to be <strong>of</strong> interest.<br />
It is too early to tell what the cost <strong>of</strong> an <strong>ETD</strong> s<strong>of</strong>tware system will be. If it<br />
turns out to be in the same class as the knowledge management and text<br />
database mining s<strong>of</strong>tware <strong>of</strong> today, it will cost ten’s to hundred’s <strong>of</strong> dollars.<br />
Assuming it will be a s<strong>of</strong>tware product, it probably will carry the same sort <strong>of</strong><br />
structure as the high end s<strong>of</strong>tware packages available today. The vendors charge<br />
an initial purchase cost and then require an annual maintenance fee to provide<br />
technical support and updates <strong>of</strong> the s<strong>of</strong>tware. Sometimes it is possible to buy<br />
the s<strong>of</strong>tware by the seat, but <strong>of</strong>ten the vendors push to sell a corporate license. If<br />
only a few people will be using the s<strong>of</strong>tware, then purchasing seats makes sense.<br />
If the s<strong>of</strong>tware is actually going to be used across the enterprise, then a corporate<br />
Created 7/22/2002 9:39 AM April Kontostathis<br />
Last saved 7/24/2002 4:59 PM This copy printed 8/28/2003 8:44 PM
license is probably the better choice. <strong>An</strong>other cost that is <strong>of</strong>ten overlooked is the<br />
impact on the corporate IT infrastructure. Even when the application is run on<br />
existing in-house servers, there is usually the need to have a system<br />
administrator and possibly a database administrator available to keep the<br />
application up and running.<br />
Sometimes it is useful to develop a perfect world scenario to better<br />
understand what needs to be done in an evolving application area. Table 15<br />
shows the characteristics <strong>of</strong> what I think would be the perfect world information<br />
system would be for a busy executive who is involved in decision making<br />
processes. My assumptions are that <strong>ETD</strong> tools would be part <strong>of</strong> this system and<br />
that system I specify would also meet the needs <strong>of</strong> an analyst or individual<br />
contributor.<br />
• Raw data processed into useful information<br />
• Sufficient information presented to meet current need<br />
• No irrelevant information prevented<br />
• All information available immediately when needed<br />
• Information prioritized for the current need<br />
• Information presented in a format that is intuitively easy to<br />
understand<br />
• Information can be viewed at different levels <strong>of</strong> detail<br />
• Information can be viewed from multiple perspectives<br />
Table 15: Perfect World Executive Information System<br />
The perfect world scenario can be summarized to say that the decision maker<br />
wants to see the unique information he should see, not see any irrelevant or<br />
redundant information, and have the information in a form that is easy to<br />
understand and interpret. <strong>ETD</strong> tools need to fit in to this scenario if they are<br />
really going to get used at high levels <strong>of</strong> a corporation.<br />
There continues to be good progress made in knowledge management and<br />
text mining tools. Since any <strong>ETD</strong> system will make use <strong>of</strong> these types <strong>of</strong> tools, I<br />
think there is a good possibility the practical <strong>ETD</strong> systems will eventually<br />
become available for fixed information needs. Building a system that will keep<br />
up with a given decision maker’s changing information needs will be difficult,<br />
unless a good way is found to automatically translate the subject areas <strong>of</strong> interest<br />
and the important developments criteria from the words <strong>of</strong> the user to the <strong>ETD</strong><br />
system. There will always be a challenge to make sure that data sources<br />
available are adequate to support the needs <strong>of</strong> the decision maker.<br />
In this section I have reviewed some to the practical aspects <strong>of</strong> working with<br />
an <strong>ETD</strong> tool in a corporate environment. The real test for an <strong>ETD</strong> system is<br />
whether or not it provides useful information about new developments to the<br />
decision maker in a timely manner. The current systems do not seem to provide<br />
Created 7/22/2002 9:39 AM April Kontostathis<br />
Last saved 7/24/2002 4:59 PM This copy printed 8/28/2003 8:44 PM
the required level <strong>of</strong> performance to be used extensively in the corporate<br />
environment. There is hope that new generations <strong>of</strong> <strong>ETD</strong> tools will be useful to<br />
corporate decision makers.<br />
6. ACKNOWLEDGMENTS<br />
7. REFERENCES<br />
1. R. Agrawal, R. Srikant: "Mining Sequential Patterns", Proc. <strong>of</strong> the Int'l Conference<br />
on Data Engineering (ICDE), Taipei, Taiwan, March 1995.<br />
2. R. Agrawal, G. Psaila, E. L. Wimmers, M. Zait: "Querying Shapes <strong>of</strong> Histories",<br />
Proc. <strong>of</strong> the 21st Int'l Conference on Very Large Databases, Zurich, Switzerland,<br />
September 1995.<br />
3. J. Allan, L. Ballesteros, J. Callan, W. Cr<strong>of</strong>t, and Z. Lu. Recent experiments with<br />
inquery. In The Fourth Text Retrieval Conference (TREC-4), pages 49–63, 1995.<br />
4. J. Allan, R. Papka, V. Lavrenko, "On-line New Event <strong>Detection</strong> and<br />
Tracking," Proceedings <strong>of</strong> ACM SIGIR, pp.37-45, 1998.<br />
5. Applied Semantics: http://www.appliedsemantics.com/ June, 2002.<br />
6. Autonomy: http://www.autonomy.com/ June, 2002.<br />
7. Bader, R., M., Callahan, D. Grim, J. Krause, N. Miller and W. M. Pottenger. The<br />
Role <strong>of</strong> the HDDI Collection Builder in Hierarchical Distributed Dynamic<br />
Indexing. Proceedings <strong>of</strong> the Textmine '01 Workshop, First SIAM International<br />
Conference on Data Mining. April 2001.<br />
8. Banter: http://www.banter.com/ June, 2002.<br />
9. D. Bikel, S. Miller, R. Schwartz, and R. Weischedel. Nymble: a high-performance<br />
learning name-finder. In Fifth Conference on Applied Natural Language<br />
Processing, pages 194–201. ACL, 1997.<br />
10. G. D. Blank, William M. Pottenger, G. D. Kessler, M. Herr, H. Jaffe, S. Roy, D.<br />
Gevry, Q. Wang. CIMEL: Constructive, collaborative Inquiry-based<br />
Multimedia E-Learning. The 6th <strong>An</strong>nual Conference on Innovation and<br />
Technology in Computer Science Education (ITiCSE), June 2001.<br />
11. Fabien Bouskila, William M. Pottenger. The Role <strong>of</strong> Semantic Locality in<br />
Hierarchical Distributed Dynamic Indexing. In Proceedings <strong>of</strong> the 2000<br />
International Conference on Artificial Intelligence (IC-AI 2000), Las Vegas,<br />
Nevada, June, 2000.<br />
12. Captiva: http://www.captivacorp.com/ June, 2002.<br />
13. Chaomei Chen, Les Carr: A Semantic-Centric Approach to Information<br />
Visualization. IV 1999: 18-23<br />
14. Chaomei Chen, Ray J. Paul: Visualizing a Knowledge Domain's Intellectual<br />
Structure. IEEE Computer 34(2): 65-71 (2001)<br />
15. H. Chen and K.J. Lynch, Automatic Construction <strong>of</strong> Networks <strong>of</strong> Concepts<br />
Characterizing Document Databases, IEEE Transaction on Systems, Man and<br />
Cybernetics, vol. 22, pp. 885-902, 1992.<br />
16. ClearForest: http://www.clearforest.com/ June, 2002.<br />
Created 7/22/2002 9:39 AM April Kontostathis<br />
Last saved 7/24/2002 4:59 PM This copy printed 8/28/2003 8:44 PM
17. Clementine: http://www.spss.com/spssbi/clementine/ June, 2002.<br />
18. compendex: http://edina.ac.uk/compendex/ June, 2002.<br />
19. Davidson, G. S., Hendrickson, B., Johnson, D. K., Meyers, C. E., & Wylie, B. N.<br />
Knowledge mining with VxInsight: Discovery through interaction. Journal <strong>of</strong><br />
Intelligent Information Systems, 11(3), 259-285.<br />
20. Delphion: http://www.delphion.com/<br />
21. E. Edgington. Randomization Tests. Marcel Dekker, New York, NY, 1995.<br />
22. Factiva: http://www.factiva.com/ June, 2002.<br />
23. Facts on File, 1996, Facts on File, New York, 1997.<br />
24. Ronen Feldman and Ido Dagan. Knowledge discovery in textual databases (kdt). In<br />
Proceedings <strong>of</strong> the First International Conference on Knowledge Discovery (KDD-<br />
95). ACM, August 1995.<br />
25. D. Fisher, S. Soderland, J. McCarthy, F. Feng, and W. Lehnert. Description <strong>of</strong> the<br />
umass systems as used for muc-6. In Proceedings <strong>of</strong> the 6 th Message Understanding<br />
Conference, November, 1995, pages 127–140, 1996.<br />
26. Gartnerg2: http://www.gartnerg2.com/site/default.asp June, 2002.<br />
27. D. Gevry, <strong>Detection</strong> <strong>of</strong> <strong>Emerging</strong> <strong>Trend</strong>s: Automation <strong>of</strong> Domain Expert Practices.<br />
M.S. Thesis, Department <strong>of</strong> Computer Science and Engineering at Lehigh<br />
University, 2002.<br />
28. Havre, Susan, Elizabeth G. Hetzler, Lucy T. Nowell: ThemeRiver: Visualizing<br />
Theme Changes over Time. INFOVIS 2000: 115-124<br />
29. S. Havre, E. Hetzler, P. Whitney, and L. Nowell. ThemeRiver: Visualizing Thematic<br />
Changes in Large Document Collections, IEEE Transactions on Visualization and<br />
Computer Graphics, vol. 8, no. 1, Jan-Mar, 2002.<br />
30. HyBrix : http://www.siemens.com/index.jsp June, 2002.<br />
31. IDC: http://www.idc.com June, 2002.<br />
32. Inspec: http://www.iee.org.uk/Publish/INSPEC/ June, 2002.<br />
33. Interwoven: http://www.interwoven.com/products/ June, 2002.<br />
34. Invention Machine: http://www.invention-machine.com/index.htm June, 2002.<br />
35. Yumi Jin’s thesis<br />
36. V. Lavrenko, M. Schmill, D. Lawrie, P. Ogilvie, D. Jensen, J. Allan,<br />
"Mining <strong>of</strong> Concurrent Text and Time-Series," KDD-<br />
http://citeseer.nj.nec.com/378125.html<br />
37. LDC: http://www.ldc.upenn.edu/ June, 2002.<br />
38. Lent, B.; Agrawal, R.; and Srikant, R. 1997. Discovering <strong>Trend</strong>s in Text<br />
Databases, Proc. 3 rd Int Conf. On Knowledge Discovery and Data Mining,<br />
California.<br />
39. <strong>An</strong>ton Leuski, James Allan: Strategy-based interactive cluster visualization for<br />
information retrieval. Int. J. on Digital Libraries 3(2): 170-184 (2000)<br />
40. A. Leuski and J. Allan. Lighthouse: Showing the way to relevant information. In<br />
Proceedings <strong>of</strong> the IEEE Symposium on Information Visualization (InfoVis), pages<br />
125–130, 2000.<br />
41. lexiquest: http://www.spss.com/spssbi/lexiquest/ June, 2002.<br />
42. LexisNexis: http://www.lexisnexis.com/ June, 2002.<br />
43. Loet Leydesdorff Indicators <strong>of</strong> Structural Change in the Dynamics <strong>of</strong><br />
Science: Entropy Statistics <strong>of</strong> the SCI Journal Citation Reports,<br />
Scientometrics 53(1), 131-159<br />
Created 7/22/2002 9:39 AM April Kontostathis<br />
Last saved 7/24/2002 4:59 PM This copy printed 8/28/2003 8:44 PM
44. A. Martin, T. K. G. Doddington, M. Ordowski, and M. Przybocki. The DET curve<br />
in assessment <strong>of</strong> detection task performance. In Proceedings <strong>of</strong> EuroSpeech’97,<br />
volume 4, pages 1895–1898, 1997.<br />
45. Moreover: http://www.moreover.com/ June, 2002.<br />
46. Northern Light: http://www.northernlight.com/ June, 2002.<br />
47. L. T Nowell, R. K France, D. Hix, L. S Heath and E. A Fox. Visualizing Search<br />
Results: Some Alternatives to Query-Document Similarity. In Proceedings <strong>of</strong><br />
SIGIR’96, Zurich, 1996<br />
48. C. Plaisant, R. Mushlin, A. Snyder, J. Li, D. Heller, and B. Shneiderman.<br />
Lifelines: Using visualization to enhance navigation and analysis <strong>of</strong> patient<br />
records. In Proceedings <strong>of</strong> the 1998 American Medical Informatic<br />
Association <strong>An</strong>nual Fall Symposium, pages 76-80, 1998.<br />
49. A. Popescul, G. W. Flake, S. Lawrence, L. Ungar, and C. L. Giles. Clustering and<br />
identifying temporal trends in document databases. In Proc. IEEE Advances in<br />
Digital Libraries 2000, 2000.<br />
50. Porter, A.L., and Detampel, M.J., "Technology Opportunities <strong>An</strong>alysis,"<br />
Technological Forecasting and Social Change, Vol. 49, p. 237-255, 1995.<br />
51. Allan L. Porter and Donghua Jhu. Technological Mapping for management <strong>of</strong><br />
technology. Presented at International Symposium on Technology 2001.<br />
www.tpac.gatech.edu/~donghua/nanotechnology/isf2001_dhz_alp_06_14.ppt<br />
52. W. M. Pottenger. Theory, Techniques, and Experiments in Solving Recurrences in<br />
Computer Programs, Ph.D. thesis, University <strong>of</strong> Illinois at Urbana-Champaign,<br />
Center for Supercomputing Res. & Dev, 1997.<br />
53. Pottenger, William M. and Ting-hao Yang. Detecting <strong>Emerging</strong> Concepts in Textual<br />
Data Mining. In Computational Information Retrieval, Michael Berry, Ed., SIAM,<br />
Philadelphia, PA, August 2001.<br />
54. Pottenger, William M., Yong-Bin Kim and Daryl D. Meling. HDDI: Hierarchical<br />
Distributed Dynamic Indexing. In Data Mining for Scientific and Engineering<br />
Applications, Robert Grossman, Chandrika Kamath, Vipin Kumar and Raju<br />
Namburu, Eds., Kluwer Academic Publishers, July 2001.<br />
55. Quiver: http://www.quiver.com/ June, 2002.<br />
56. S. Roy. A Multimedia Interface for <strong>Emerging</strong> <strong>Trend</strong> <strong>Detection</strong> in Inquiry-based<br />
Learning. M.S. Thesis, Department <strong>of</strong> Computer Science and Engineering at<br />
Lehigh University, 2002.<br />
57. Soma Roy, David Gevry, William Pottenger. Methodologies for <strong>Trend</strong> <strong>Detection</strong> in<br />
Textual Data Mining. Proceedings <strong>of</strong> the Textmine '02 Workshop, Second SIAM<br />
International Conference on Data Mining. April, 2002.<br />
58. Semio: http://www.semio.com/ June, 2002.<br />
59. Ser Solutions: http://www.sersolutions.com/ June, 2002.<br />
60. SPSS: http://www.spss.com/PDFs/LQMBRO-0302.pdf June, 2002.<br />
61. Srikant, R., & Agrawal, R. (1996). Mining sequential patterns:<br />
Generalizations and performance improvements, . Proc. <strong>of</strong> the Fifth Int'l<br />
Conference on Extending Database Technology (EDBT). Avignon, France.<br />
62. Stratify: http://www.stratify.com/ June, 2002.<br />
63. R. Swan and J. Allan. Automatic generation <strong>of</strong> <strong>overview</strong> timelines. In Proceedings<br />
<strong>of</strong> the 23rd <strong>An</strong>nual International ACM SIGIR Conference on Research and<br />
Development in Information Retrieval (these proceedings), Athens, Greece, 2000.<br />
Association for Computing Machinery.<br />
Created 7/22/2002 9:39 AM April Kontostathis<br />
Last saved 7/24/2002 4:59 PM This copy printed 8/28/2003 8:44 PM
64. Russel Swan and David Jensen. TimeMines: Constructing Timelines with<br />
Statistical Models <strong>of</strong> Word Usage. In the Sixth ACM SIGKDD International<br />
Conference on Knowledge Discovery and Data Mining, 2000.<br />
65. Tacit: http://www.tacit.com/ June, 2002.<br />
66. R. E. Tarjan, Depth first search and linear graph algorithms, SIAM Journal <strong>of</strong><br />
Computing, 1:146–160, 1972.<br />
67. TDT: http://www.nist.gov/speech/tests/tdt/index.htm. June, 2002.<br />
68. text<strong>An</strong>alyst: http://www.megaputer.com/products/ta/index.php3<br />
69. ThoughtShare: http://www.thoughtshare.com/. June, 2002.<br />
70. UIUC: “UIUC Digital Library Initiative”, http://dli.grainger.uiuc.edu/.<br />
71. USPTO: http://www.uspto.gov/main/patents.htm. June, 2002.<br />
72. Verity: http://www.verity.com/. June, 2002<br />
73. Pak Chung Wong, Wendy Cowley, Harlan Foote, Elizabeth Jurus, Jim Thomas.<br />
Visualizing Sequential Patterns for Text Mining. Pacific Northwest National<br />
Laboratory. In Proceedings <strong>of</strong> IEEE Information Visualization 2000, October 2000.<br />
74. Jinxi Xu, J. Broglio, and W. B. Cr<strong>of</strong>t. The design and implementation <strong>of</strong> a part <strong>of</strong><br />
speech tagger for English. Technical Report IR-52, Center for Intelligent<br />
Information Retrieval, University <strong>of</strong> Massachusetts, Amherst, 1994.<br />
75. T. Yang. Detecting <strong>Emerging</strong> Conceptual Contexts in Textual Collections. M.S.<br />
Thesis, Department <strong>of</strong> Computer Science at the University <strong>of</strong> Illinois at Urbana-<br />
Champaign, 2000.<br />
76. Yiming Yang, Tom Pierce and Jaime Carbonell. A study on Retrospective and On-<br />
Line Event <strong>Detection</strong>. Proceedings <strong>of</strong> SIGIR-98, 21st ACM International<br />
Conference on Research and Development in Information Retrieval.<br />
Created 7/22/2002 9:39 AM April Kontostathis<br />
Last saved 7/24/2002 4:59 PM This copy printed 8/28/2003 8:44 PM