Annual Report 2011 / 2012 - E21 - Technische Universität München
Annual Report 2011 / 2012 - E21 - Technische Universität München
Annual Report 2011 / 2012 - E21 - Technische Universität München

Create successful ePaper yourself
Turn your PDF publications into a flip-book with our unique Google optimized e-Paper software.
Chapter 1. Magnetism and Superconductivity 7<br />
Magnetic Phase Diagram of MnSi Inferred from Magnetization and ac<br />
Susceptibility<br />
Andreas Bauer 1 , Christian Pfleiderer 1<br />
1 Physik-Department <strong>E21</strong>, <strong>Technische</strong> Universität München, D-85748 Garching, Germany.<br />
We report simultaneous measurements of the magnetization<br />
and the ac susceptibility across the magnetic phase<br />
diagram of single-crystal MnSi.[1] In our study we explore<br />
the importance of the excitation frequency, excitation amplitude,<br />
sample shape, and crystallographic orientation, see<br />
Fig. 1 and Fig. 2.<br />
a<br />
µ 0<br />
dM / dB, Re χ ac<br />
0.6<br />
0.4<br />
0.08<br />
0.04<br />
MnSi, Sample 1, B || <br />
B ac<br />
= 0.1 mT<br />
(1)<br />
(3)<br />
(2)(4) (7)<br />
(5) (6)<br />
(5)<br />
(7)<br />
(4)<br />
(1)<br />
(2)(3)<br />
(6)<br />
0.2<br />
b B ac<br />
= 0.1 mT<br />
0.12<br />
Im χ ac<br />
µ 0<br />
dM / dB<br />
27.5 K<br />
26.5 K<br />
10 Hz<br />
91 Hz<br />
911 Hz<br />
(8)<br />
(3)<br />
(1) (4) (5) (2) (6) (7) (8)<br />
27.5 K<br />
(1)<br />
(2) (3) (4) (5)(6) (7)<br />
26.5 K<br />
0.00<br />
0.0 0 0.1 0.2 0.3<br />
B (T)<br />
0.4<br />
(8)<br />
10 Hz<br />
91 Hz<br />
911 Hz<br />
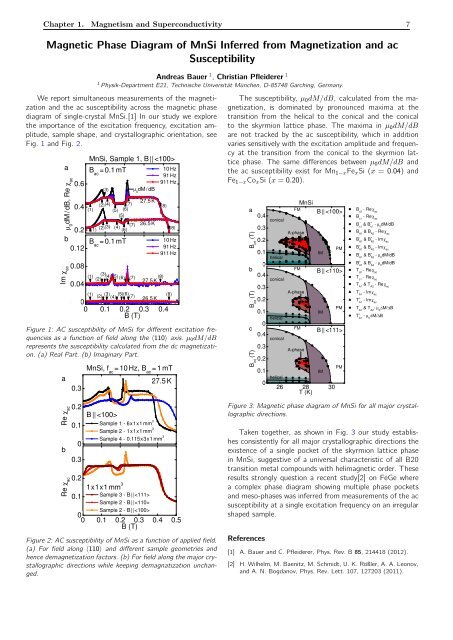
Figure 1: AC susceptibility of MnSi for different excitation frequencies<br />
as a function of field along the 〈110〉 axis. µ 0dM/dB<br />
represents the susceptibility calculated from the dc magnetization.<br />
(a) Real Part. (b) Imaginary Part.<br />
a<br />
Re χ ac<br />
b<br />
Re χ ac<br />
0.3<br />
0.2<br />
0.1<br />
0.00<br />
0.3<br />
0.2<br />
0.1<br />
1 x 1 x 1 mm 3<br />
Sample 3 - B || <br />
Sample 2 - B || <br />
Sample 2 - B || <br />
(8)<br />
MnSi, f ac<br />
= 10 Hz, B ac<br />
= 1 mT<br />
27.5 K<br />
B || <br />
Sample 1 - 6 x 1 x 1 mm 3<br />
Sample 2 - 1 x 1 x 1 mm 3<br />
Sample 4 - 0.115 x 3 x 1 mm 3<br />
0.00<br />
0.0 0 0.1 0.2 0.3 0.4 0.5<br />
B (T)<br />
Figure 2: AC susceptibility of MnSi as a function of applied field.<br />
(a) For field along 〈110〉 and different sample geometries and<br />
hence demagnetization factors. (b) For field along the major crystallographic<br />
directions while keeping demagnatization unchanged.<br />
The susceptibility, µ 0 dM/dB, calculated from the magnetization,<br />
is dominated by pronounced maxima at the<br />
transition from the helical to the conical and the conical<br />
to the skyrmion lattice phase. The maxima in µ 0 dM/dB<br />
are not tracked by the ac susceptibility, which in addition<br />
varies sensitively with the excitation amplitude and frequency<br />
at the transition from the conical to the skyrmion lattice<br />
phase. The same differences between µ 0 dM/dB and<br />
the ac susceptibility exist for Mn 1−x Fe x Si (x = 0.04) and<br />
Fe 1−x Co x Si (x = 0.20).<br />
a<br />
B int<br />
(T)<br />
b<br />
B int<br />
(T)<br />
c<br />
B int<br />
(T)<br />
0.4<br />
0.3<br />
0.2<br />
0.1<br />
0.0<br />
0.4<br />
0.3<br />
0.2<br />
0.1<br />
0.0<br />
0.4<br />
0.3<br />
0.2<br />
0.1<br />
0.0<br />
conical<br />
helical<br />
conical<br />
helical<br />
conical<br />
helical<br />
FM<br />
A-phase<br />
FM<br />
A-phase<br />
FM<br />
A-phase<br />
MnSi<br />
B || <br />
IM<br />
B || <br />
IM<br />
B || <br />
IM<br />
26 28 30<br />
T (K)<br />
PM<br />
PM<br />
PM<br />
B c2<br />
- Re χ ac<br />
B c1<br />
- Re χ ac<br />
B -<br />
c1 & B+ c1 - µ 0 dM/dB<br />
B A1<br />
& B A2<br />
- Re χ ac<br />
B Ā1 & B+ A2 - Im χ ac<br />
B + A1 & BĀ2 - Im χ ac<br />
B Ā1 & B+ A2 - µ 0 dM/dB<br />
B + A1 & BĀ2 - µ 0 dM/dB<br />
T c2<br />
- Re χ ac<br />
T c1<br />
- Re χ ac<br />
T A1<br />
& T A2<br />
- Re χ ac<br />
T Ā1 - Im χ ac<br />
T + A1 - Im χ ac<br />
T Ā1 & T A2 - µ 0 ∆M/∆B<br />
T + A1 - µ 0 ∆M/∆B<br />
Figure 3: Magnetic phase diagram of MnSi for all major crystallographic<br />
directions.<br />
Taken together, as shown in Fig. 3 our study establishes<br />
consistently for all major crystallographic directions the<br />
existence of a single pocket of the skyrmion lattice phase<br />
in MnSi, suggestive of a universal characteristic of all B20<br />
transition metal compounds with helimagnetic order. These<br />
results strongly question a recent study[2] on FeGe where<br />
a complex phase diagram showing multiple phase pockets<br />
and meso-phases was inferred from measurements of the ac<br />
susceptibility at a single excitation frequency on an irregular<br />
shaped sample.<br />
References<br />
[1] A. Bauer and C. Pfleiderer, Phys. Rev. B 85, 214418 (<strong>2012</strong>).<br />
[2] H. Wilhelm, M. Baenitz, M. Schmidt, U. K. Rößler, A. A. Leonov,<br />
and A. N. Bogdanov, Phys. Rev. Lett. 107, 127203 (<strong>2011</strong>).