Annual Report 2007 - Investing In Africa
Annual Report 2007 - Investing In Africa
Annual Report 2007 - Investing In Africa

Create successful ePaper yourself
Turn your PDF publications into a flip-book with our unique Google optimized e-Paper software.
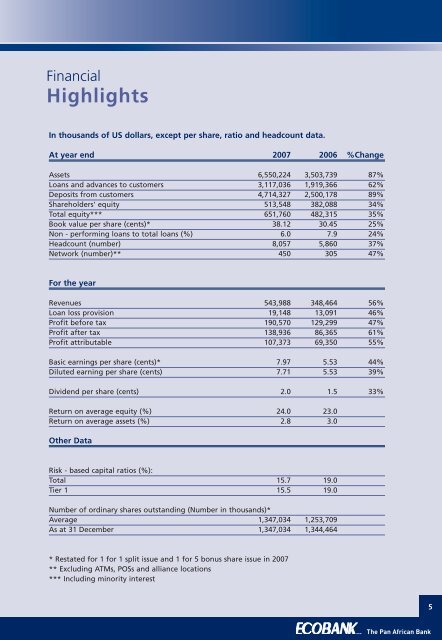
Financial<br />
Highlights<br />
<strong>In</strong> thousands of US dollars, except per share, ratio and headcount data.<br />
At year end <strong>2007</strong> 2006 %Change<br />
Assets 6,550,224 3,503,739 87%<br />
Loans and advances to customers 3,117,036 1,919,366 62%<br />
Deposits from customers 4,714,327 2,500,178 89%<br />
Shareholders' equity 513,548 382,088 34%<br />
Total equity*** 651,760 482,315 35%<br />
Book value per share (cents)* 38.12 30.45 25%<br />
Non - performing loans to total loans (%) 6.0 7.9 24%<br />
Headcount (number) 8,057 5,860 37%<br />
Network (number)** 450 305 47%<br />
For the year<br />
Revenues 543,988 348,464 56%<br />
Loan loss provision 19,148 13,091 46%<br />
Profit before tax 190,570 129,299 47%<br />
Profit after tax 138,936 86,365 61%<br />
Profit attributable 107,373 69,350 55%<br />
Basic earnings per share (cents)* 7.97 5.53 44%<br />
Diluted earning per share (cents) 7.71 5.53 39%<br />
Dividend per share (cents) 2.0 1.5 33%<br />
Return on average equity (%) 24.0 23.0<br />
Return on average assets (%) 2.8 3.0<br />
Other Data<br />
Risk - based capital ratios (%):<br />
Total 15.7 19.0<br />
Tier 1 15.5 19.0<br />
Number of ordinary shares outstanding (Number in thousands)*<br />
Average 1,347,034 1,253,709<br />
As at 31 December 1,347,034 1,344,464<br />
* Restated for 1 for 1 split issue and 1 for 5 bonus share issue in <strong>2007</strong><br />
** Excluding ATMs, POSs and alliance locations<br />
*** <strong>In</strong>cluding minority interest<br />
5<br />
... The Pan <strong>Africa</strong>n Bank