ENVIRONMENTAL - International Erosion Control Association
ENVIRONMENTAL - International Erosion Control Association
ENVIRONMENTAL - International Erosion Control Association

You also want an ePaper? Increase the reach of your titles
YUMPU automatically turns print PDFs into web optimized ePapers that Google loves.
(RECP); or left untreated (bare slopes<br />
were allowed to vegetate naturally).<br />
The sediment losses from the side<br />
slope portion of the project were measured<br />
over all eight years of the project.<br />
The input fi les for the WEPP model included<br />
slope, climate, soil, and management<br />
for each treatment on both types<br />
of slopes.<br />
Sediment losses the fi rst year after<br />
establishment of both the native and<br />
exotic vegetation represented from 60<br />
to 90 percent of the total losses from<br />
the cut and the fi ll slopes over the eight<br />
years. On cut slopes, 81 percent of total<br />
sediment losses occurred during the<br />
fi rst year of stand establishment. By<br />
contrast, just 38 percent of total sediment<br />
loss from fi ll slopes was observed<br />
during the fi rst year.<br />
These results reflect different soil<br />
conditions between the two types of<br />
slopes, Grace explains. Because they<br />
represent a mixture of topsoil and subsurface<br />
soil, fi ll slopes tend to have a<br />
looser texture. This improves infi ltration<br />
of water, reducing runoff volume,<br />
and makes it easier for vegetation to<br />
establish compared to cut slopes, where<br />
most, if not all, of the looser texture<br />
topsoil has been removed.<br />
“In this study, the fi ll slopes exhibited<br />
100 percent cover of vegetation after<br />
two years,” he says. “It took more than<br />
a year longer to achieve a 90 percent to<br />
100 percent vegetative cover on the cut<br />
slopes.”<br />
Sediment losses from the control<br />
plots on both the cut and the fi ll slopes<br />
continued at a high rate until the fourth<br />
year after disturbance.<br />
Differences in Efficiency<br />
WEPP predictions of sediment<br />
losses over the eight years for the native<br />
and RECP treatments agreed with the<br />
actual measured losses on both cut and<br />
fi ll slopes, Grace reports.<br />
“The model was most efficient in predicting<br />
soil loss from the native treatment<br />
on both types of slopes and it was<br />
high for the RECP treatments on the<br />
cut and fi ll slopes, too,” he says. “It was<br />
least efficient in predicting sediment<br />
losses from the cut and the fi ll slopes<br />
with both the exotic treatment and the<br />
control,” he says. “This reflects the inability<br />
to characterize the vegetation<br />
mixture in the WEPP management fi le<br />
for the erosion control treatments.<br />
“It’s also significant that the native<br />
vegetation was as effective as the exotic<br />
in controlling erosion of the side slopes<br />
over the eight-year period,” Grace adds.<br />
“For the fi rst two years, sediment losses<br />
from the RECP were less than the other<br />
treatments. However, as time went on,<br />
sediment losses from vegetation treatments<br />
decreased and there was no statistical<br />
difference between them.”<br />
Road Surface Results<br />
The crowned unsurfaced roads<br />
consisted of native sandy loam soil<br />
overlaying a clay loam subsoil. The<br />
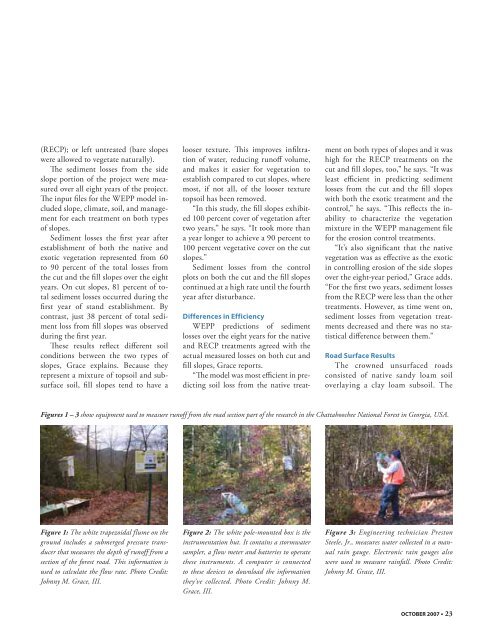
Figures 1 – 3 show equipment used to measure runoff from the road section part of the research in the Chattahoochee National Forest in Georgia, USA.<br />
Figure 1: The white trapezoidal flume on the<br />
ground includes a submerged pressure transducer<br />
that measures the depth of runoff from a<br />
section of the forest road. This information is<br />
used to calculate the flow rate. Photo Credit:<br />
Johnny M. Grace, III.<br />
Figure 2: The white pole-mounted box is the<br />
instrumentation hut. It contains a stormwater<br />
sampler, a flow meter and batteries to operate<br />
these instruments. A computer is connected<br />
to these devices to download the information<br />
they’ve collected. Photo Credit: Johnny M.<br />
Grace, III.<br />
Figure 3: Engineering technician Preston<br />
Steele, Jr., measures water collected in a manual<br />
rain gauge. Electronic rain gauges also<br />
were used to measure rainfall. Photo Credit:<br />
Johnny M. Grace, III.<br />
OCTOBER 2007 • 23