Development of UV Spectrophotometric method of Idebenone in ...
Development of UV Spectrophotometric method of Idebenone in ...
Development of UV Spectrophotometric method of Idebenone in ...

Create successful ePaper yourself
Turn your PDF publications into a flip-book with our unique Google optimized e-Paper software.
Asian J. Research Chem. 2(2): April.-June, 2009<br />
,<br />
Preparation <strong>of</strong> sample solution:<br />
The proposed <strong>method</strong> was applied to analyse commercially<br />
available <strong>Idebenone</strong> tablet. Ten tablets were weighed and<br />
powdered. The amount <strong>of</strong> tablet powder equivalent to 10<br />
mg <strong>of</strong> <strong>Idebenone</strong> was weighed accurately and transfer to<br />
100ml volumetric flask then 20 ml absolute ethanol was<br />
added and kept for 15 m<strong>in</strong> with frequent shak<strong>in</strong>g and<br />
volume was made up to mark with phosphate buffer pH<br />
6.8.The solution was then filtered through Whattman filter<br />
paper #41.This filtrate was diluted suitably with solvent<br />
(20% v/v absolute ethanol <strong>in</strong> phosphate buffer pH 6.8) to<br />
get the solution <strong>of</strong> 12µg/ml concentration .The absorbance<br />
was measured aga<strong>in</strong>st solution blank.<br />
Table No.1 - Calibration Curve parameter<br />
Sr.<br />
No.<br />
Concentration<br />
(µg/ml)<br />
Absorbance<br />
(average)<br />
Standard<br />
deviation<br />
1 0 0 0<br />
2 2 0.0713 ±0.005859<br />
3 4 0.1552 ±0.001724<br />
4 6 0.2552 ±0.0009<br />
5 8 0.3629 ±0.001206<br />
6 10 0.4766 ±0.014856<br />
7 12 0.5577 0<br />
8 14 0.6332 ±0.010201<br />
9 16 0.7384 ±0.006341<br />
10 18 0.8584 ±0.009174<br />
11 20 0.9651 ±0.007279<br />
Table.2 - Validation parameters<br />
Sr. No. Parameter<br />
Result<br />
1. Absorption maxima(nm) 282<br />
2. L<strong>in</strong>earity Range (µg/ml) 4-20<br />
3 Standard Regression y = 0.0485x - 0.0239<br />
Equation<br />
4 Correlation Coefficient (r2 ) r 2 = 0. 9978<br />
5 Molar absorptivity 14818.71<br />
6 A( 1% , 1cm ) 443.088<br />
7 Accuracy (% recovery ±SD) 99.74 % ± 0.07211<br />
8 Precision (% CV) 99.67 %, 99.68 %<br />
9 Specificity A 12 µg/ml solution<br />
<strong>of</strong> candidate drug <strong>in</strong><br />
solvent (20%v/v<br />
ethanol <strong>in</strong> 6.8-pH<br />
phosphate buffer) at<br />
<strong>UV</strong> detection λ <strong>of</strong><br />
282 nm will show an<br />
absorbance value <strong>of</strong><br />
0.5777<br />
10 Sandell’s Sensitivity 8 0.022735<br />
(µg/cm 2 /0.001 absorbance<br />
unit)<br />
11 LOD (µg/ml) 1.6261<br />
12 LOQ (µg/ml) 4.9278<br />
The drug content <strong>of</strong> the preparation was calculated us<strong>in</strong>g<br />
standard calibration curve. Amount <strong>of</strong> drug estimated by<br />
this <strong>method</strong> is given <strong>in</strong> (Table No.3).<br />
RESULT AND DISCUSSION:<br />
Precision:<br />
Assay <strong>of</strong> <strong>method</strong> precision (<strong>in</strong>tra-day precision) was<br />
evaluated by carry<strong>in</strong>g out six <strong>in</strong>dependent assays <strong>of</strong> test<br />
samples <strong>of</strong> <strong>Idebenone</strong>. The <strong>in</strong>termediate precision (<strong>in</strong>terday<br />
precision) <strong>of</strong> the <strong>method</strong> was also evaluated us<strong>in</strong>g<br />
two different analysts, systems and different days <strong>in</strong> the<br />
same laboratory. The relative standard deviation (RSD)<br />
and assay values obta<strong>in</strong>ed by two analysts were 0.28,<br />
99.67 and 0.26, 99.68 respectively (Table no.4).<br />
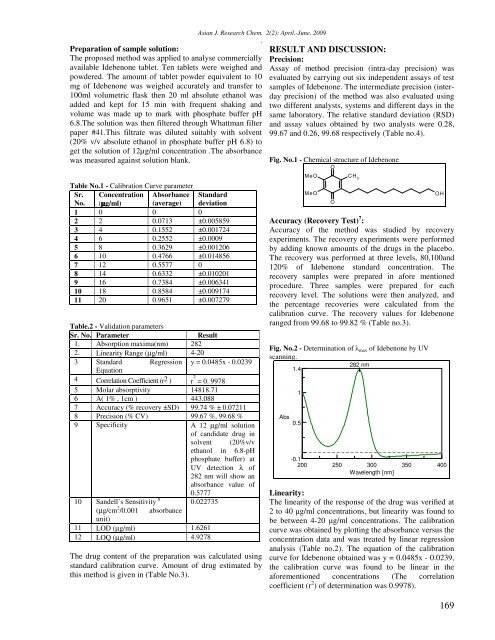
Fig. No.1 - Chemical structure <strong>of</strong> <strong>Idebenone</strong><br />
O<br />
MeO<br />
MeO<br />
O<br />
CH 3<br />
Accuracy (Recovery Test) 7 :<br />
Accuracy <strong>of</strong> the <strong>method</strong> was studied by recovery<br />
experiments. The recovery experiments were performed<br />
by add<strong>in</strong>g known amounts <strong>of</strong> the drugs <strong>in</strong> the placebo.<br />
The recovery was performed at three levels, 80,100and<br />
120% <strong>of</strong> <strong>Idebenone</strong> standard concentration. The<br />
recovery samples were prepared <strong>in</strong> afore mentioned<br />
procedure. Three samples were prepared for each<br />
recovery level. The solutions were then analyzed, and<br />
the percentage recoveries were calculated from the<br />
calibration curve. The recovery values for <strong>Idebenone</strong><br />
ranged from 99.68 to 99.82 % (Table no.3).<br />
Fig. No.2 - Determ<strong>in</strong>ation <strong>of</strong> max <strong>of</strong> <strong>Idebenone</strong> by <strong>UV</strong><br />
scann<strong>in</strong>g.<br />
282 nm<br />
1.4<br />
1<br />
Abs<br />
0.5<br />
OH<br />
-0.1<br />
200 250 300 350 400<br />
Wavelength [nm]<br />
L<strong>in</strong>earity:<br />
The l<strong>in</strong>earity <strong>of</strong> the response <strong>of</strong> the drug was verified at<br />
2 to 40 g/ml concentrations, but l<strong>in</strong>earity was found to<br />
be between 4-20 g/ml concentrations. The calibration<br />
curve was obta<strong>in</strong>ed by plott<strong>in</strong>g the absorbance versus the<br />
concentration data and was treated by l<strong>in</strong>ear regression<br />
analysis (Table no.2). The equation <strong>of</strong> the calibration<br />
curve for <strong>Idebenone</strong> obta<strong>in</strong>ed was y = 0.0485x - 0.0239,<br />
the calibration curve was found to be l<strong>in</strong>ear <strong>in</strong> the<br />
aforementioned concentrations (The correlation<br />
coefficient (r 2 ) <strong>of</strong> determ<strong>in</strong>ation was 0.9978).<br />
169