Spectrophotometric Estimation of Mesalazine in Tablet Dosage Form
Spectrophotometric Estimation of Mesalazine in Tablet Dosage Form
Spectrophotometric Estimation of Mesalazine in Tablet Dosage Form
- No tags were found...

Create successful ePaper yourself
Turn your PDF publications into a flip-book with our unique Google optimized e-Paper software.
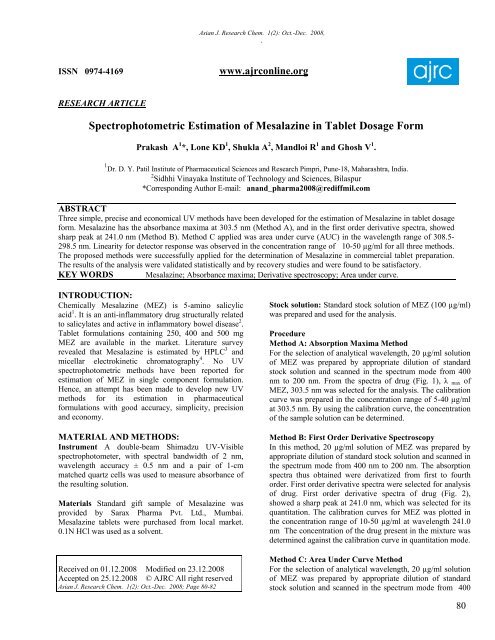
Asian J. Research Chem. 1(2): Oct.-Dec. 2008,,ISSN 0974-4169www.ajrconl<strong>in</strong>e.orgRESEARCH ARTICLE<strong>Spectrophotometric</strong> <strong>Estimation</strong> <strong>of</strong> <strong>Mesalaz<strong>in</strong>e</strong> <strong>in</strong> <strong>Tablet</strong> <strong>Dosage</strong> <strong>Form</strong>Prakash A 1 *, Lone KD 1 , Shukla A 2 , Mandloi R 1 and Ghosh V 1 .1 Dr. D. Y. Patil Institute <strong>of</strong> Pharmaceutical Sciences and Research Pimpri, Pune-18, Maharashtra, India.2 Sidhhi V<strong>in</strong>ayaka Institute <strong>of</strong> Technology and Sciences, Bilaspur*Correspond<strong>in</strong>g Author E-mail: anand_pharma2008@rediffmil.comABSTRACTThree simple, precise and economical UV methods have been developed for the estimation <strong>of</strong> <strong>Mesalaz<strong>in</strong>e</strong> <strong>in</strong> tablet dosageform. <strong>Mesalaz<strong>in</strong>e</strong> has the absorbance maxima at 303.5 nm (Method A), and <strong>in</strong> the first order derivative spectra, showedsharp peak at 241.0 nm (Method B). Method C applied was area under curve (AUC) <strong>in</strong> the wavelength range <strong>of</strong> 308.5-298.5 nm. L<strong>in</strong>earity for detector response was observed <strong>in</strong> the concentration range <strong>of</strong> 10-50 µg/ml for all three methods.The proposed methods were successfully applied for the determ<strong>in</strong>ation <strong>of</strong> <strong>Mesalaz<strong>in</strong>e</strong> <strong>in</strong> commercial tablet preparation.The results <strong>of</strong> the analysis were validated statistically and by recovery studies and were found to be satisfactory.KEY WORDS <strong>Mesalaz<strong>in</strong>e</strong>; Absorbance maxima; Derivative spectroscopy; Area under curve.INTRODUCTION:Chemically <strong>Mesalaz<strong>in</strong>e</strong> (MEZ) is 5-am<strong>in</strong>o salicylicacid 1 . It is an anti-<strong>in</strong>flammatory drug structurally relatedto salicylates and active <strong>in</strong> <strong>in</strong>flammatory bowel disease 2 .<strong>Tablet</strong> formulations conta<strong>in</strong><strong>in</strong>g 250, 400 and 500 mgMEZ are available <strong>in</strong> the market. Literature surveyrevealed that <strong>Mesalaz<strong>in</strong>e</strong> is estimated by HPLC 3 andmicellar electrok<strong>in</strong>etic chromatography 4 . No UVspectrophotometric methods have been reported forestimation <strong>of</strong> MEZ <strong>in</strong> s<strong>in</strong>gle component formulation.Hence, an attempt has been made to develop new UVmethods for its estimation <strong>in</strong> pharmaceuticalformulations with good accuracy, simplicity, precisionand economy.MATERIAL AND METHODS:Instrument A double-beam Shimadzu UV-Visiblespectrophotometer, with spectral bandwidth <strong>of</strong> 2 nm,wavelength accuracy ± 0.5 nm and a pair <strong>of</strong> 1-cmmatched quartz cells was used to measure absorbance <strong>of</strong>the result<strong>in</strong>g solution.Materials Standard gift sample <strong>of</strong> <strong>Mesalaz<strong>in</strong>e</strong> wasprovided by Sarax Pharma Pvt. Ltd., Mumbai.<strong>Mesalaz<strong>in</strong>e</strong> tablets were purchased from local market.0.1N HCl was used as a solvent.Received on 01.12.2008 Modified on 23.12.2008Accepted on 25.12.2008 © AJRC All right reservedAsian J. Research Chem. 1(2): Oct.-Dec. 2008; Page 80-82Stock solution: Standard stock solution <strong>of</strong> MEZ (100 µg/ml)was prepared and used for the analysis.ProcedureMethod A: Absorption Maxima MethodFor the selection <strong>of</strong> analytical wavelength, 20 µg/ml solution<strong>of</strong> MEZ was prepared by appropriate dilution <strong>of</strong> standardstock solution and scanned <strong>in</strong> the spectrum mode from 400nm to 200 nm. From the spectra <strong>of</strong> drug (Fig. 1), λ max <strong>of</strong>MEZ, 303.5 nm was selected for the analysis. The calibrationcurve was prepared <strong>in</strong> the concentration range <strong>of</strong> 5-40 µg/mlat 303.5 nm. By us<strong>in</strong>g the calibration curve, the concentration<strong>of</strong> the sample solution can be determ<strong>in</strong>ed.Method B: First Order Derivative SpectroscopyIn this method, 20 µg/ml solution <strong>of</strong> MEZ was prepared byappropriate dilution <strong>of</strong> standard stock solution and scanned <strong>in</strong>the spectrum mode from 400 nm to 200 nm. The absorptionspectra thus obta<strong>in</strong>ed were derivatized from first to fourthorder. First order derivative spectra were selected for analysis<strong>of</strong> drug. First order derivative spectra <strong>of</strong> drug (Fig. 2),showed a sharp peak at 241.0 nm, which was selected for itsquantitation. The calibration curves for MEZ was plotted <strong>in</strong>the concentration range <strong>of</strong> 10-50 µg/ml at wavelength 241.0nm The concentration <strong>of</strong> the drug present <strong>in</strong> the mixture wasdeterm<strong>in</strong>ed aga<strong>in</strong>st the calibration curve <strong>in</strong> quantitation mode.Method C: Area Under Curve MethodFor the selection <strong>of</strong> analytical wavelength, 20 µg/ml solution<strong>of</strong> MEZ was prepared by appropriate dilution <strong>of</strong> standardstock solution and scanned <strong>in</strong> the spectrum mode from 40080
nm to 200 nm. From the spectra <strong>of</strong> drugs, area under thecurve <strong>in</strong> the range <strong>of</strong> 308.5-298.5 nm was selected forthe analysis. The calibration curve was prepared <strong>in</strong> theconcentration range <strong>of</strong> 10-50 µg/ml at their respectiveAUC range. By us<strong>in</strong>g the calibration curve, theconcentration <strong>of</strong> the sample solution can be determ<strong>in</strong>ed.Asian J. Research Chem. 1(2): Oct.-Dec. 2008,,L<strong>in</strong>earity: The l<strong>in</strong>earity <strong>of</strong> measurement was evaluated byanalyz<strong>in</strong>g different concentration <strong>of</strong> the standard solution <strong>of</strong>MEZ. Beer-Lambert’s concentration range was found to be10-50 µg/ml for all three methods.Precision: The reproducibility <strong>of</strong> the proposed method wasdeterm<strong>in</strong>ed by perform<strong>in</strong>g tablet assay at different time<strong>in</strong>tervals (morn<strong>in</strong>g, afternoon and even<strong>in</strong>g) on same day(Intra-day assay precision) and on three different days (Interdayprecision). Result <strong>of</strong> <strong>in</strong>tra-day and <strong>in</strong>ter-day precision isexpressed <strong>in</strong> % RSD. Percent RSD for Intraday assayprecision was found to be 0.0905, 0.0153 and 0.0436 forMethod A, B and C, respectively. Inter-day assay precisionwas found to be 0.0504, 0.0552 and 0.0460 for Method A, Band C, respectively.Fig. 1: Zero order spectra <strong>of</strong> <strong>Mesalaz<strong>in</strong>e</strong>Application <strong>of</strong> the proposed method for thedeterm<strong>in</strong>ation <strong>of</strong> MEZ <strong>in</strong> tabletsFor the estimation <strong>of</strong> drugs <strong>in</strong> the commercialformulations, twenty tablets were weighed and averageweight was calculated. The tablets were crushed toobta<strong>in</strong> f<strong>in</strong>e powder. <strong>Tablet</strong> powder equivalent to 50 mgMEZ was transferred to 100.0 ml volumetric flask andvolume was made up to the mark with 0.1N HCl andultrasonicated for 10 m<strong>in</strong>utes. The solution was thenfiltered through a Whatmann filter paper (No. 41). Thefiltrate was appropriately diluted with 0.1N HCl toobta<strong>in</strong> 20 µg/ml <strong>of</strong> MEZ. In Method-A, theconcentration <strong>of</strong> MEZ was determ<strong>in</strong>ed by measur<strong>in</strong>g theabsorbance <strong>of</strong> the sample at 303.5 nm <strong>in</strong> zero orderspectrum mode. By us<strong>in</strong>g the calibration curve, theconcentration <strong>of</strong> the sample solution can be determ<strong>in</strong>ed.Method-B, the concentration <strong>of</strong> MEZ was determ<strong>in</strong>ed bymeasur<strong>in</strong>g the absorbance <strong>of</strong> the sample at 241.0 nm, <strong>in</strong>first order derivative mode. The results <strong>of</strong> the tabletanalysis were calculated aga<strong>in</strong>st the calibration curve <strong>in</strong>quantitation mode. For Method-C, the concentration <strong>of</strong>MSZ was determ<strong>in</strong>ed by measur<strong>in</strong>g area under curve <strong>in</strong>the range <strong>of</strong> 308.5-298.5 nm. By us<strong>in</strong>g the calibrationcurve, the concentration <strong>of</strong> the sample solution can bedeterm<strong>in</strong>ed. Results <strong>of</strong> tablet analysis are shown <strong>in</strong> TableNo. 1.VALIDATIONThe methods were validated with respect to l<strong>in</strong>earity,accuracy, precision and selectivity.Accuracy: To ascerta<strong>in</strong> the accuracy <strong>of</strong> proposedmethods, recovery studies were carried out by standardaddition method at three different levels (80%, 100% and120%). Percent recovery for MEZ, by all three methods,was found <strong>in</strong> the range <strong>of</strong> 98.33 % to 100.14 %.Fig. 2: First order derivative Spectra <strong>of</strong> <strong>Mesalaz<strong>in</strong>e</strong>Table No. 1: Results <strong>of</strong> Analysis <strong>of</strong> <strong>Tablet</strong> <strong>Form</strong>ulationMethod Label Amount<strong>of</strong> drug %Label%estimated Claim*ClaimRecovery*(mg/tab) ± S.D.A 400 398.64 99.66 ± 0.2103 99.37B 400 398.74 99.69 ± 0.1791 99.28C 400 399.00 99.75 ± 0.1757 99.47*<strong>in</strong>dicates mean <strong>of</strong> six determ<strong>in</strong>ationsRESULTS AND DISCUSSION:The methods discussed <strong>in</strong> the present work provide aconvenient and accurate way for analysis <strong>of</strong> <strong>Mesalaz<strong>in</strong>e</strong> <strong>in</strong> itspharmaceutical dosage form. Absorbance maxima <strong>of</strong><strong>Mesalaz<strong>in</strong>e</strong> at 303.5 nm (Method A); <strong>in</strong> the first orderderivative spectra, sharp peak at 241 nm (Method B) and areaunder curve <strong>in</strong> range <strong>of</strong> 308.5-298.5 nm (Method C) wereselected for the analysis. L<strong>in</strong>earity for detector response wasobserved <strong>in</strong> the concentration range <strong>of</strong> 10-50 µg/ml for allthree methods. Percent label claim for MEZ <strong>in</strong> tablet analysis,by all the methods, was found <strong>in</strong> the range <strong>of</strong> 99.40 % to99.97 %. Standard deviation and coefficient <strong>of</strong> variance forsix determ<strong>in</strong>ations <strong>of</strong> tablet sample, by all the methods, wasfound to be less than ± 2.0 <strong>in</strong>dicat<strong>in</strong>g the precision <strong>of</strong> themethods. Accuracy <strong>of</strong> proposed methods was ascerta<strong>in</strong>ed byrecovery studies and the results are expressed as % recovery.81
Percent recovery for MEZ, by all the methods, wasfound <strong>in</strong> the range <strong>of</strong> 98.33 % to 100.14 % values <strong>of</strong>standard deviation and coefficient <strong>of</strong> variation wassatisfactorily low <strong>in</strong>dicat<strong>in</strong>g the accuracy <strong>of</strong> the methods.Based on the results obta<strong>in</strong>ed, it is found that theproposed methods are accurate, precise, reproducibleand economical and can be employed for rout<strong>in</strong>e qualitycontrol <strong>of</strong> <strong>Mesalaz<strong>in</strong>e</strong> <strong>in</strong> its tablet formulation.ACKNOWLEDGEMENTS:The authors are very thankful to Sarax Pharma Pvt. Ltd.,Mumbai, for provid<strong>in</strong>g gift samples <strong>of</strong> <strong>Mesalaz<strong>in</strong>e</strong>.REFERENCES:1. Budavari S. The Merck Index. Merck Research Lab,Division <strong>of</strong> Merck and Co., Inc., Whitehouse Station NJ,1996; 12 th ed: pp 1163.2. Tripathi KD. Essentials <strong>of</strong> Medical Pharmacology. JaypeeBrothers Medical Publishers (P) Ltd, New Delhi. 2004;5th ed: pp 620-621.3. Nobilis M, Vybiralov Z, Sladkova K, Lisa M, HolcapekM and Kvet<strong>in</strong>a J. J Chromatogr A. 2006; 1119(1-2):299-308.4. Gotti R, Pomponio R, Bertucci C and Cavr<strong>in</strong>i V. JChromatogr A. 2001; 916(1-2): 175-183.Asian J. Research Chem. 1(2): Oct.-Dec. 2008,,82