Development of UV Spectrophotometric method of Idebenone in ...
Development of UV Spectrophotometric method of Idebenone in ...
Development of UV Spectrophotometric method of Idebenone in ...

You also want an ePaper? Increase the reach of your titles
YUMPU automatically turns print PDFs into web optimized ePapers that Google loves.
Asian J. Research Chem. 2(2): April.-June, 2009<br />
,<br />
ISSN 0974-4169<br />
www.ajrconl<strong>in</strong>e.org<br />
RESEARCH ARTICLE<br />
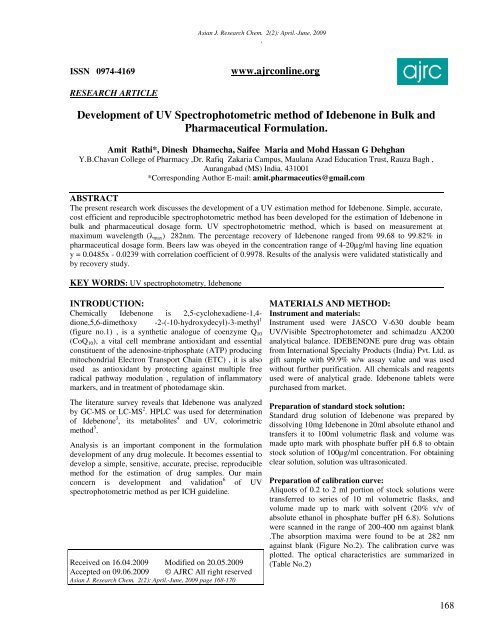
<strong>Development</strong> <strong>of</strong> <strong>UV</strong> <strong>Spectrophotometric</strong> <strong>method</strong> <strong>of</strong> <strong>Idebenone</strong> <strong>in</strong> Bulk and<br />
Pharmaceutical Formulation.<br />
Amit Rathi*, D<strong>in</strong>esh Dhamecha, Saifee Maria and Mohd Hassan G Dehghan<br />
Y.B.Chavan College <strong>of</strong> Pharmacy ,Dr. Rafiq Zakaria Campus, Maulana Azad Education Trust, Rauza Bagh ,<br />
Aurangabad (MS) India. 431001<br />
*Correspond<strong>in</strong>g Author E-mail: amit.pharmaceutics@gmail.com<br />
ABSTRACT<br />
The present research work discusses the development <strong>of</strong> a <strong>UV</strong> estimation <strong>method</strong> for <strong>Idebenone</strong>. Simple, accurate,<br />
cost efficient and reproducible spectrophotometric <strong>method</strong> has been developed for the estimation <strong>of</strong> <strong>Idebenone</strong> <strong>in</strong><br />
bulk and pharmaceutical dosage form. <strong>UV</strong> spectrophotometric <strong>method</strong>, which is based on measurement at<br />
maximum wavelength ( max ) 282nm. The percentage recovery <strong>of</strong> <strong>Idebenone</strong> ranged from 99.68 to 99.82% <strong>in</strong><br />
pharmaceutical dosage form. Beers law was obeyed <strong>in</strong> the concentration range <strong>of</strong> 4-20µg/ml hav<strong>in</strong>g l<strong>in</strong>e equation<br />
y = 0.0485x - 0.0239 with correlation coefficient <strong>of</strong> 0.9978. Results <strong>of</strong> the analysis were validated statistically and<br />
by recovery study.<br />
KEY WORDS: <strong>UV</strong> spectrophotometry, <strong>Idebenone</strong><br />
INTRODUCTION:<br />
Chemically <strong>Idebenone</strong> is 2,5-cyclohexadiene-1,4-<br />
dione,5,6-dimethoxy -2-(-10-hydroxydecyl)-3-methyl 1<br />
(figure no.1) , is a synthetic analogue <strong>of</strong> coenzyme Q 10<br />
(CoQ 10 ), a vital cell membrane antioxidant and essential<br />
constituent <strong>of</strong> the adenos<strong>in</strong>e-triphosphate (ATP) produc<strong>in</strong>g<br />
mitochondrial Electron Transport Cha<strong>in</strong> (ETC) , it is also<br />
used as antioxidant by protect<strong>in</strong>g aga<strong>in</strong>st multiple free<br />
radical pathway modulation , regulation <strong>of</strong> <strong>in</strong>flammatory<br />
markers, and <strong>in</strong> treatment <strong>of</strong> photodamage sk<strong>in</strong>.<br />
The literature survey reveals that <strong>Idebenone</strong> was analyzed<br />
by GC-MS or LC-MS 2 . HPLC was used for determ<strong>in</strong>ation<br />
<strong>of</strong> <strong>Idebenone</strong> 3 , its metabolites 4 and <strong>UV</strong>, colorimetric<br />
<strong>method</strong> 5 .<br />
Analysis is an important component <strong>in</strong> the formulation<br />
development <strong>of</strong> any drug molecule. It becomes essential to<br />
develop a simple, sensitive, accurate, precise, reproducible<br />
<strong>method</strong> for the estimation <strong>of</strong> drug samples. Our ma<strong>in</strong><br />
concern is development and validation 6 <strong>of</strong> <strong>UV</strong><br />
spectrophotometric <strong>method</strong> as per ICH guidel<strong>in</strong>e.<br />
Received on 16.04.2009 Modified on 20.05.2009<br />
Accepted on 09.06.2009 © AJRC All right reserved<br />
Asian J. Research Chem. 2(2): April.-June, 2009 page 168-170<br />
MATERIALS AND METHOD:<br />
Instrument and materials:<br />
Instrument used were JASCO V-630 double beam<br />
<strong>UV</strong>/Visible Spectrophotometer and schimadzu AX200<br />
analytical balance. IDEBENONE pure drug was obta<strong>in</strong><br />
from International Specialty Products (India) Pvt. Ltd. as<br />
gift sample with 99.9% w/w assay value and was used<br />
without further purification. All chemicals and reagents<br />
used were <strong>of</strong> analytical grade. <strong>Idebenone</strong> tablets were<br />
purchased from market.<br />
Preparation <strong>of</strong> standard stock solution:<br />
Standard drug solution <strong>of</strong> <strong>Idebenone</strong> was prepared by<br />
dissolv<strong>in</strong>g 10mg <strong>Idebenone</strong> <strong>in</strong> 20ml absolute ethanol and<br />
transfers it to 100ml volumetric flask and volume was<br />
made upto mark with phosphate buffer pH 6.8 to obta<strong>in</strong><br />
stock solution <strong>of</strong> 100µg/ml concentration. For obta<strong>in</strong><strong>in</strong>g<br />
clear solution, solution was ultrasonicated.<br />
Preparation <strong>of</strong> calibration curve:<br />
Aliquots <strong>of</strong> 0.2 to 2 ml portion <strong>of</strong> stock solutions were<br />
transferred to series <strong>of</strong> 10 ml volumetric flasks, and<br />
volume made up to mark with solvent (20% v/v <strong>of</strong><br />
absolute ethanol <strong>in</strong> phosphate buffer pH 6.8). Solutions<br />
were scanned <strong>in</strong> the range <strong>of</strong> 200-400 nm aga<strong>in</strong>st blank<br />
.The absorption maxima were found to be at 282 nm<br />
aga<strong>in</strong>st blank (Figure No.2). The calibration curve was<br />
plotted. The optical characteristics are summarized <strong>in</strong><br />
(Table No.2)<br />
168
Asian J. Research Chem. 2(2): April.-June, 2009<br />
,<br />
Preparation <strong>of</strong> sample solution:<br />
The proposed <strong>method</strong> was applied to analyse commercially<br />
available <strong>Idebenone</strong> tablet. Ten tablets were weighed and<br />
powdered. The amount <strong>of</strong> tablet powder equivalent to 10<br />
mg <strong>of</strong> <strong>Idebenone</strong> was weighed accurately and transfer to<br />
100ml volumetric flask then 20 ml absolute ethanol was<br />
added and kept for 15 m<strong>in</strong> with frequent shak<strong>in</strong>g and<br />
volume was made up to mark with phosphate buffer pH<br />
6.8.The solution was then filtered through Whattman filter<br />
paper #41.This filtrate was diluted suitably with solvent<br />
(20% v/v absolute ethanol <strong>in</strong> phosphate buffer pH 6.8) to<br />
get the solution <strong>of</strong> 12µg/ml concentration .The absorbance<br />
was measured aga<strong>in</strong>st solution blank.<br />
Table No.1 - Calibration Curve parameter<br />
Sr.<br />
No.<br />
Concentration<br />
(µg/ml)<br />
Absorbance<br />
(average)<br />
Standard<br />
deviation<br />
1 0 0 0<br />
2 2 0.0713 ±0.005859<br />
3 4 0.1552 ±0.001724<br />
4 6 0.2552 ±0.0009<br />
5 8 0.3629 ±0.001206<br />
6 10 0.4766 ±0.014856<br />
7 12 0.5577 0<br />
8 14 0.6332 ±0.010201<br />
9 16 0.7384 ±0.006341<br />
10 18 0.8584 ±0.009174<br />
11 20 0.9651 ±0.007279<br />
Table.2 - Validation parameters<br />
Sr. No. Parameter<br />
Result<br />
1. Absorption maxima(nm) 282<br />
2. L<strong>in</strong>earity Range (µg/ml) 4-20<br />
3 Standard Regression y = 0.0485x - 0.0239<br />
Equation<br />
4 Correlation Coefficient (r2 ) r 2 = 0. 9978<br />
5 Molar absorptivity 14818.71<br />
6 A( 1% , 1cm ) 443.088<br />
7 Accuracy (% recovery ±SD) 99.74 % ± 0.07211<br />
8 Precision (% CV) 99.67 %, 99.68 %<br />
9 Specificity A 12 µg/ml solution<br />
<strong>of</strong> candidate drug <strong>in</strong><br />
solvent (20%v/v<br />
ethanol <strong>in</strong> 6.8-pH<br />
phosphate buffer) at<br />
<strong>UV</strong> detection λ <strong>of</strong><br />
282 nm will show an<br />
absorbance value <strong>of</strong><br />
0.5777<br />
10 Sandell’s Sensitivity 8 0.022735<br />
(µg/cm 2 /0.001 absorbance<br />
unit)<br />
11 LOD (µg/ml) 1.6261<br />
12 LOQ (µg/ml) 4.9278<br />
The drug content <strong>of</strong> the preparation was calculated us<strong>in</strong>g<br />
standard calibration curve. Amount <strong>of</strong> drug estimated by<br />
this <strong>method</strong> is given <strong>in</strong> (Table No.3).<br />
RESULT AND DISCUSSION:<br />
Precision:<br />
Assay <strong>of</strong> <strong>method</strong> precision (<strong>in</strong>tra-day precision) was<br />
evaluated by carry<strong>in</strong>g out six <strong>in</strong>dependent assays <strong>of</strong> test<br />
samples <strong>of</strong> <strong>Idebenone</strong>. The <strong>in</strong>termediate precision (<strong>in</strong>terday<br />
precision) <strong>of</strong> the <strong>method</strong> was also evaluated us<strong>in</strong>g<br />
two different analysts, systems and different days <strong>in</strong> the<br />
same laboratory. The relative standard deviation (RSD)<br />
and assay values obta<strong>in</strong>ed by two analysts were 0.28,<br />
99.67 and 0.26, 99.68 respectively (Table no.4).<br />
Fig. No.1 - Chemical structure <strong>of</strong> <strong>Idebenone</strong><br />
O<br />
MeO<br />
MeO<br />
O<br />
CH 3<br />
Accuracy (Recovery Test) 7 :<br />
Accuracy <strong>of</strong> the <strong>method</strong> was studied by recovery<br />
experiments. The recovery experiments were performed<br />
by add<strong>in</strong>g known amounts <strong>of</strong> the drugs <strong>in</strong> the placebo.<br />
The recovery was performed at three levels, 80,100and<br />
120% <strong>of</strong> <strong>Idebenone</strong> standard concentration. The<br />
recovery samples were prepared <strong>in</strong> afore mentioned<br />
procedure. Three samples were prepared for each<br />
recovery level. The solutions were then analyzed, and<br />
the percentage recoveries were calculated from the<br />
calibration curve. The recovery values for <strong>Idebenone</strong><br />
ranged from 99.68 to 99.82 % (Table no.3).<br />
Fig. No.2 - Determ<strong>in</strong>ation <strong>of</strong> max <strong>of</strong> <strong>Idebenone</strong> by <strong>UV</strong><br />
scann<strong>in</strong>g.<br />
282 nm<br />
1.4<br />
1<br />
Abs<br />
0.5<br />
OH<br />
-0.1<br />
200 250 300 350 400<br />
Wavelength [nm]<br />
L<strong>in</strong>earity:<br />
The l<strong>in</strong>earity <strong>of</strong> the response <strong>of</strong> the drug was verified at<br />
2 to 40 g/ml concentrations, but l<strong>in</strong>earity was found to<br />
be between 4-20 g/ml concentrations. The calibration<br />
curve was obta<strong>in</strong>ed by plott<strong>in</strong>g the absorbance versus the<br />
concentration data and was treated by l<strong>in</strong>ear regression<br />
analysis (Table no.2). The equation <strong>of</strong> the calibration<br />
curve for <strong>Idebenone</strong> obta<strong>in</strong>ed was y = 0.0485x - 0.0239,<br />
the calibration curve was found to be l<strong>in</strong>ear <strong>in</strong> the<br />
aforementioned concentrations (The correlation<br />
coefficient (r 2 ) <strong>of</strong> determ<strong>in</strong>ation was 0.9978).<br />
169
Asian J. Research Chem. 2(2): April.-June, 2009<br />
,<br />
Table No.3 - Determ<strong>in</strong>ation <strong>of</strong> Accuracy by percentage recovery <strong>method</strong><br />
Ingredient<br />
Tablet amount Level <strong>of</strong><br />
Amount added Amount recovered<br />
(µg/ml)<br />
addition (%) (µg/ml) (µg/ml)<br />
%Recovery<br />
12 80 9.6 21.53 99.68<br />
<strong>Idebenone</strong> 12 100 12 23.93 99.72<br />
12 120 14.4 26.35 99.82<br />
Average %<br />
Recovery<br />
99.74 ±<br />
0.07211<br />
Table No.4 - Determ<strong>in</strong>ation <strong>of</strong> Precision<br />
Sample Assay <strong>of</strong> <strong>Idebenone</strong> as % <strong>of</strong> labeled amount<br />
number<br />
Analyst-I<br />
(Intra-day precision)<br />
1 99.72 99.77<br />
2 99.93 99.97<br />
3 99.78 99.71<br />
4 99.90 99.88<br />
5 99.48 99.51<br />
6 99.20 99.25<br />
Mean 99.67 99.68<br />
SD 0.28 0.26<br />
Analyst-II<br />
(Inter-day precision)<br />
Limit <strong>of</strong> Detection (LOD) and Limit <strong>of</strong> Quantification<br />
(LOQ):<br />
The LOD and LOQ <strong>of</strong> <strong>Idebenone</strong> were determ<strong>in</strong>ed by<br />
us<strong>in</strong>g standard deviation <strong>of</strong> the response and slope<br />
approach as def<strong>in</strong>ed <strong>in</strong> International Conference on<br />
Harmonization (ICH) guidel<strong>in</strong>es. The LOD and LOQ for<br />
<strong>Idebenone</strong> are described <strong>in</strong> (Table no. 2).<br />
Determ<strong>in</strong>ation <strong>of</strong> Active Ingredients <strong>in</strong> Tablets:<br />
The validated <strong>method</strong> was applied to the determ<strong>in</strong>ation <strong>of</strong><br />
<strong>Idebenone</strong> <strong>in</strong> Tablets. Six tablets were assayed and the<br />
results are shown <strong>in</strong> (Table no. 3) <strong>in</strong>dicat<strong>in</strong>g that the<br />
amount <strong>of</strong> drug <strong>in</strong> tablet samples met with requirements<br />
(98–102% <strong>of</strong> the label claim).<br />
REFERENCES:<br />
1. Nagaoka A.<strong>Idebenone</strong>. New Cardiovascular Drugs. 1987;<br />
217-235.<br />
2. Wempe MF, Lightner JW, Zoeller EL, Rice PJ.<br />
Investigat<strong>in</strong>g idebenone and idebenone l<strong>in</strong>oleate<br />
metabolism: <strong>in</strong> vitro pig ear and mouse melanocyte<br />
studies .J Cos Dermat. 2009; 8(1): 63-73.<br />
3. Kim HJ, Yoon KA, Hahn M, Park ES, Chi SC.<br />
Preparation and In Vitro Evaluation <strong>of</strong> Self-<br />
Microemulsify<strong>in</strong>g Drug Delivery Systems Conta<strong>in</strong><strong>in</strong>g<br />
<strong>Idebenone</strong> .Drug Devlop Ind Pharm. 2000; 26 : 523-529.<br />
4. Wakabayashi H, Nakajima M, Yamato S, Shimada K .<br />
Determ<strong>in</strong>ation <strong>of</strong> idebenone <strong>in</strong> rat serum and bra<strong>in</strong> by<br />
high-performance liquid chromatography us<strong>in</strong>g plat<strong>in</strong>um<br />
catalyst reduction and electrochemical detection. J<br />
Chromatogr. 1992; 573:154-157.<br />
5. Francis M, Sane RT, Khatri A, Pathak AR. Uvspectrophotometric<br />
and colorimetric <strong>method</strong>s for<br />
determ<strong>in</strong>ation <strong>of</strong> idebenone from bulk drug and its<br />
pharmaceutical formulation.Ind Drugs. 2001; 38: 642-<br />
645 .<br />
6. Validation <strong>of</strong> Analytical Procedures: Methodology (Q2B)<br />
Harmonized Tripartite Guidel<strong>in</strong>es.<br />
7. ICH (2005) Text on validation <strong>of</strong> analytical procedures.<br />
Q2B.<br />
8. Khopkar SM . Basic Concepts <strong>of</strong> Analytical Chemistry<br />
.3rd ed., New Age International Pblisher. 2008; 277-278.<br />
CONCLUSIONS:<br />
The developed <strong>method</strong> was found to be simple, sensitive,<br />
accurate, precise, reproducible, and can be used for rout<strong>in</strong>e<br />
quality control analysis <strong>of</strong> <strong>Idebenone</strong> <strong>in</strong> bulk and<br />
pharmaceutical formulation<br />
ACKNOWLEDGEMENT:<br />
We would like to thank Mrs Fatma Rafiq Zakaria, Hon’ble<br />
Chairman <strong>of</strong> Maulana Azad Educational Trust, Dr Rafiq<br />
Zakaria Campus for provid<strong>in</strong>g all the facilities. We are<br />
also thankful to International Specialty Products<br />
PVT.LTD.,Hyderabad for giv<strong>in</strong>g us gift sample <strong>of</strong><br />
<strong>Idebenone</strong> drug.<br />
170