2011. In this annual information form - Encana
2011. In this annual information form - Encana
2011. In this annual information form - Encana

Create successful ePaper yourself
Turn your PDF publications into a flip-book with our unique Google optimized e-Paper software.
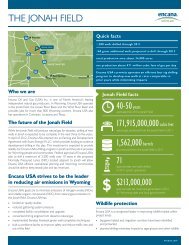
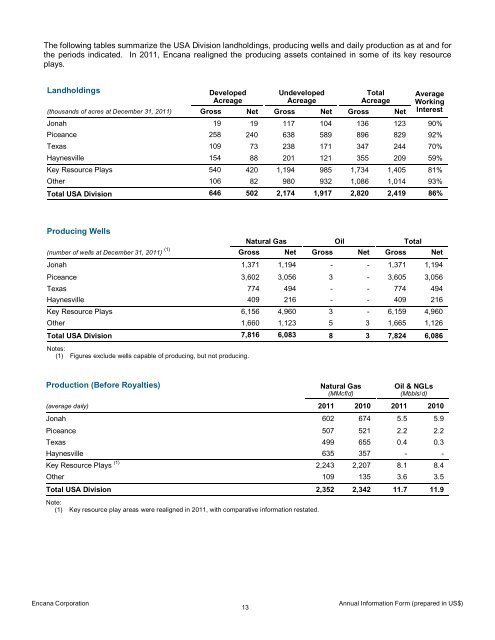
The following tables summarize the USA Division landholdings, producing wells and daily production as at and for<br />
the periods indicated. <strong>In</strong> 2011, <strong>Encana</strong> realigned the producing assets contained in some of its key resource<br />
plays.<br />
Landholdings<br />
Developed<br />
Acreage<br />
Undeveloped<br />
Acreage<br />
Total<br />
Acreage<br />
(thousands of acres at December 31, 2011) Gross Net Gross Net Gross Net<br />
Average<br />
Working<br />
<strong>In</strong>terest<br />
Jonah 19 19 117 104 136 123 90%<br />
Piceance 258 240 638 589 896 829 92%<br />
Texas 109 73 238 171 347 244 70%<br />
Haynesville 154 88 201 121 355 209 59%<br />
Key Resource Plays 540 420 1,194 985 1,734 1,405 81%<br />
Other 106 82 980 932 1,086 1,014 93%<br />
Total USA Division 646 502 2,174 1,917 2,820 2,419 86%<br />
Producing Wells<br />
Natural Gas Oil Total<br />
(number of wells at December 31, 2011) (1) Gross Net Gross Net Gross Net<br />
Jonah 1,371 1,194 - - 1,371 1,194<br />
Piceance 3,602 3,056 3 - 3,605 3,056<br />
Texas 774 494 - - 774 494<br />
Haynesville 409 216 - - 409 216<br />
Key Resource Plays 6,156 4,960 3 - 6,159 4,960<br />
Other 1,660 1,123 5 3 1,665 1,126<br />
Total USA Division 7,816 6,083 8 3 7,824 6,086<br />
Notes:<br />
(1) Figures exclude wells capable of producing, but not producing.<br />
Production (Before Royalties)<br />
Natural Gas<br />
(MMcf/d)<br />
Oil & NGLs<br />
(Mbbls/d)<br />
(average daily) 2011 2010 2011 2010<br />
Jonah 602 674 5.5 5.9<br />
Piceance 507 521 2.2 2.2<br />
Texas 499 655 0.4 0.3<br />
Haynesville 635 357 - -<br />
Key Resource Plays (1) 2,243 2,207 8.1 8.4<br />
Other 109 135 3.6 3.5<br />
Total USA Division 2,352 2,342 11.7 11.9<br />
Note:<br />
(1) Key resource play areas were realigned in 2011, with comparative <strong>in<strong>form</strong>ation</strong> restated.<br />
<strong>Encana</strong> Corporation<br />
13<br />
Annual <strong>In</strong><strong>form</strong>ation Form (prepared in US$)