ISIS FAST Case Study - Halcrow
ISIS FAST Case Study - Halcrow
ISIS FAST Case Study - Halcrow

Create successful ePaper yourself
Turn your PDF publications into a flip-book with our unique Google optimized e-Paper software.
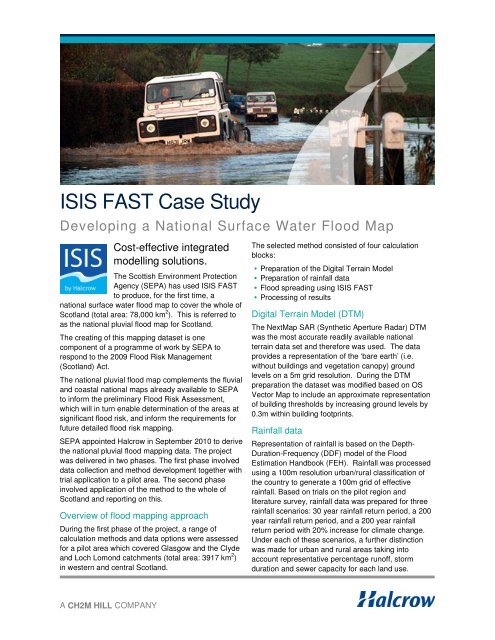
<strong>ISIS</strong> <strong>FAST</strong> <strong>Case</strong> <strong>Study</strong><br />
Developing a National Surface Water Flood Map<br />
Cost-effective integrated<br />
modelling solutions.<br />
The Scottish Environment Protection<br />
Agency (SEPA) has used <strong>ISIS</strong> <strong>FAST</strong><br />
to produce, for the first time, a<br />
national surface water flood map to cover the whole of<br />
Scotland (total area: 78,000 km 2 ). This is referred to<br />
as the national pluvial flood map for Scotland.<br />
The creating of this mapping dataset is one<br />
component of a programme of work by SEPA to<br />
respond to the 2009 Flood Risk Management<br />
(Scotland) Act.<br />
The national pluvial flood map complements the fluvial<br />
and coastal national maps already available to SEPA<br />
to inform the preliminary Flood Risk Assessment,<br />
which will in turn enable determination of the areas at<br />
significant flood risk, and inform the requirements for<br />
future detailed flood risk mapping.<br />
SEPA appointed <strong>Halcrow</strong> in September 2010 to derive<br />
the national pluvial flood mapping data. The project<br />
was delivered in two phases. The first phase involved<br />
data collection and method development together with<br />
trial application to a pilot area. The second phase<br />
involved application of the method to the whole of<br />
Scotland and reporting on this.<br />
Overview of flood mapping approach<br />
During the first phase of the project, a range of<br />
calculation methods and data options were assessed<br />
for a pilot area which covered Glasgow and the Clyde<br />
and Loch Lomond catchments (total area: 3917 km 2 )<br />
in western and central Scotland.<br />
The selected method consisted of four calculation<br />
blocks:<br />
Preparation of the Digital Terrain Model<br />
Preparation of rainfall data<br />
Flood spreading using <strong>ISIS</strong> <strong>FAST</strong><br />
Processing of results<br />
Digital Terrain Model (DTM)<br />
The NextMap SAR (Synthetic Aperture Radar) DTM<br />
was the most accurate readily available national<br />
terrain data set and therefore was used. The data<br />
provides a representation of the ‘bare earth’ (i.e.<br />
without buildings and vegetation canopy) ground<br />
levels on a 5m grid resolution. During the DTM<br />
preparation the dataset was modified based on OS<br />
Vector Map to include an approximate representation<br />
of building thresholds by increasing ground levels by<br />
0.3m within building footprints.<br />
Rainfall data<br />
Representation of rainfall is based on the Depth-<br />
Duration-Frequency (DDF) model of the Flood<br />
Estimation Handbook (FEH). Rainfall was processed<br />
using a 100m resolution urban/rural classification of<br />
the country to generate a 100m grid of effective<br />
rainfall. Based on trials on the pilot region and<br />
literature survey, rainfall data was prepared for three<br />
rainfall scenarios: 30 year rainfall return period, a 200<br />
year rainfall return period, and a 200 year rainfall<br />
return period with 20% increase for climate change.<br />
Under each of these scenarios, a further distinction<br />
was made for urban and rural areas taking into<br />
account representative percentage runoff, storm<br />
duration and sewer capacity for each land use.<br />
A CH2M HILL COMPANY
Flood spreading using <strong>ISIS</strong> <strong>FAST</strong><br />
The use of <strong>ISIS</strong> <strong>FAST</strong> to simulate the pluvial flood<br />
spreading process is a core component of the<br />
method. <strong>ISIS</strong> <strong>FAST</strong> uses simplified hydraulics to<br />
spread water over a DTM. Its high computational<br />
efficiency, robustness (numerical stability), and<br />
volume conservative approach (which focuses on<br />
identifying ponded areas) makes it suitable to identify<br />
risk of flooding from pluvial sources.<br />
Flood spreading was carried out using a set of about<br />
4,000 <strong>ISIS</strong> <strong>FAST</strong> models per rainfall scenario (each<br />
model representing a hydrological catchment). The<br />
total simulation run time for the whole of Scotland is<br />
under 48hours per rainfall scenario.<br />
Validation of the simulated pluvial flood outputs was<br />
undertaken using three approaches:<br />
Comparison with historical observed pluvial<br />
flooding data<br />
Comparison with simulated results generated by<br />
other, more detailed, methods<br />
‘Sensibility’ checks, for example to identify nonphysical<br />
behaviour<br />
The comparison data sets identified during the project<br />
that were relevant, reliable and available for use<br />
included the following information: (a) post flood event<br />
report on Glasgow East End flooding of 30 July 2002,<br />
(b) selected interim results (March 2011) from the<br />
modelling for the Glasgow Surface Water<br />
Management Strategy which used a detailed<br />
integrated surface-drainage model and LiDAR data.<br />
The qualitative assessment undertaken confirmed that<br />
the method provided satisfactory results for<br />
identification of areas susceptible to pluvial flooding<br />
influenced by topography (as represented in the DTM)<br />
at national and regional scales.<br />
Results processing<br />
The <strong>ISIS</strong> <strong>FAST</strong> run for each rainfall scenario produced<br />
a GIS file (raster grid) of pluvial flood depths for each<br />
catchment at a 5m grid resolution. These results were<br />
then processed to remove small ponded areas (