
You also want an ePaper? Increase the reach of your titles
YUMPU automatically turns print PDFs into web optimized ePapers that Google loves.
PLAYING FOUR GAmES IN FIVE DAYS (CONTINUED)<br />
<strong>NBA</strong> futures because a team with a scheduling advantage in 4-in-5<br />
situations can be expected to win more games than the linesmakers<br />
forecast and teams with a scheduling disadvantage can be expected<br />
to win fewer games than forecast.<br />
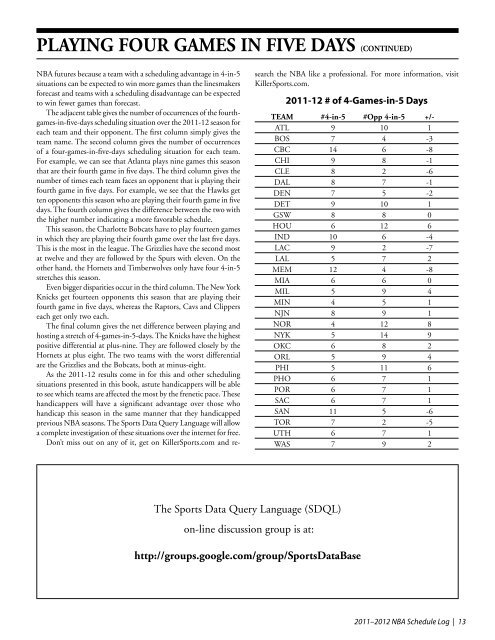
The adjacent table gives the number of occurrences of the fourthgames-in-five-days<br />
scheduling situation over the 2011-12 season for<br />
each team and their opponent. The first column simply gives the<br />
team name. The second column gives the number of occurrences<br />
of a four-games-in-five-days scheduling situation for each team.<br />
For example, we can see that Atlanta plays nine games this season<br />
that are their fourth game in five days. The third column gives the<br />
number of times each team faces an opponent that is playing their<br />
fourth game in five days. For example, we see that the Hawks get<br />
ten opponents this season who are playing their fourth game in five<br />
days. The fourth column gives the difference between the two with<br />
the higher number indicating a more favorable schedule.<br />
This season, the Charlotte Bobcats have to play fourteen games<br />
in which they are playing their fourth game over the last five days.<br />
This is the most in the league. The Grizzlies have the second most<br />
at twelve and they are followed by the Spurs with eleven. On the<br />
other hand, the Hornets and Timberwolves only have four 4-in-5<br />
stretches this season.<br />
Even bigger disparities occur in the third column. The New York<br />
Knicks get fourteen opponents this season that are playing their<br />
fourth game in five days, whereas the Raptors, Cavs and Clippers<br />
each get only two each.<br />
The final column gives the net difference between playing and<br />
hosting a stretch of 4-games-in-5-days. The Knicks have the highest<br />
positive differential at plus-nine. They are followed closely by the<br />
Hornets at plus eight. The two teams with the worst differential<br />
are the Grizzlies and the Bobcats, both at minus-eight.<br />
As the 2011-12 results come in for this and other scheduling<br />
situations presented in this book, astute handicappers will be able<br />
to see which teams are affected the most by the frenetic pace. These<br />
handicappers will have a significant advantage over those who<br />
handicap this season in the same manner that they handicapped<br />
previous <strong>NBA</strong> seasons. The Sports Data Query Language will allow<br />
a complete investigation of these situations over the internet for free.<br />
Don’t miss out on any of it, get on KillerSports.com and re-<br />
The Sports Data Query Language (SDQL)<br />
on-line discussion group is at:<br />
search the <strong>NBA</strong> like a professional. For more information, visit<br />
KillerSports.com.<br />
2011-12 # of 4-Games-in-5 Days<br />
TEAm #4-in-5 #Opp 4-in-5 +/-<br />
ATL 9 10 1<br />
BOS 7 4 -3<br />
CBC 14 6 -8<br />
CHI 9 8 -1<br />
CLE 8 2 -6<br />
DAL 8 7 -1<br />
DEN 7 5 -2<br />
DET 9 10 1<br />
GSW 8 8 0<br />
HOU 6 12 6<br />
IND 10 6 -4<br />
LAC 9 2 -7<br />
LAL 5 7 2<br />
MEM 12 4 -8<br />
MIA 6 6 0<br />
MIL 5 9 4<br />
MIN 4 5 1<br />
NJN 8 9 1<br />
NOR 4 12 8<br />
NYK 5 14 9<br />
OKC 6 8 2<br />
ORL 5 9 4<br />
PHI 5 11 6<br />
PHO 6 7 1<br />
POR 6 7 1<br />
SAC 6 7 1<br />
SAN 11 5 -6<br />
TOR 7 2 -5<br />
UTH 6 7 1<br />
WAS 7 9 2<br />
http://groups.google.com/group/SportsDataBase<br />
2011–2012 <strong>NBA</strong> <strong>Schedule</strong> <strong>Log</strong> | 13