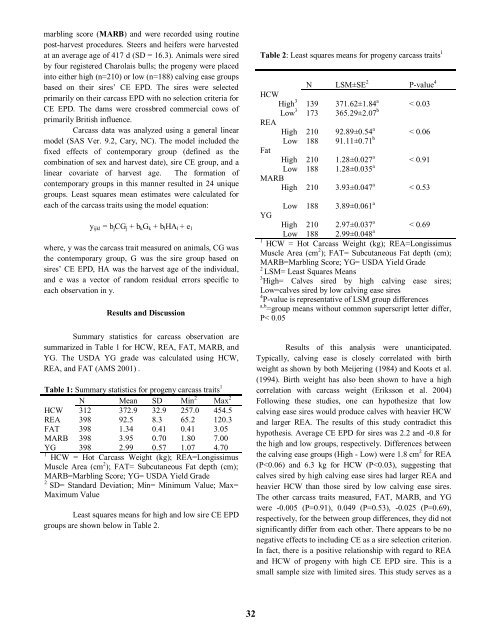
- Page 1 and 2: PROCEEDINGS Volume 60 American Soci
- Page 3 and 4: Associations of Prolactin Receptor
- Page 5 and 6: Analysis of Estrone Sulphate, Testo
- Page 7 and 8: Duration of Daily Bull Exposure on
- Page 9 and 10: Effects of Time of Transporting Pri
- Page 11 and 12: Academic Quadrathlon D.C. Rule (Uni
- Page 13 and 14: 4. Strategic Plan. The A&C committe
- Page 15 and 16: California, Davis are participating
- Page 17 and 18: WSASAS Symposium Budget: (based on
- Page 19 and 20: Proceedings, Western Section, Ameri
- Page 21 and 22: costs) as “free money” or “pr
- Page 23 and 24: Proceedings, Western Section, Ameri
- Page 25 and 26: Relative expression Relative expre
- Page 27 and 28: Proceedings, Western Section, Ameri
- Page 29 and 30: Results and Discussion Calves were
- Page 31 and 32: Proceedings, Western Section, Ameri
- Page 33 and 34: 0.10). Mixed model analyses of thes
- Page 35 and 36: Proceedings, Western Section, Ameri
- Page 37 and 38: to be 0.11 and 0.14 in the two herd
- Page 39 and 40: Proceedings, Western Section, Ameri
- Page 41 and 42: efficiency have significant implica
- Page 43: Proceedings, Western Section, Ameri
- Page 47 and 48: steer left the squeeze chute and a
- Page 49 and 50: Proceedings, Western Section, Ameri
- Page 51 and 52: Gregory, M. E., C. T. Blunn, and M.
- Page 53 and 54: et al. (1990) estimated heritabilit
- Page 55 and 56: Effective population size (N e ), d
- Page 57 and 58: Literature Cited Aho, A. V., B. W.
- Page 59 and 60: Table 3. Estimates of genetic param
- Page 61 and 62: 261.98±20.24, 268.30±9.57, 298.50
- Page 63 and 64: Table 1. Least squares means for bi
- Page 65 and 66: DNA, then DNA was washed with EtOH
- Page 67 and 68: Table 1. Least squares means and st
- Page 69 and 70: (Table 1). Cows were combined into
- Page 71 and 72: Rhoades, R. D., J. E. Sawyer, K. Y.
- Page 73 and 74: pregnancy rate was determined via t
- Page 75 and 76: Table 1. Effect of heifer developme
- Page 77 and 78: determined via transrectal ultrason
- Page 79 and 80: Table 1. Effect of winter system on
- Page 81 and 82: Proceedings, Western Section, Ameri
- Page 83 and 84: increased HCW of steers born earlie
- Page 85 and 86: Proceeding, Western Section, Americ
- Page 87 and 88: degrees of freedom method was used
- Page 89 and 90: Table 2. Supplement × physiologica
- Page 91 and 92: to water and a loose macro- and mic
- Page 93 and 94: Table 2. Effects of calving body co
- Page 95 and 96:
ased on average quality and availab
- Page 97 and 98:
1 See figure legends for descriptio
- Page 99 and 100:
the most important criterions in ra
- Page 101 and 102:
Proceedings, Western Section, Ameri
- Page 103 and 104:
Results Perceptions of profitabilit
- Page 105 and 106:
Proceedings, Western Section, Ameri
- Page 107 and 108:
input cost into the system. Sand an
- Page 109 and 110:
Proceedings, Western Section, Ameri
- Page 111 and 112:
Physiological state has also been h
- Page 113 and 114:
Table 3 Percent crude protein (CP),
- Page 115 and 116:
conducted for 90 d from Dec 1, 2007
- Page 117 and 118:
In f o Proceedings, Western Section
- Page 119 and 120:
identified in the commercially avai
- Page 121 and 122:
Proceedings, Western Section, Ameri
- Page 123 and 124:
The absence of shade in pen decreas
- Page 125 and 126:
Proceedings, Western Section, Ameri
- Page 127 and 128:
T e m Figure 2. Impact of three pre
- Page 129 and 130:
weaning date can have a positive im
- Page 131 and 132:
Table 1. Systems Backgrounding Perf
- Page 133 and 134:
Results and Discussion Maximum and
- Page 135 and 136:
Figure 2. Oxygen levels of two comp
- Page 137 and 138:
contemporary groups where two intac
- Page 139 and 140:
Sund, J. M. and M. J. Wright. 1956.
- Page 141 and 142:
thiamin), or 4) HIGH (150 mg·hd -1
- Page 143 and 144:
Literature Cited Buckner, C. D., T.
- Page 145 and 146:
Proceedings, Western Section, Ameri
- Page 147 and 148:
Serum estradiol concentrations were
- Page 149 and 150:
Proceedings, Western Section, Ameri
- Page 151 and 152:
Literature Cited AOAC. 1999. Offici
- Page 153 and 154:
Proceedings, Western Section, Ameri
- Page 155 and 156:
Results The BFTH contained four and
- Page 157 and 158:
Proceedings, Western Section, Ameri
- Page 159 and 160:
The genetic correlation between MS
- Page 161 and 162:
Proceedings, Western Section, Ameri
- Page 163 and 164:
Acknowledgements Red Angus Associat
- Page 165 and 166:
Proceedings, Western Section, Ameri
- Page 167 and 168:
absorbed from the small intestine (
- Page 169 and 170:
Proceedings, Western Section, Ameri
- Page 171 and 172:
ather than May (P < 0.10). Differen
- Page 173 and 174:
May July Low Mod High SE Table 3. R
- Page 175 and 176:
Aubrey, TX) to achieve a concentrat
- Page 177 and 178:
hormone concentrations in stallions
- Page 179 and 180:
* * Figure 3. Mean cortisol concent
- Page 181 and 182:
Proceedings, Western Section, Ameri
- Page 183 and 184:
in psyllium-supplemented horses but
- Page 185 and 186:
Proceedings, Western Section, Ameri
- Page 187 and 188:
References AOAC. 1990. Official Met
- Page 189 and 190:
Proceedings, Western Section, Ameri
- Page 191 and 192:
Implications If available and cost
- Page 193 and 194:
Proceedings, Western Section, Ameri
- Page 195 and 196:
Slaughter Characteristic of Ram and
- Page 197 and 198:
2003). Study 2 included trials in J
- Page 199 and 200:
are more accurate than external mar
- Page 201 and 202:
Proceedings, Western Section, Ameri
- Page 203 and 204:
than animals fed 24% CP-diet during
- Page 205 and 206:
Proceedings, Western Section, Ameri
- Page 207 and 208:
Over complete 28 days fattening exp
- Page 209 and 210:
Proceedings, Western Section, Ameri
- Page 211 and 212:
uminally undegradable protein presu
- Page 213 and 214:
Proceedings, Western Section, Ameri
- Page 215 and 216:
Todd, A. L., L. M. M. Surber, S. D.
- Page 217 and 218:
Proceedings, Western Section, Ameri
- Page 219 and 220:
2006. Effects of supplementing drie
- Page 221 and 222:
warm-season annual legumes were use
- Page 223 and 224:
parturition was similar for all cow
- Page 225 and 226:
Proceedings, Western Section, Ameri
- Page 227 and 228:
Table 3. Average spring 2009 percen
- Page 229 and 230:
evaluated based on significant effe
- Page 231 and 232:
Table 1. Effect of supplemental cor
- Page 233 and 234:
ated by two ultrasound examinations
- Page 235 and 236:
Table 1. Percentages of heifers tha
- Page 237 and 238:
Treatment 2 was the 12 h interval o
- Page 239 and 240:
Proceedings, Western Section, Ameri
- Page 241 and 242:
treated with a CIDR for 14 d exhibi
- Page 243 and 244:
Proceedings, Western Section, Ameri
- Page 245 and 246:
≤ ≥ Table 1. Description of cow
- Page 247 and 248:
andomly assigned to CO-Synch+CIDR (
- Page 249 and 250:
Johnson, S. K., and R. D. Jones. 20
- Page 251 and 252:
ultrasound examinations of each ova
- Page 253 and 254:
Fernandez, D. L., J. G. Berardinell
- Page 255 and 256:
Statistical analysis Data were anal
- Page 257 and 258:
Proceedings, Western Section, Ameri
- Page 259 and 260:
physical stress on the body and, th
- Page 261 and 262:
Proceedings, Western Section, Ameri
- Page 263 and 264:
hypercortisolism is a characteristi
- Page 265 and 266:
FIG. 3. Mean circulating plasma con
- Page 267 and 268:
synthesise cDNA. The thermocycler p
- Page 269 and 270:
Proceedings, Western Section, Ameri
- Page 271 and 272:
Proportion of cows that were estrua
- Page 273 and 274:
Proceedings, Western Section, Ameri
- Page 275 and 276:
January, and homogenized samples fr
- Page 277 and 278:
exhibit the presence of a corpus lu
- Page 279 and 280:
Even though, mean leptin concentrat
- Page 281 and 282:
Proceedings, Western Section, Ameri
- Page 283 and 284:
2004). The swine catheter was used
- Page 285 and 286:
Proceedings, Western Section, Ameri
- Page 287 and 288:
Table 2. Breed effect on ewe longev
- Page 289 and 290:
the cannula to moderately inflate t
- Page 291 and 292:
PGE1, 8-epi-PGF2 alpha, trichosanth
- Page 293 and 294:
Experiment 2. Forty-two multiparous
- Page 295 and 296:
Table 1. Components of d 7 post-mat
- Page 297 and 298:
Medical Solutions Diagnostics, Los
- Page 299 and 300:
Proceedings, Western Section, Ameri
- Page 301 and 302:
LITERATURE CITED Camacho, L. E., J.
- Page 303 and 304:
Proceedings, Western Section, Ameri
- Page 305 and 306:
lood vessels occur in a physiologic
- Page 307 and 308:
Proceedings, Western Section, Ameri
- Page 309 and 310:
after removal of the P4. This possi
- Page 311 and 312:
Proceedings, Western Section, Ameri
- Page 313 and 314:
Results of this experiment indicate
- Page 315 and 316:
evaporation). The 2 nd component
- Page 317 and 318:
15 ng / mL de Progesterone 12 9 6 3
- Page 319 and 320:
collections were performed and tota
- Page 321 and 322:
Table 2. Effects of corn condensed
- Page 323 and 324:
Proceedings, Western Section, Ameri
- Page 325 and 326:
characteristics of the maize grain
- Page 327 and 328:
Proceedings, Western Sections, Amer
- Page 329 and 330:
lovegrass straw supplemented with d
- Page 331 and 332:
Table 1. Dietary treatments Alfalfa
- Page 333 and 334:
Proceedings, Western Section, Ameri
- Page 335 and 336:
dairy cows experienced a post-partu
- Page 337 and 338:
Proceedings, Western Section, Ameri
- Page 339 and 340:
etention time and the extent of DMD
- Page 341 and 342:
Proceedings, Western Section, Ameri
- Page 343 and 344:
Acknowledgement: Research supported
- Page 345 and 346:
Proceedings, Western Section, Ameri
- Page 347 and 348:
BW was affected by supplementation
- Page 349 and 350:
Proceedings, Western Section, Ameri
- Page 351 and 352:
(NOAA, 2007, 2008; data not shown).
- Page 353 and 354:
Proceedings, Western Section, Ameri
- Page 355 and 356:
particles in the diet (Leonardi and
- Page 357 and 358:
Proceedings, Western Section, Ameri
- Page 359 and 360:
indicative of larger villi that wou
- Page 361 and 362:
Proceedings, Western Section, Ameri
- Page 363 and 364:
treatment, day, and all possible in
- Page 365 and 366:
Table 1. Ingredient composition of
- Page 367 and 368:
dried distiller’s grains (DDGS; D
- Page 369 and 370:
cattle tend to cost 39% more (Ferna
- Page 371 and 372:
Proceedings, Western Section, Ameri
- Page 373 and 374:
and those where WDGS and DDGS were
- Page 375 and 376:
Proceedings, Western Section, Ameri
- Page 377 and 378:
of preconditioning. This outcome is
- Page 379 and 380:
Proceedings, Western Section, Ameri
- Page 381 and 382:
period prior to harvest. Although L
- Page 383 and 384:
Proceedings, Western Section, Ameri
- Page 385 and 386:
Plain, R. 2006. Feeding distiller
- Page 387 and 388:
were maintained on a single, dorman
- Page 389 and 390:
Table 1. Botanical composition of d
- Page 391 and 392:
Leu, L-Val, L-Met, L-His, L-Lys, L-
- Page 393 and 394:
Table 2. Effects of abomasal Trp in
- Page 395 and 396:
Table 1. Experimental supplements c
- Page 397 and 398:
Chen, P. S, T. Y. Toribara and H. W
- Page 399 and 400:
stimulate ad libitum intake and ort
- Page 401 and 402:
Proceedings, Western Section, Ameri
- Page 403 and 404:
Proceedings, Western Section, Ameri
- Page 405 and 406:
concentrate on the nutritive value
- Page 407 and 408:
Results and Discussion Dry matter i
- Page 409 and 410:
Proceedings, Western Section, Ameri
- Page 411 and 412:
Crouse J.D., J. R. Busboom, R. A. F
- Page 413 and 414:
Proceedings, Western Section, Ameri
- Page 415 and 416:
Table 2. Performance of weaned calv
- Page 417 and 418:
important role in enteric methane p
- Page 419 and 420:
Figure 1. Dynamics of rumen oxidati
- Page 421 and 422:
Table 1. Diet composition Item DM b
- Page 423 and 424:
120 +LPS -LPS 10.0 8.0 +LPS -LPS To
- Page 425 and 426:
(EE), respectively. Sunflower oil (
- Page 427 and 428:
Table 4: Fatty acid concentrations
- Page 429 and 430:
Kennely, J.J. 1996. The fatty acid
- Page 431 and 432:
Davis, K. C., 248 Davis, N. E., 372
- Page 433 and 434:
Orosco, G., 409 Ortega, J., 414, 42


