Stress-strain curve of paper revisited - Innventia.com
Stress-strain curve of paper revisited - Innventia.com
Stress-strain curve of paper revisited - Innventia.com

Create successful ePaper yourself
Turn your PDF publications into a flip-book with our unique Google optimized e-Paper software.
PAPER PHYSICS<br />
a)<br />
b)<br />
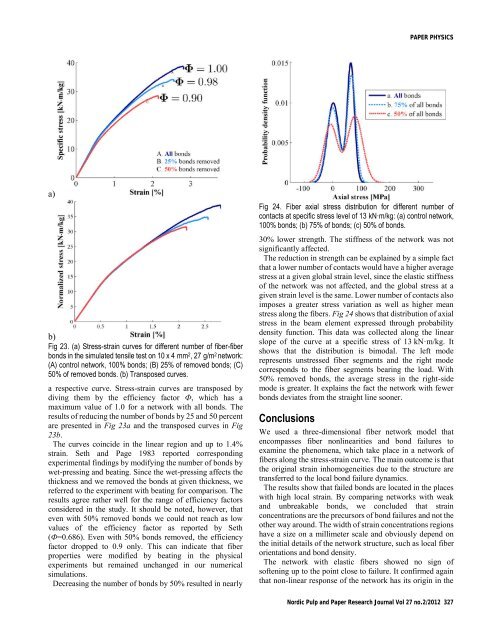
Fig 23. (a) <strong>Stress</strong>-<strong>strain</strong> <strong>curve</strong>s for different number <strong>of</strong> fiber-fiber<br />
bonds in the simulated tensile test on 10 x 4 mm 2 , 27 g/m 2 network:<br />
(A) control network, 100% bonds; (B) 25% <strong>of</strong> removed bonds; (C)<br />
50% <strong>of</strong> removed bonds. (b) Transposed <strong>curve</strong>s.<br />
a respective <strong>curve</strong>. <strong>Stress</strong>-<strong>strain</strong> <strong>curve</strong>s are transposed by<br />
diving them by the efficiency factor Ф, which has a<br />
maximum value <strong>of</strong> 1.0 for a network with all bonds. The<br />
results <strong>of</strong> reducing the number <strong>of</strong> bonds by 25 and 50 percent<br />
are presented in Fig 23a and the transposed <strong>curve</strong>s in Fig<br />
23b.<br />
The <strong>curve</strong>s coincide in the linear region and up to 1.4%<br />
<strong>strain</strong>. Seth and Page 1983 reported corresponding<br />
experimental findings by modifying the number <strong>of</strong> bonds by<br />
wet-pressing and beating. Since the wet-pressing affects the<br />
thickness and we removed the bonds at given thickness, we<br />
referred to the experiment with beating for <strong>com</strong>parison. The<br />
results agree rather well for the range <strong>of</strong> efficiency factors<br />
considered in the study. It should be noted, however, that<br />
even with 50% removed bonds we could not reach as low<br />
values <strong>of</strong> the efficiency factor as reported by Seth<br />
(Ф=0.686). Even with 50% bonds removed, the efficiency<br />
factor dropped to 0.9 only. This can indicate that fiber<br />
properties were modified by beating in the physical<br />
experiments but remained unchanged in our numerical<br />
simulations.<br />
Decreasing the number <strong>of</strong> bonds by 50% resulted in nearly<br />
Fig 24. Fiber axial stress distribution for different number <strong>of</strong><br />
contacts at specific stress level <strong>of</strong> 13 kN·m/kg: (a) control network,<br />
100% bonds; (b) 75% <strong>of</strong> bonds; (c) 50% <strong>of</strong> bonds.<br />
30% lower strength. The stiffness <strong>of</strong> the network was not<br />
significantly affected.<br />
The reduction in strength can be explained by a simple fact<br />
that a lower number <strong>of</strong> contacts would have a higher average<br />
stress at a given global <strong>strain</strong> level, since the elastic stiffness<br />
<strong>of</strong> the network was not affected, and the global stress at a<br />
given <strong>strain</strong> level is the same. Lower number <strong>of</strong> contacts also<br />
imposes a greater stress variation as well as higher mean<br />
stress along the fibers. Fig 24 shows that distribution <strong>of</strong> axial<br />
stress in the beam element expressed through probability<br />
density function. This data was collected along the linear<br />
slope <strong>of</strong> the <strong>curve</strong> at a specific stress <strong>of</strong> 13 kN·m/kg. It<br />
shows that the distribution is bimodal. The left mode<br />
represents unstressed fiber segments and the right mode<br />
corresponds to the fiber segments bearing the load. With<br />
50% removed bonds, the average stress in the right-side<br />
mode is greater. It explains the fact the network with fewer<br />
bonds deviates from the straight line sooner.<br />
Conclusions<br />
We used a three-dimensional fiber network model that<br />
en<strong>com</strong>passes fiber nonlinearities and bond failures to<br />
examine the phenomena, which take place in a network <strong>of</strong><br />
fibers along the stress-<strong>strain</strong> <strong>curve</strong>. The main out<strong>com</strong>e is that<br />
the original <strong>strain</strong> inhomogeneities due to the structure are<br />
transferred to the local bond failure dynamics.<br />
The results show that failed bonds are located in the places<br />
with high local <strong>strain</strong>. By <strong>com</strong>paring networks with weak<br />
and unbreakable bonds, we concluded that <strong>strain</strong><br />
concentrations are the precursors <strong>of</strong> bond failures and not the<br />
other way around. The width <strong>of</strong> <strong>strain</strong> concentrations regions<br />
have a size on a millimeter scale and obviously depend on<br />
the initial details <strong>of</strong> the network structure, such as local fiber<br />
orientations and bond density.<br />
The network with elastic fibers showed no sign <strong>of</strong><br />
s<strong>of</strong>tening up to the point close to failure. It confirmed again<br />
that non-linear response <strong>of</strong> the network has its origin in the<br />
Nordic Pulp and Paper Research Journal Vol 27 no.2/2012 327