Stress-strain curve of paper revisited - Innventia.com
Stress-strain curve of paper revisited - Innventia.com
Stress-strain curve of paper revisited - Innventia.com

Create successful ePaper yourself
Turn your PDF publications into a flip-book with our unique Google optimized e-Paper software.
PAPER PHYSICS<br />
Material and Methods<br />
Network modeling<br />
In our model, we considered a three-dimensional network <strong>of</strong><br />
fibers. The network was created with the help <strong>of</strong> a deposition<br />
technique described elsewhere (Kulachenko and Uesaka<br />
2010). Each fiber is represented as a series <strong>of</strong> Timoshenko<br />
quadratic beam elements with a tubular cross-section. The<br />
beam element has three translational and three rotational<br />
degrees <strong>of</strong> freedom at each node.<br />
The following parameters can be varied during<br />
construction <strong>of</strong> the network: fiber length, width, wall<br />
thickness, curl, basic weight and other material properties <strong>of</strong><br />
fibers. All the listed parameters can vary according to a<br />
specified distribution law.<br />
We accounted for large deflections, rotations and <strong>strain</strong>s.<br />
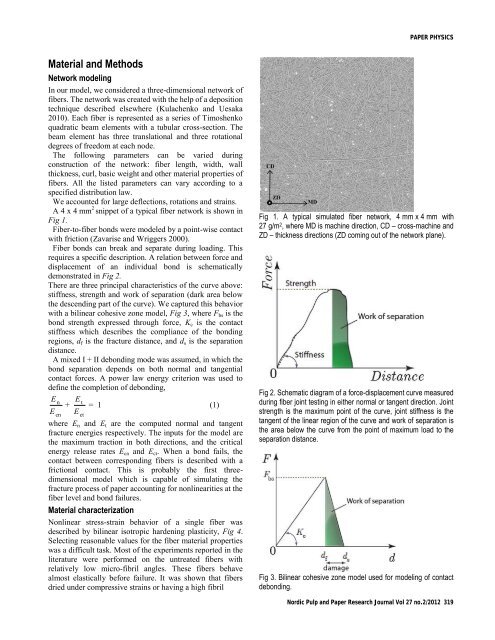
A 4 x 4 mm 2 snippet <strong>of</strong> a typical fiber network is shown in<br />
Fig 1.<br />
Fiber-to-fiber bonds were modeled by a point-wise contact<br />
with friction (Zavarise and Wriggers 2000).<br />
Fiber bonds can break and separate during loading. This<br />
requires a specific description. A relation between force and<br />
displacement <strong>of</strong> an individual bond is schematically<br />
demonstrated in Fig 2.<br />
There are three principal characteristics <strong>of</strong> the <strong>curve</strong> above:<br />
stiffness, strength and work <strong>of</strong> separation (dark area below<br />
the descending part <strong>of</strong> the <strong>curve</strong>). We captured this behavior<br />
with a bilinear cohesive zone model, Fig 3, where F bs is the<br />
bond strength expressed through force, K c is the contact<br />
stiffness which describes the <strong>com</strong>pliance <strong>of</strong> the bonding<br />
regions, d f is the fracture distance, and d s is the separation<br />
distance.<br />
A mixed I + II debonding mode was assumed, in which the<br />
bond separation depends on both normal and tangential<br />
contact forces. A power law energy criterion was used to<br />
define the <strong>com</strong>pletion <strong>of</strong> debonding,<br />
E<br />
E<br />
n<br />
cn<br />
Et<br />
+ = 1<br />
(1)<br />
E<br />
ct<br />
where E n and E t are the <strong>com</strong>puted normal and tangent<br />
fracture energies respectively. The inputs for the model are<br />
the maximum traction in both directions, and the critical<br />
energy release rates E cn and E ct . When a bond fails, the<br />
contact between corresponding fibers is described with a<br />
frictional contact. This is probably the first threedimensional<br />
model which is capable <strong>of</strong> simulating the<br />
fracture process <strong>of</strong> <strong>paper</strong> accounting for nonlinearities at the<br />
fiber level and bond failures.<br />
Material characterization<br />
Nonlinear stress-<strong>strain</strong> behavior <strong>of</strong> a single fiber was<br />
described by bilinear isotropic hardening plasticity, Fig 4.<br />
Selecting reasonable values for the fiber material properties<br />
was a difficult task. Most <strong>of</strong> the experiments reported in the<br />
literature were performed on the untreated fibers with<br />
relatively low micro-fibril angles. These fibers behave<br />
almost elastically before failure. It was shown that fibers<br />
dried under <strong>com</strong>pressive <strong>strain</strong>s or having a high fibril<br />
Fig 1. A typical simulated fiber network, 4 mm x 4 mm with<br />
27 g/m 2 , where MD is machine direction, CD – cross-machine and<br />
ZD – thickness directions (ZD <strong>com</strong>ing out <strong>of</strong> the network plane).<br />
Fig 2. Schematic diagram <strong>of</strong> a force-displacement <strong>curve</strong> measured<br />
during fiber joint testing in either normal or tangent direction. Joint<br />
strength is the maximum point <strong>of</strong> the <strong>curve</strong>, joint stiffness is the<br />
tangent <strong>of</strong> the linear region <strong>of</strong> the <strong>curve</strong> and work <strong>of</strong> separation is<br />
the area below the <strong>curve</strong> from the point <strong>of</strong> maximum load to the<br />
separation distance.<br />
Fig 3. Bilinear cohesive zone model used for modeling <strong>of</strong> contact<br />
debonding.<br />
Nordic Pulp and Paper Research Journal Vol 27 no.2/2012 319