Stress-strain curve of paper revisited - Innventia.com
Stress-strain curve of paper revisited - Innventia.com
Stress-strain curve of paper revisited - Innventia.com

Create successful ePaper yourself
Turn your PDF publications into a flip-book with our unique Google optimized e-Paper software.
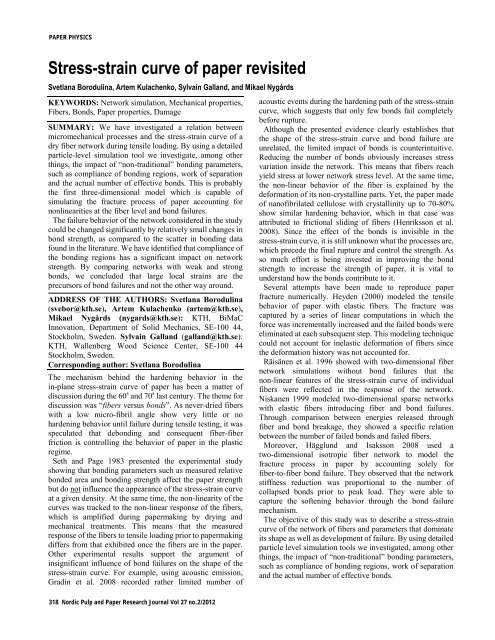
PAPER PHYSICS<br />
<strong>Stress</strong>-<strong>strain</strong> <strong>curve</strong> <strong>of</strong> <strong>paper</strong> <strong>revisited</strong><br />
Svetlana Borodulina, Artem Kulachenko, Sylvain Galland, and Mikael Nygårds<br />
KEYWORDS: Network simulation, Mechanical properties,<br />
Fibers, Bonds, Paper properties, Damage<br />
SUMMARY: We have investigated a relation between<br />
micromechanical processes and the stress-<strong>strain</strong> <strong>curve</strong> <strong>of</strong> a<br />
dry fiber network during tensile loading. By using a detailed<br />
particle-level simulation tool we investigate, among other<br />
things, the impact <strong>of</strong> “non-traditional” bonding parameters,<br />
such as <strong>com</strong>pliance <strong>of</strong> bonding regions, work <strong>of</strong> separation<br />
and the actual number <strong>of</strong> effective bonds. This is probably<br />
the first three-dimensional model which is capable <strong>of</strong><br />
simulating the fracture process <strong>of</strong> <strong>paper</strong> accounting for<br />
nonlinearities at the fiber level and bond failures.<br />
The failure behavior <strong>of</strong> the network considered in the study<br />
could be changed significantly by relatively small changes in<br />
bond strength, as <strong>com</strong>pared to the scatter in bonding data<br />
found in the literature. We have identified that <strong>com</strong>pliance <strong>of</strong><br />
the bonding regions has a significant impact on network<br />
strength. By <strong>com</strong>paring networks with weak and strong<br />
bonds, we concluded that large local <strong>strain</strong>s are the<br />
precursors <strong>of</strong> bond failures and not the other way around.<br />
ADDRESS OF THE AUTHORS: Svetlana Borodulina<br />
(svebor@kth.se), Artem Kulachenko (artem@kth.se),<br />
Mikael Nygårds (nygards@kth.se): KTH, BiMaC<br />
Innovation, Department <strong>of</strong> Solid Mechanics, SE-100 44,<br />
Stockholm, Sweden. Sylvain Galland (galland@kth.se):<br />
KTH, Wallenberg Wood Science Center, SE-100 44<br />
Stockholm, Sweden.<br />
Corresponding author: Svetlana Borodulina<br />
The mechanism behind the hardening behavior in the<br />
in-plane stress-<strong>strain</strong> <strong>curve</strong> <strong>of</strong> <strong>paper</strong> has been a matter <strong>of</strong><br />
discussion during the 60 s and 70 s last century. The theme for<br />
discussion was “fibers versus bonds”. As never-dried fibers<br />
with a low micro-fibril angle show very little or no<br />
hardening behavior until failure during tensile testing, it was<br />
speculated that debonding and consequent fiber-fiber<br />
friction is controlling the behavior <strong>of</strong> <strong>paper</strong> in the plastic<br />
regime.<br />
Seth and Page 1983 presented the experimental study<br />
showing that bonding parameters such as measured relative<br />
bonded area and bonding strength affect the <strong>paper</strong> strength<br />
but do not influence the appearance <strong>of</strong> the stress-<strong>strain</strong> <strong>curve</strong><br />
at a given density. At the same time, the non-linearity <strong>of</strong> the<br />
<strong>curve</strong>s was tracked to the non-linear response <strong>of</strong> the fibers,<br />
which is amplified during <strong>paper</strong>making by drying and<br />
mechanical treatments. This means that the measured<br />
response <strong>of</strong> the fibers to tensile loading prior to <strong>paper</strong>making<br />
differs from that exhibited once the fibers are in the <strong>paper</strong>.<br />
Other experimental results support the argument <strong>of</strong><br />
insignificant influence <strong>of</strong> bond failures on the shape <strong>of</strong> the<br />
stress-<strong>strain</strong> <strong>curve</strong>. For example, using acoustic emission,<br />
Gradin et al. 2008 recorded rather limited number <strong>of</strong><br />
acoustic events during the hardening path <strong>of</strong> the stress-<strong>strain</strong><br />
<strong>curve</strong>, which suggests that only few bonds fail <strong>com</strong>pletely<br />
before rupture.<br />
Although the presented evidence clearly establishes that<br />
the shape <strong>of</strong> the stress-<strong>strain</strong> <strong>curve</strong> and bond failure are<br />
unrelated, the limited impact <strong>of</strong> bonds is counterintuitive.<br />
Reducing the number <strong>of</strong> bonds obviously increases stress<br />
variation inside the network. This means that fibers reach<br />
yield stress at lower network stress level. At the same time,<br />
the non-linear behavior <strong>of</strong> the fiber is explained by the<br />
deformation <strong>of</strong> its non-crystalline parts. Yet, the <strong>paper</strong> made<br />
<strong>of</strong> nan<strong>of</strong>ibrilated cellulose with crystallinity up to 70-80%<br />
show similar hardening behavior, which in that case was<br />
attributed to frictional sliding <strong>of</strong> fibers (Henriksson et al.<br />
2008). Since the effect <strong>of</strong> the bonds is invisible in the<br />
stress-<strong>strain</strong> <strong>curve</strong>, it is still unknown what the processes are,<br />
which precede the final rupture and control the strength. As<br />
so much effort is being invested in improving the bond<br />
strength to increase the strength <strong>of</strong> <strong>paper</strong>, it is vital to<br />
understand how the bonds contribute to it.<br />
Several attempts have been made to reproduce <strong>paper</strong><br />
fracture numerically. Heyden (2000) modeled the tensile<br />
behavior <strong>of</strong> <strong>paper</strong> with elastic fibers. The fracture was<br />
captured by a series <strong>of</strong> linear <strong>com</strong>putations in which the<br />
force was incrementally increased and the failed bonds were<br />
eliminated at each subsequent step. This modeling technique<br />
could not account for inelastic deformation <strong>of</strong> fibers since<br />
the deformation history was not accounted for.<br />
Räisänen et al. 1996 showed with two-dimensional fiber<br />
network simulations without bond failures that the<br />
non-linear features <strong>of</strong> the stress-<strong>strain</strong> <strong>curve</strong> <strong>of</strong> individual<br />
fibers were reflected in the response <strong>of</strong> the network.<br />
Niskanen 1999 modeled two-dimensional sparse networks<br />
with elastic fibers introducing fiber and bond failures.<br />
Through <strong>com</strong>parison between energies released through<br />
fiber and bond breakage, they showed a specific relation<br />
between the number <strong>of</strong> failed bonds and failed fibers.<br />
Moreover, Hägglund and Isaksson 2008 used a<br />
two-dimensional isotropic fiber network to model the<br />
fracture process in <strong>paper</strong> by accounting solely for<br />
fiber-to-fiber bond failure. They observed that the network<br />
stiffness reduction was proportional to the number <strong>of</strong><br />
collapsed bonds prior to peak load. They were able to<br />
capture the s<strong>of</strong>tening behavior through the bond failure<br />
mechanism.<br />
The objective <strong>of</strong> this study was to describe a stress-<strong>strain</strong><br />
<strong>curve</strong> <strong>of</strong> the network <strong>of</strong> fibers and parameters that dominate<br />
its shape as well as development <strong>of</strong> failure. By using detailed<br />
particle level simulation tools we investigated, among other<br />
things, the impact <strong>of</strong> “non-traditional” bonding parameters,<br />
such as <strong>com</strong>pliance <strong>of</strong> bonding regions, work <strong>of</strong> separation<br />
and the actual number <strong>of</strong> effective bonds.<br />
318 Nordic Pulp and Paper Research Journal Vol 27 no.2/2012
PAPER PHYSICS<br />
Material and Methods<br />
Network modeling<br />
In our model, we considered a three-dimensional network <strong>of</strong><br />
fibers. The network was created with the help <strong>of</strong> a deposition<br />
technique described elsewhere (Kulachenko and Uesaka<br />
2010). Each fiber is represented as a series <strong>of</strong> Timoshenko<br />
quadratic beam elements with a tubular cross-section. The<br />
beam element has three translational and three rotational<br />
degrees <strong>of</strong> freedom at each node.<br />
The following parameters can be varied during<br />
construction <strong>of</strong> the network: fiber length, width, wall<br />
thickness, curl, basic weight and other material properties <strong>of</strong><br />
fibers. All the listed parameters can vary according to a<br />
specified distribution law.<br />
We accounted for large deflections, rotations and <strong>strain</strong>s.<br />
A 4 x 4 mm 2 snippet <strong>of</strong> a typical fiber network is shown in<br />
Fig 1.<br />
Fiber-to-fiber bonds were modeled by a point-wise contact<br />
with friction (Zavarise and Wriggers 2000).<br />
Fiber bonds can break and separate during loading. This<br />
requires a specific description. A relation between force and<br />
displacement <strong>of</strong> an individual bond is schematically<br />
demonstrated in Fig 2.<br />
There are three principal characteristics <strong>of</strong> the <strong>curve</strong> above:<br />
stiffness, strength and work <strong>of</strong> separation (dark area below<br />
the descending part <strong>of</strong> the <strong>curve</strong>). We captured this behavior<br />
with a bilinear cohesive zone model, Fig 3, where F bs is the<br />
bond strength expressed through force, K c is the contact<br />
stiffness which describes the <strong>com</strong>pliance <strong>of</strong> the bonding<br />
regions, d f is the fracture distance, and d s is the separation<br />
distance.<br />
A mixed I + II debonding mode was assumed, in which the<br />
bond separation depends on both normal and tangential<br />
contact forces. A power law energy criterion was used to<br />
define the <strong>com</strong>pletion <strong>of</strong> debonding,<br />
E<br />
E<br />
n<br />
cn<br />
Et<br />
+ = 1<br />
(1)<br />
E<br />
ct<br />
where E n and E t are the <strong>com</strong>puted normal and tangent<br />
fracture energies respectively. The inputs for the model are<br />
the maximum traction in both directions, and the critical<br />
energy release rates E cn and E ct . When a bond fails, the<br />
contact between corresponding fibers is described with a<br />
frictional contact. This is probably the first threedimensional<br />
model which is capable <strong>of</strong> simulating the<br />
fracture process <strong>of</strong> <strong>paper</strong> accounting for nonlinearities at the<br />
fiber level and bond failures.<br />
Material characterization<br />
Nonlinear stress-<strong>strain</strong> behavior <strong>of</strong> a single fiber was<br />
described by bilinear isotropic hardening plasticity, Fig 4.<br />
Selecting reasonable values for the fiber material properties<br />
was a difficult task. Most <strong>of</strong> the experiments reported in the<br />
literature were performed on the untreated fibers with<br />
relatively low micro-fibril angles. These fibers behave<br />
almost elastically before failure. It was shown that fibers<br />
dried under <strong>com</strong>pressive <strong>strain</strong>s or having a high fibril<br />
Fig 1. A typical simulated fiber network, 4 mm x 4 mm with<br />
27 g/m 2 , where MD is machine direction, CD – cross-machine and<br />
ZD – thickness directions (ZD <strong>com</strong>ing out <strong>of</strong> the network plane).<br />
Fig 2. Schematic diagram <strong>of</strong> a force-displacement <strong>curve</strong> measured<br />
during fiber joint testing in either normal or tangent direction. Joint<br />
strength is the maximum point <strong>of</strong> the <strong>curve</strong>, joint stiffness is the<br />
tangent <strong>of</strong> the linear region <strong>of</strong> the <strong>curve</strong> and work <strong>of</strong> separation is<br />
the area below the <strong>curve</strong> from the point <strong>of</strong> maximum load to the<br />
separation distance.<br />
Fig 3. Bilinear cohesive zone model used for modeling <strong>of</strong> contact<br />
debonding.<br />
Nordic Pulp and Paper Research Journal Vol 27 no.2/2012 319
PAPER PHYSICS<br />
Fig 4. Bilinear isotropic hardening plasticity fiber material model,<br />
where σy is yield stress, E is Young’s modulus and Etan is tangent<br />
modulus. For numerical values see Table 1.<br />
angles exhibit stronger nonlinear behavior with a distinct<br />
hardening region (Page and El-Hosseiny 1983; Groom et al.<br />
2002). In this respect, drying inside the sheet affects the<br />
fibril angles, reduces the elastic modulus <strong>of</strong> the fiber and<br />
promotes distinct non-linear hardening response through<br />
introducing <strong>com</strong>pressive <strong>strain</strong>s. Fig 5 shows the material<br />
data found in the literature on a fiber dried under<br />
<strong>com</strong>pressive re<strong>strain</strong>t (Seth and Page 1983) and an untreated<br />
fiber (Groom et al. 2002).<br />
These two measurements exemplify probably the upper<br />
and lower bounds for the fiber behavior inside the network.<br />
For our numerical experiments, we assigned the following<br />
average fiber properties, Table 1, which were measured for<br />
the pulp used in the experimental sheets preparation;<br />
described in the next section. The fiber width and length<br />
were varied according to a Gaussian distribution with cut-<strong>of</strong>f<br />
values <strong>of</strong> 6 μm in fiber width and 100 μm in fiber length.<br />
Fiber bonding properties are widely available in the<br />
literature (Lindström 2005). However, it is <strong>of</strong>ten left<br />
unspecified whether normal or shear strength is measured<br />
since a clear distinction is difficult to make in the<br />
experimental analysis. There are at least eight experimental<br />
methods including in-plane, shear, peel or z-directional<br />
loading modes for determination <strong>of</strong> fiber-fiber bond<br />
strengths, which are <strong>of</strong>ten reported in stress units<br />
(Retulainen 1993). There has been a debate about the<br />
relative bonded area, as it is involved in calculations. Based<br />
on the previously published results <strong>of</strong> measured bond<br />
strengths, Joshi 2007 and Batchelor 2010 stated that most <strong>of</strong><br />
the reported shear bond strengths are far too low <strong>com</strong>pared<br />
to reality. However, since we specify the bonding strength in<br />
force units, we stay unaffected by the uncertainty related to<br />
the relative bonded area.<br />
For the reference case, we selected the data for<br />
summerwood fibers (Aulin et al. 2010; Niskanen 1998)<br />
summarized in Table 2.<br />
The friction coefficient which acted between the fibers<br />
after debonding was assumed to be 0.5.<br />
320 Nordic Pulp and Paper Research Journal Vol 27 no.2/2012<br />
Fig 5. <strong>Stress</strong>-<strong>strain</strong> <strong>curve</strong> for a latewood fiber, adopted from Groom<br />
et al. 2002 and for holocellulose summerwood fiber, adopted from<br />
Seth and Page 1983.<br />
Table 1: Fibers properties used during network construction.<br />
Fiber<br />
length<br />
mean±std<br />
[mm]<br />
Fiber width<br />
mean±std<br />
[μm]<br />
Young’s<br />
modulus<br />
[GPa]<br />
Tangent<br />
modulus<br />
[GPa]<br />
3.20±1.38 32.45±2.45 20 10 100<br />
Yield<br />
stress<br />
[MPa]<br />
Table 2 Parameters used for the control case in simulation:<br />
separation distance (SD), bond strength (BS), contact stiffness<br />
(CS).<br />
Norm<br />
BS<br />
[mN]<br />
Tang<br />
BS<br />
[mN]<br />
Norm SD<br />
[μm]<br />
Tang SD<br />
[μm]<br />
Norm<br />
CS<br />
[GPa]<br />
25.5 4.2 0.73 0.60 40 8<br />
Tang<br />
CS<br />
[GPa]<br />
Experimental setup<br />
The purpose <strong>of</strong> the experimental setup was to get a<br />
qualitative <strong>com</strong>parison between the numerical network<br />
model and the physical fiber network. With the help <strong>of</strong> a<br />
sharp die, we extracted and tested small rectangular pieces<br />
from isotropic handsheets made <strong>of</strong> unbleached s<strong>of</strong>twood<br />
sulfate pulp with removed fines. Fines were removed by a<br />
screening technique. Fiber length analysis was performed<br />
prior to fractionation. The measured fiber length distribution<br />
followed a bimodal Gaussian mixture distribution.<br />
Analyzing the mode which corresponds to longer fiber<br />
fraction retained after screening gave the mean fiber length<br />
<strong>of</strong> 3.2 mm with standard deviation <strong>of</strong> 1.38 mm. This fiber<br />
length data was used during numerical network generation.<br />
Laboratory handsheets <strong>of</strong> the specified pulp were prepared<br />
according to ISO 5269/2 using Rapid Köthen sheet former<br />
equipment in a climate-controlled room. Sheets were dried<br />
under re<strong>strain</strong>ts at 93°C in the dryer for 15 minutes. After<br />
preparation, the handsheets were conditioned at 50% RH<br />
and 23 °C until testing.<br />
Tensile tests were performed on a INSTRON ® 5944 system
PAPER PHYSICS<br />
equipped with a 50 N load cell at 1 mm/min loading rate and<br />
at a standard climate 50% RH and 23 °C. We checked for the<br />
presence <strong>of</strong> jaw slip by looking for the traces <strong>of</strong> zigzagging<br />
behavior in the force measurements and concluded that the<br />
jaw slip did not take place during testing.<br />
Digital speckle photography was performed with the<br />
deformation measurement system Vic 2D (LIMESS ® ).<br />
Results and Discussion<br />
Size effects in the physical fiber networks<br />
The size and the basis weight <strong>of</strong> the simulated specimen are<br />
critical for collecting meaningful results and being able to<br />
<strong>com</strong>pute the network on the available <strong>com</strong>puting resources.<br />
With the fiber properties described earlier, we are currently<br />
able to <strong>com</strong>pute the strength <strong>of</strong> dry three-dimensional<br />
networks with a number <strong>of</strong> fibers equivalent to 10x4 mm 2<br />
samples with a basis weight up to 30 g/m 2 . The main<br />
limitation arises from the necessity to have a fine mesh along<br />
the fibers to achieve convergence with respect to mesh<br />
density.<br />
In order to assess the implication <strong>of</strong> <strong>com</strong>putational<br />
limitations on the planned analyses, we investigated how the<br />
size <strong>of</strong> the specimen influences the average values <strong>of</strong><br />
network stiffness and strength on a limited set <strong>of</strong> networks.<br />
We do not draw any conclusions from the experimental data<br />
alone.<br />
Fig 6-Fig 8 show the stress-<strong>strain</strong> <strong>curve</strong>s recorded in<br />
tensile tests experimentally. Tensile force was applied in the<br />
length (longest) direction <strong>of</strong> <strong>paper</strong> sample in Fig 9. Fig 6<br />
shows that 4x4 mm 2 networks have somewhat lower elastic<br />
modulus than 10x4 mm 2 networks, presumably because the<br />
sample cutting procedure reducing the average length <strong>of</strong> the<br />
fibers and the effect <strong>of</strong> boundary conditions. Shorter network<br />
had a long s<strong>of</strong>tening region which can be explained by the<br />
fact that few long fibers can extend from one con<strong>strain</strong>ed end<br />
<strong>of</strong> the network to another and being stretched even after<br />
losing all the contacts.<br />
At the same time, increasing the width from the chosen<br />
reference level <strong>of</strong> 10x4 mm 2 to 10x10 mm 2 did not affect the<br />
stiffness but increased the strength and <strong>strain</strong> to failure, Fig<br />
7.<br />
Finally, increasing the basis weight did not change the<br />
tensile stiffness index and tensile index significantly, but<br />
increased the <strong>strain</strong> to failure, Fig 8.<br />
From these experiments, we can that the size <strong>of</strong> 10x4 mm 2 ,<br />
27 g/m 2 is sufficiently large and thick in the view <strong>of</strong><br />
representing elastic properties and the overall shape <strong>of</strong> the<br />
stress-<strong>strain</strong> <strong>curve</strong>.<br />
Evolution <strong>of</strong> damage. Experiments.<br />
A stress-<strong>strain</strong> <strong>curve</strong> provide limited information even for<br />
alitative <strong>com</strong>parison with simulation. In order to extract<br />
more data, we observed the evolution <strong>of</strong> the <strong>strain</strong> field in the<br />
physical specimen with the help <strong>of</strong> the digital speckle<br />
photography. There was no need to apply a speckle pattern<br />
onto the network as the fibers themselves created a sufficient<br />
Fig 6. Experimental results from the tensile test. Effect <strong>of</strong> increased<br />
sample length for laboratory handsheets (27 g/m 2 ).<br />
Fig 7. Experimental results from the tensile test. Effect <strong>of</strong> increase<br />
in sample width for laboratory handsheets (27 g/m 2 ).<br />
Fig 8. Experimental results from the tensile test. Effect <strong>of</strong> increased<br />
grammage for 10x4 mm 2 laboratory handsheets (27 g/m 2 ).<br />
Nordic Pulp and Paper Research Journal Vol 27 no.2/2012 321
PAPER PHYSICS<br />
a)<br />
a)<br />
b)<br />
Fig 9. Tensile test on 10 x 4 mm 2 samples, cut from laboratory<br />
handsheets (27 g/m 2 ). (a) Initial state prior to loading and loading<br />
direction. (b) Post-failure localization.<br />
b)<br />
c)<br />
d)<br />
Fig 10. <strong>Stress</strong>-<strong>strain</strong> <strong>curve</strong> from the tensile test on 10 x 4 mm 2 , 27<br />
g/m 2 sample. The points a to e correspond to instances <strong>of</strong> <strong>strain</strong><br />
field measurement (Fig 11a to Fig 11e).<br />
contrast pattern for analyses. Fig 9 shows the initial state <strong>of</strong><br />
the physical network and the post-failure damage<br />
localization, which was on a millimeter length-scale. In all<br />
the observed samples, damage localization occurred at an<br />
angle to the direction <strong>of</strong> loading typical for semi-ductile<br />
behavior with shear-band formation. Since dry <strong>paper</strong> usually<br />
fails more abruptly, it also suggests that the handsheets did<br />
not have a sufficient level <strong>of</strong> interfiber bonding due to<br />
relatively low pressure applied during sheet making.<br />
Fig 9b shows the localization path at the network<br />
separation point. The localization path is not clearly visible<br />
before that moment. At the separation point, the measured<br />
force is already zero and there are some considerable<br />
out-<strong>of</strong>-plane deformations.<br />
By analyzing Fig 10 and Fig 11, we can conclude that<br />
nucleation <strong>of</strong> damages, manifested through increased local<br />
<strong>strain</strong> on the millimeter scale, which develops already during<br />
the hardening region. In this particular sample, there are two<br />
“<strong>com</strong>peting” localization regions <strong>of</strong> which only one will be<br />
preferred for the final rupture already along the s<strong>of</strong>tening<br />
part <strong>of</strong> the <strong>curve</strong>.<br />
322 Nordic Pulp and Paper Research Journal Vol 27 no.2/2012<br />
e)<br />
Fig 11. Digital speckle photography results. Development <strong>of</strong><br />
fracture during tensile test on 10 x 4 mm 2 , 27 g/m 2 sample. The<br />
color bar indicates local in-plane <strong>strain</strong>s in tension direction with<br />
range from 0 to 2%.<br />
Evolution <strong>of</strong> damage. Simulations.<br />
We used the acquired fiber length distribution data to create<br />
an isotropic fiber network numerically. Table 1 and Table 2<br />
summarize the fiber and bonding data used in the reference<br />
(control) numerical experiment. During fiber deposition, we<br />
assumed the maximum level <strong>of</strong> conformability, which gave<br />
us an average number <strong>of</strong> contacts per fiber <strong>of</strong> 156. This<br />
number corresponds to a distance between the bonds <strong>of</strong><br />
21 µm, which is <strong>com</strong>parable to the average diameter <strong>of</strong>
PAPER PHYSICS<br />
Fig 12. Comparison <strong>of</strong> the experimental and simulated results from<br />
the tensile test on 10 x 4 mm 2 , 27 g/m 2 sample.<br />
fibers and agrees with the prediction by Alava and Niskanen<br />
2006. Fibers not connected to the network were removed<br />
during <strong>com</strong>putations.<br />
We performed numerical simulations until the stress-<strong>strain</strong><br />
<strong>curve</strong>s showed the persistent signs <strong>of</strong> s<strong>of</strong>tening. Capturing<br />
the entire s<strong>of</strong>tening part <strong>of</strong> the <strong>curve</strong> would require a fine<br />
time-step and consume a significant amount <strong>of</strong> <strong>com</strong>putation<br />
time without providing much additional information.<br />
Fig 12 shows the <strong>com</strong>parison <strong>of</strong> the <strong>com</strong>puted stress-<strong>strain</strong><br />
<strong>curve</strong> with the experimental ones. Although the initial part <strong>of</strong><br />
the <strong>curve</strong> was captured, the strength and the hardening<br />
regions were not. The fact that the strength was considerably<br />
overestimated can be attributed to an overestimated number<br />
<strong>of</strong> contacts or other contact parameters. We have<br />
investigated these factors on the very same network and<br />
mesh in order to exclude the influence <strong>of</strong> the variations due<br />
to disordered network structure.<br />
Effect <strong>of</strong> the bond strength<br />
We considered four cases: (a) bond failure with the reference<br />
bond strength “Control”; (b) with the reference bond<br />
strength divided by 3 “Weak”; (c) with the reference bond<br />
strength multiplied by a factor <strong>of</strong> 5/3 “Strong”, as defined in<br />
Table 3; (d) no bond failure “No debonding”. The<br />
separations distance was 15% longer than the fracture<br />
distance in all the cases.<br />
Fig 13 shows the stress-<strong>strain</strong> <strong>curve</strong>s for different bond<br />
strengths. The appearance <strong>of</strong> the <strong>curve</strong>s is similar to the<br />
results <strong>of</strong> Seth and Page 1983, who varied the bonding<br />
strength by addition <strong>of</strong> bonding agents – the networks show<br />
identical response until the point close to failure. The higher<br />
the bond strength is, the longer the <strong>curve</strong> follows the case<br />
Table 3 Different bond strengths used in parametric study.<br />
Bond strength (BS)<br />
Normal BS Tangent<br />
[mN]<br />
[mN]<br />
Strong 42.5 7<br />
Control 25.5 4.2<br />
Weak 8.5 1.4<br />
BS<br />
Fig 13. <strong>Stress</strong>-<strong>strain</strong> <strong>curve</strong>s for different bond strengths from the<br />
simulated tensile test on 10 x 4 mm 2 , 27 g/m 2 network.<br />
with no bond failure. Remarkably, a factor <strong>of</strong> 3 in bond<br />
strength, which is lower than the variation found in the<br />
literature (partially with data reported in stress units),<br />
changed the strength <strong>of</strong> the network dramatically with a<br />
given bond <strong>com</strong>pliance and relation between fracture and<br />
separation distances.<br />
The intensity <strong>of</strong> damage can be related to the number <strong>of</strong><br />
broken bonds. Using acoustic emission, Gradin et al. 2008<br />
showed that during the elastic deformation <strong>of</strong> <strong>paper</strong> only a<br />
very limited number <strong>of</strong> acoustic events was registered. It<br />
remained unclear, however, whether all the fiber bond<br />
breakage could be detected with the utilized equipment,<br />
since some <strong>of</strong> the broken bonds could not emit sufficient<br />
amount <strong>of</strong> energy at failure to be registered. For example,<br />
similar acoustic emission testing applied to cellulose<br />
nano<strong>paper</strong> by Henriksson et al. 2008 showed only very few<br />
events registered until the rupture.<br />
By observing the number <strong>of</strong> bonds failed in the network,<br />
Fig 14, we can conclude that the growth rate in the number<br />
<strong>of</strong> contacts follows an exponential law. At the same time,<br />
relatively few bonds, namely, 3% <strong>of</strong> the total number, failed<br />
<strong>com</strong>pletely in the network with strong bonds before the<br />
catastrophic failure. Although more contacts failed in the<br />
network with weaker bonds, the total number <strong>of</strong> them stayed<br />
below 5%. By observing the difference between the number<br />
<strong>of</strong> fractured and fully separated bonds at a given substep, Fig<br />
14, we can conclude that there is no observable delay<br />
between the damage and <strong>com</strong>plete separation <strong>of</strong> the bonds<br />
(dashed and solid lines almost coincide).<br />
Let us now examine the processes on the network level<br />
which preceded the failure and <strong>com</strong>pare to what was<br />
measured in the experiments. We looked first how the failed<br />
bonds were distributed in the network. Fig 15a shows initial<br />
contact positions in the network while Fig 15b and Fig 15c<br />
show the fractured bonds at the time <strong>of</strong> onset <strong>of</strong> s<strong>of</strong>tening.<br />
The color scale indicates the state <strong>of</strong> damage where 0<br />
corresponds to undamaged state and 1 to separated state<br />
according to Fig 3. Only the bonds having some degree <strong>of</strong><br />
Nordic Pulp and Paper Research Journal Vol 27 no.2/2012 323
PAPER PHYSICS<br />
damage were plotted.<br />
towards the end. It demonstrates again that the hardening<br />
a)<br />
b)<br />
Fig 14. Total amount <strong>of</strong> fractured (solid line) and separated (dashed<br />
line) bonds for networks with different bond strengths: (a) Control,<br />
(b) Weak and (c) Strong bonds.<br />
Although the stronger network has fewer failed bonds, the<br />
failure pattern remains similar. There is a clear localization<br />
zone which indicates the failure path. The fibers which were<br />
pulled out were clearly indicated by the continual chain <strong>of</strong><br />
separated contacts.<br />
Fig 16 shows the <strong>strain</strong> fields in the direction <strong>of</strong> loading. It<br />
was calculated as a continuous field after mapping the<br />
displacement field onto a 2D mesh. The calculated <strong>strain</strong>s<br />
fields agree well with the measured <strong>strain</strong> fields, Fig 11, in<br />
terms <strong>of</strong> size and magnitude <strong>of</strong> variations.<br />
The <strong>strain</strong> field in the Fig 16a was output when the network<br />
with weak bonds reached the maximum stress, that is,<br />
around 0.7% <strong>strain</strong>. Fig 16b shows the <strong>strain</strong> field in the<br />
network with no debonding also at 0.7% <strong>strain</strong>. Apart from<br />
greater <strong>strain</strong> variations in the network with weaker bonds,<br />
both <strong>strain</strong> fields have similar features. The locations <strong>of</strong><br />
maximum <strong>strain</strong>s were the same for both cases. At the same<br />
time, the locations <strong>of</strong> the separated bonds, Fig 15b,<br />
correlated with the areas where the local <strong>strain</strong>s were larger,<br />
Fig 16a. This means that the bond failures are largely<br />
affected by the local <strong>strain</strong>s and not the other way around. In<br />
other words, large local <strong>strain</strong>s are the precursors <strong>of</strong> bond<br />
failures. The local <strong>strain</strong> variations depend, in their turn, on<br />
the initial details <strong>of</strong> the network structure, such as local fiber<br />
orientations, number <strong>of</strong> bonds and density. This is different<br />
from wet networks, where <strong>strain</strong> variations are largely<br />
affected by the stick-slip behavior <strong>of</strong> the bonds.<br />
Effect <strong>of</strong> plasticity<br />
We investigated how plasticity on the fiber level affects the<br />
stress <strong>strain</strong> <strong>curve</strong> and micromechanical processes during<br />
<strong>strain</strong>ing. We <strong>com</strong>pared the simulation with and without<br />
invoking bilinear plasticity for the fibers.<br />
Fig 17 shows that the network with elastic fibers follows a<br />
straight line up until the failure showing some deviation<br />
324 Nordic Pulp and Paper Research Journal Vol 27 no.2/2012<br />
c)<br />
Fig 15. (a) The initial contact positions prior to loading. Total<br />
number <strong>of</strong> contacts at different levels <strong>of</strong> fracture, represented by<br />
the contour legend, where 0 and 1 corresponds to reaching fracture<br />
and separation distances respectively: (b) weak bonds; (c) strong<br />
bonds.<br />
a)<br />
b)<br />
Fig 16. Strain field in the network with (a) weak bonds prior to<br />
failure at a global <strong>strain</strong> <strong>of</strong> 0.7%, (b) no debonding at a global <strong>strain</strong><br />
<strong>of</strong> 0.7%.<br />
behavior <strong>of</strong> the network is mainly controlled by the fibers<br />
and not by the bonds. Interestingly, the strength <strong>of</strong> these two<br />
networks was almost identical.<br />
Assigning a linear elastic material model for fibers resulted<br />
in almost 20% fewer fiber-fiber bonds <strong>com</strong>pletely separated<br />
prior to network rupture <strong>com</strong>pared to the case when a plastic<br />
behavior <strong>of</strong> fibers was assumed, Fig 18.<br />
This can be explained by the fact that a network consisting<br />
<strong>of</strong> elastic fibers sustains sharper <strong>strain</strong> variations as the
PAPER PHYSICS<br />
energy cannot dissipate in highly <strong>strain</strong>ed areas by other<br />
contribute to the response <strong>of</strong> a dry network.<br />
a)<br />
Fig 17. <strong>Stress</strong>-<strong>strain</strong> <strong>curve</strong>s for different fiber material models<br />
utilized on fiber level in 10 x 4 mm 2 , 27 g/m 2 network: (a) bilinear<br />
isotropic hardening plasticity; (b) linear elastic fiber material model.<br />
b)<br />
Fig 19.Normalized <strong>strain</strong> in the network with: (a) linear elastic; (b)<br />
bilinear isotropic hardening plasticity fiber material model at<br />
network fracture.<br />
a)<br />
Fig 18. Total amount <strong>of</strong> fractured (solid line) and separated (dashed<br />
line) bonds for networks with different fiber material models: (a)<br />
bilinear isotropic hardening plasticity; (b) linear elastic fiber material<br />
model.<br />
means than bond failure. The <strong>strain</strong> variations can be<br />
observed in Fig 19a, in which we plot the <strong>strain</strong> fields at the<br />
moment <strong>of</strong> failure normalized with the global <strong>strain</strong> to<br />
failure recorded at this point.<br />
It is also reflected in the map <strong>of</strong> the failed bonds, Fig 20,<br />
which shows more clustered concentrations <strong>of</strong> bond failures<br />
in the elastic fiber networks.<br />
Note on the effect <strong>of</strong> friction<br />
Numerical experiments showed that friction coefficient<br />
varied in a reasonable range had virtually no effect on either<br />
stress-<strong>strain</strong> <strong>curve</strong> or strength. The observed frictional forces<br />
were two orders <strong>of</strong> magnitude lower than the forces<br />
developed in the bonds and thus could not significantly<br />
b)<br />
Fig 20. Total number <strong>of</strong> contacts at different levels <strong>of</strong> fracture,<br />
represented by the contour legend, where 0 and 1 corresponds to<br />
reaching fracture and separation distances respectively: (a) linear<br />
elastic; (b) bilinear isotropic hardening plasticity fiber material<br />
model.<br />
The role <strong>of</strong> unconventional contact parameters<br />
As mentioned earlier, the bond strength is one <strong>of</strong> three<br />
parameters characterizing a bond failure under the adopted<br />
bilinear cohesive zone model. Measuring the two remaining<br />
properties, namely, the <strong>com</strong>pliance <strong>of</strong> bond regions and the<br />
work <strong>of</strong> separation have not been possible with reported<br />
techniques. During experiments, the fiber-fiber bonds were<br />
not isolated, and the measured force en<strong>com</strong>passed the<br />
response from both the bonds and from global deformation<br />
<strong>of</strong> the fibers.<br />
We look at the effect <strong>of</strong> the bond <strong>com</strong>pliance and the work<br />
<strong>of</strong> separation on the stress-<strong>strain</strong> <strong>curve</strong> with the help <strong>of</strong><br />
modeling on a single realization <strong>of</strong> the network.<br />
Nordic Pulp and Paper Research Journal Vol 27 no.2/2012 325
PAPER PHYSICS<br />
Effect <strong>of</strong> <strong>com</strong>pliance <strong>of</strong> contact regions<br />
Beam elements that we use to represent the fibers have no<br />
through-thickness normal <strong>strain</strong>s, which makes their<br />
cross-section rigid against the load in the normal direction.<br />
In reality, the fibers deform locally due to reciprocal forces<br />
in the bond regions. We express the <strong>com</strong>pliance <strong>of</strong> the bond<br />
regions through the contact stiffness, which is usually a<br />
numerical parameter in a penalty-based contact algorithm. In<br />
our case, when the cross-sections <strong>of</strong> the fibers are rigid<br />
against point-wise loads, the contact stiffness alone is<br />
appropriate enough to represent the <strong>com</strong>pliance <strong>of</strong> the<br />
bonding regions. Considering its influence in the frames <strong>of</strong><br />
the cohesive zone model, it is nothing but the slope <strong>of</strong> the<br />
elastic region in Fig 3. Consequently, with a given bond<br />
strength, the bond with a lower stiffness can accumulate<br />
greater critical fracture energy (the area under the <strong>curve</strong> up<br />
to the fracture distance).<br />
We varied the contact stiffness in the normal and tangent<br />
directions according to Table 4.<br />
<strong>Stress</strong>-<strong>strain</strong> <strong>curve</strong>s plotted for these cases (Fig 21) show<br />
that the bond <strong>com</strong>pliance has a very limited effect on the<br />
elastic part <strong>of</strong> the <strong>curve</strong>. Decreasing the bond stiffness in<br />
both directions by a factor <strong>of</strong> two did not change the initial<br />
slope <strong>of</strong> the <strong>curve</strong> simply because the amount <strong>of</strong> elastic<br />
energy stored in the bonds is relatively small. Having s<strong>of</strong>ter<br />
bond regions delays, however, the point <strong>of</strong> failure. On the<br />
contrary, the stiffer the bond regions the lower the strength,<br />
which together with the results on the impact <strong>of</strong> bond<br />
strength means that the critical fraction energy accounting<br />
for both the strength and <strong>com</strong>pliance is a better measure for<br />
relating the bonds and network strength properties.<br />
Effect <strong>of</strong> work <strong>of</strong> separation<br />
The work <strong>of</strong> separation is the amount <strong>of</strong> energy needed to<br />
separate <strong>com</strong>pletely the bond from the point <strong>of</strong> fracture. In<br />
practice this means creating a delay between failure and full<br />
separation in a displacement-controlled test <strong>of</strong> individual<br />
bonds. We varied the separation distance, Fig 22, according<br />
to Table 5 leaving bond strength and contact stiffness intact.<br />
The work <strong>of</strong> separation was set to be 15 percent <strong>of</strong> the<br />
fracture energy in the reference and was changed to 5 and 25<br />
percents in two selected cases.<br />
Fig 22 shows that the work <strong>of</strong> separation varied in a<br />
reasonable range has an expected but rather limited effect on<br />
the strength <strong>of</strong> the fiber network. Increasing the work <strong>of</strong><br />
separation from 5 to 25 percents <strong>of</strong> the critical fracture<br />
energy increased the strength by about 12 percent.<br />
Effect <strong>of</strong> the number <strong>of</strong> bonds<br />
The number <strong>of</strong> bonds in the network can be related to a<br />
<strong>com</strong>monly used term “the level <strong>of</strong> interfiber bonding”. The<br />
latter is usually changed by wet pressing or beating. In<br />
numerical simulations, we reduced the number <strong>of</strong> bonds by<br />
randomly removing contacts all over the network.<br />
Along with the stress-<strong>strain</strong> <strong>curve</strong>s, we <strong>com</strong>puted the<br />
efficiency factors introduced by Seth and Page 1983. The<br />
efficiency factor Ф is the ratio <strong>of</strong> the initial Young’s<br />
modulus (for all bonds) to the current Young’s modulus for<br />
Fig 21. <strong>Stress</strong>-<strong>strain</strong> <strong>curve</strong>s for different bonding <strong>com</strong>pliance in 10 x<br />
4 mm 2 , 27 g/m 2 network: (a) control <strong>com</strong>pliance; (b) s<strong>of</strong>ter bond<br />
regions; (c) stiffer bond regions.<br />
Fig 22. <strong>Stress</strong>-<strong>strain</strong> <strong>curve</strong>s for different separation distance the<br />
simulated tensile test on 10 x 4 mm 2 , 27 g/m 2 network at normal<br />
25.5 mN and tangent 4.2 mN bond strength kept constant: (a)<br />
reference case; (b) minimized; (c) maximized separation distance<br />
(see Table 5).<br />
Table 4. Varying contact stiffness (CS) in the numerical tests.<br />
Contact stiffness Normal CS Tangent CS<br />
(CS)<br />
[GPa]<br />
[GPa]<br />
S<strong>of</strong>t bonds 20 4<br />
Control 40 8<br />
Stiff bonds 80 16<br />
Table 5 Effect <strong>of</strong> varying separation distances (SD) keeping bond<br />
strength constant (25.5 mN in the normal and 4.2 mN in the<br />
tangent directions).<br />
Separation distance (SD)<br />
Normal SD Tangent SD<br />
[μm]<br />
[μm]<br />
a (reference) 0.73 0.60<br />
b 0.67 0.55<br />
c 0.80 0.66<br />
326 Nordic Pulp and Paper Research Journal Vol 27 no.2/2012
PAPER PHYSICS<br />
a)<br />
b)<br />
Fig 23. (a) <strong>Stress</strong>-<strong>strain</strong> <strong>curve</strong>s for different number <strong>of</strong> fiber-fiber<br />
bonds in the simulated tensile test on 10 x 4 mm 2 , 27 g/m 2 network:<br />
(A) control network, 100% bonds; (B) 25% <strong>of</strong> removed bonds; (C)<br />
50% <strong>of</strong> removed bonds. (b) Transposed <strong>curve</strong>s.<br />
a respective <strong>curve</strong>. <strong>Stress</strong>-<strong>strain</strong> <strong>curve</strong>s are transposed by<br />
diving them by the efficiency factor Ф, which has a<br />
maximum value <strong>of</strong> 1.0 for a network with all bonds. The<br />
results <strong>of</strong> reducing the number <strong>of</strong> bonds by 25 and 50 percent<br />
are presented in Fig 23a and the transposed <strong>curve</strong>s in Fig<br />
23b.<br />
The <strong>curve</strong>s coincide in the linear region and up to 1.4%<br />
<strong>strain</strong>. Seth and Page 1983 reported corresponding<br />
experimental findings by modifying the number <strong>of</strong> bonds by<br />
wet-pressing and beating. Since the wet-pressing affects the<br />
thickness and we removed the bonds at given thickness, we<br />
referred to the experiment with beating for <strong>com</strong>parison. The<br />
results agree rather well for the range <strong>of</strong> efficiency factors<br />
considered in the study. It should be noted, however, that<br />
even with 50% removed bonds we could not reach as low<br />
values <strong>of</strong> the efficiency factor as reported by Seth<br />
(Ф=0.686). Even with 50% bonds removed, the efficiency<br />
factor dropped to 0.9 only. This can indicate that fiber<br />
properties were modified by beating in the physical<br />
experiments but remained unchanged in our numerical<br />
simulations.<br />
Decreasing the number <strong>of</strong> bonds by 50% resulted in nearly<br />
Fig 24. Fiber axial stress distribution for different number <strong>of</strong><br />
contacts at specific stress level <strong>of</strong> 13 kN·m/kg: (a) control network,<br />
100% bonds; (b) 75% <strong>of</strong> bonds; (c) 50% <strong>of</strong> bonds.<br />
30% lower strength. The stiffness <strong>of</strong> the network was not<br />
significantly affected.<br />
The reduction in strength can be explained by a simple fact<br />
that a lower number <strong>of</strong> contacts would have a higher average<br />
stress at a given global <strong>strain</strong> level, since the elastic stiffness<br />
<strong>of</strong> the network was not affected, and the global stress at a<br />
given <strong>strain</strong> level is the same. Lower number <strong>of</strong> contacts also<br />
imposes a greater stress variation as well as higher mean<br />
stress along the fibers. Fig 24 shows that distribution <strong>of</strong> axial<br />
stress in the beam element expressed through probability<br />
density function. This data was collected along the linear<br />
slope <strong>of</strong> the <strong>curve</strong> at a specific stress <strong>of</strong> 13 kN·m/kg. It<br />
shows that the distribution is bimodal. The left mode<br />
represents unstressed fiber segments and the right mode<br />
corresponds to the fiber segments bearing the load. With<br />
50% removed bonds, the average stress in the right-side<br />
mode is greater. It explains the fact the network with fewer<br />
bonds deviates from the straight line sooner.<br />
Conclusions<br />
We used a three-dimensional fiber network model that<br />
en<strong>com</strong>passes fiber nonlinearities and bond failures to<br />
examine the phenomena, which take place in a network <strong>of</strong><br />
fibers along the stress-<strong>strain</strong> <strong>curve</strong>. The main out<strong>com</strong>e is that<br />
the original <strong>strain</strong> inhomogeneities due to the structure are<br />
transferred to the local bond failure dynamics.<br />
The results show that failed bonds are located in the places<br />
with high local <strong>strain</strong>. By <strong>com</strong>paring networks with weak<br />
and unbreakable bonds, we concluded that <strong>strain</strong><br />
concentrations are the precursors <strong>of</strong> bond failures and not the<br />
other way around. The width <strong>of</strong> <strong>strain</strong> concentrations regions<br />
have a size on a millimeter scale and obviously depend on<br />
the initial details <strong>of</strong> the network structure, such as local fiber<br />
orientations and bond density.<br />
The network with elastic fibers showed no sign <strong>of</strong><br />
s<strong>of</strong>tening up to the point close to failure. It confirmed again<br />
that non-linear response <strong>of</strong> the network has its origin in the<br />
Nordic Pulp and Paper Research Journal Vol 27 no.2/2012 327
PAPER PHYSICS<br />
fibers. Plasticity on the fiber level reduced the <strong>strain</strong><br />
variations since the energy dissipated through plastic<br />
deformations in the areas <strong>of</strong> high <strong>strain</strong>.<br />
The influence <strong>of</strong> the bond strength was significant. A factor<br />
<strong>of</strong> 2-3 in bond strength, which is relatively low in the view <strong>of</strong><br />
the scatter encountered throughout the literature, changed<br />
the strength <strong>of</strong> the network dramatically. At the same time, a<br />
"non-traditional" bonding parameter, namely, the<br />
<strong>com</strong>pliance <strong>of</strong> the bond regions showed a <strong>com</strong>parably strong<br />
effect on the strength as the bond strength. More <strong>com</strong>pliant<br />
bond regions increase the strength by accumulating more<br />
energy prior to failure. This suggests that the critical fracture<br />
energy, which account for both the strength and <strong>com</strong>pliance<br />
<strong>of</strong> the bonds, is a better measure for relating bond and<br />
network strength. The work <strong>of</strong> separation (another<br />
unconventional bonding property) showed a relatively small<br />
impact on the stress-<strong>strain</strong> <strong>curve</strong> and can be discarded in<br />
practical applications.<br />
Decreasing the number <strong>of</strong> bonds in the network by 50%,<br />
did not change the elastic stiffness significantly but<br />
decreased the strength. It also increased stress variation<br />
inside the network as well as the mean axial stress in the<br />
load-bearing fiber segments.<br />
Acknowledgement<br />
The authors appreciate WoodWisdom-NET and BiMaC Innovation<br />
together with their industrial partners for the financial support.<br />
Literature<br />
Alava, M. and Niskanen, K. (2006): The physics <strong>of</strong> <strong>paper</strong>, Reports<br />
on Progress in Physics 69(3), 669-723.<br />
Aulin, C., Gällstedt, M. and Lindström, T. (2010): Oxygen and oil<br />
barrier properties <strong>of</strong> micr<strong>of</strong>ibrillated cellulose films and coatings,<br />
Cellulose 17(3), 559-574.<br />
Batchelor, W. (2010): Application <strong>of</strong> an analitical method to<br />
calculate the load distribution along a fibre in a loaded fibre<br />
network, Appita Journal 63(4), 287-293.<br />
Gradin, P., Graham, D., Nygård, P. and Vallen, H. (2008): The<br />
Use <strong>of</strong> Acoustic Emission Monitoring to Rank Paper Materials with<br />
Respect to Their Fracture Toughness, Experimental Mechanics<br />
48(1), 133-137.<br />
Groom, L., Mott, L. and Shaler, S. (2002): Mechanical properties<br />
<strong>of</strong> individual southern pine fibres. Part I. Determination and<br />
variability <strong>of</strong> stress-<strong>strain</strong> <strong>curve</strong>s with respect to tree height and<br />
juvenility, Wood and Fibre Science 34(1), 14-27.<br />
Henriksson, M., Berglund, L. A., Isaksson, P., Lindström, T.<br />
and Nishino, T. (2008): Cellulose Nano<strong>paper</strong> Structures <strong>of</strong> High<br />
Toughness, Biomacromolecules 9(6), 1579-1585.<br />
Heyden, S. (2000): Network Modelling for the Evaluation <strong>of</strong><br />
Mechanical Properties <strong>of</strong> Cellulose Fluff, Lund University, Lund.<br />
Hägglund, R. and Isaksson, P. (2008): On the coupling between<br />
macroscopic material degradation and interfiber bond fracture in an<br />
idealized fiber network, International journal <strong>of</strong> solids and<br />
structures 45, 868-878.<br />
Joshi, K., Batchelor, W., Parker, I., Nguyen, L. (2007): A new<br />
method for shear bond strength measurement, International Paper<br />
Physics conference, Queensland, Australia, pp. 7-13.<br />
Kulachenko, A. and Uesaka, T. (2010): Simulation <strong>of</strong> Wet Fiber<br />
Network Deformation, Progress in Paper Physics, Montreal,<br />
Canada.<br />
Lindström, T., Wågberg, L., Larsson, T. (2005): On the nature<br />
Advances in Paper Science and Technology, Cambridge, The Pulp<br />
and Paper Fundamental Research Society, pp. 457-562.<br />
Niskanen, K. (1998): Paper Physics, Fapet Oy.<br />
Niskanen, K. J., Alava, M.J., Seppäla, E.T., Åström, J. (1999):<br />
Fracture Energy in Fibre and Bond Failure, Journal <strong>of</strong> Pulp and<br />
Paper Scince 25(5), 167-169.<br />
Page, D. H. and El-Hosseiny, F. (1983): The mechanical<br />
properties <strong>of</strong> single wood pulp fibers. Part IV. Fibril angle and the<br />
shape <strong>of</strong> the stress-<strong>strain</strong> <strong>curve</strong>, Journal <strong>of</strong> Pulp and Paper 9(4),<br />
99-100.<br />
Retulainen, E., Ebeling, K. (1993): Fibre-fibre bonding and ways<br />
<strong>of</strong> characterizing bond strength, Appita Journal 46(4), 282-288.<br />
Räisänen, V. I., Alava, M. J., Nieminen, R. M. and Niskanen, K.<br />
J. (1996): Elastic-plastic behaviour in fibre networks, Nordic Pulp<br />
and Paper Research Journal 11(4), 243-248.<br />
Seth, R. S. and Page, D. H. (1983): The <strong>Stress</strong> Strain Curve <strong>of</strong><br />
Paper, The Role <strong>of</strong> Fundamental Research in Paper Making,<br />
Mechanical Engineering Publication, London, pp. 421-452.<br />
Zavarise, G. and Wriggers, P. (2000): Contact with friction<br />
between beams in 3-D space, International Journal for Numerical<br />
Methods in Engineering 49, 977-1006.<br />
328 Nordic Pulp and Paper Research Journal Vol 27 no.2/2012