Stress-strain curve of paper revisited - Innventia.com
Stress-strain curve of paper revisited - Innventia.com
Stress-strain curve of paper revisited - Innventia.com

Create successful ePaper yourself
Turn your PDF publications into a flip-book with our unique Google optimized e-Paper software.
PAPER PHYSICS<br />
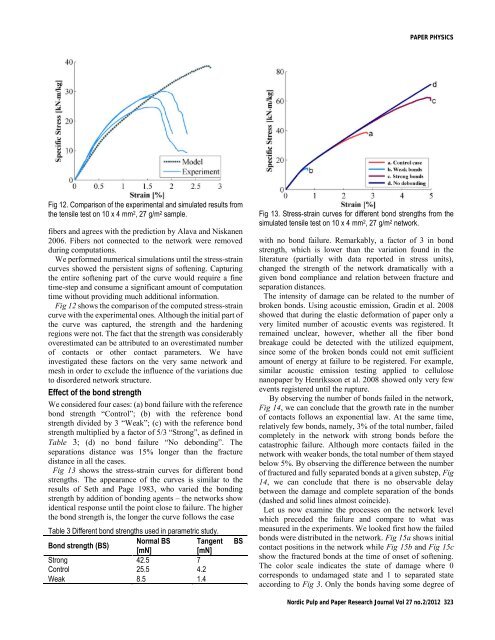
Fig 12. Comparison <strong>of</strong> the experimental and simulated results from<br />
the tensile test on 10 x 4 mm 2 , 27 g/m 2 sample.<br />
fibers and agrees with the prediction by Alava and Niskanen<br />
2006. Fibers not connected to the network were removed<br />
during <strong>com</strong>putations.<br />
We performed numerical simulations until the stress-<strong>strain</strong><br />
<strong>curve</strong>s showed the persistent signs <strong>of</strong> s<strong>of</strong>tening. Capturing<br />
the entire s<strong>of</strong>tening part <strong>of</strong> the <strong>curve</strong> would require a fine<br />
time-step and consume a significant amount <strong>of</strong> <strong>com</strong>putation<br />
time without providing much additional information.<br />
Fig 12 shows the <strong>com</strong>parison <strong>of</strong> the <strong>com</strong>puted stress-<strong>strain</strong><br />
<strong>curve</strong> with the experimental ones. Although the initial part <strong>of</strong><br />
the <strong>curve</strong> was captured, the strength and the hardening<br />
regions were not. The fact that the strength was considerably<br />
overestimated can be attributed to an overestimated number<br />
<strong>of</strong> contacts or other contact parameters. We have<br />
investigated these factors on the very same network and<br />
mesh in order to exclude the influence <strong>of</strong> the variations due<br />
to disordered network structure.<br />
Effect <strong>of</strong> the bond strength<br />
We considered four cases: (a) bond failure with the reference<br />
bond strength “Control”; (b) with the reference bond<br />
strength divided by 3 “Weak”; (c) with the reference bond<br />
strength multiplied by a factor <strong>of</strong> 5/3 “Strong”, as defined in<br />
Table 3; (d) no bond failure “No debonding”. The<br />
separations distance was 15% longer than the fracture<br />
distance in all the cases.<br />
Fig 13 shows the stress-<strong>strain</strong> <strong>curve</strong>s for different bond<br />
strengths. The appearance <strong>of</strong> the <strong>curve</strong>s is similar to the<br />
results <strong>of</strong> Seth and Page 1983, who varied the bonding<br />
strength by addition <strong>of</strong> bonding agents – the networks show<br />
identical response until the point close to failure. The higher<br />
the bond strength is, the longer the <strong>curve</strong> follows the case<br />
Table 3 Different bond strengths used in parametric study.<br />
Bond strength (BS)<br />
Normal BS Tangent<br />
[mN]<br />
[mN]<br />
Strong 42.5 7<br />
Control 25.5 4.2<br />
Weak 8.5 1.4<br />
BS<br />
Fig 13. <strong>Stress</strong>-<strong>strain</strong> <strong>curve</strong>s for different bond strengths from the<br />
simulated tensile test on 10 x 4 mm 2 , 27 g/m 2 network.<br />
with no bond failure. Remarkably, a factor <strong>of</strong> 3 in bond<br />
strength, which is lower than the variation found in the<br />
literature (partially with data reported in stress units),<br />
changed the strength <strong>of</strong> the network dramatically with a<br />
given bond <strong>com</strong>pliance and relation between fracture and<br />
separation distances.<br />
The intensity <strong>of</strong> damage can be related to the number <strong>of</strong><br />
broken bonds. Using acoustic emission, Gradin et al. 2008<br />
showed that during the elastic deformation <strong>of</strong> <strong>paper</strong> only a<br />
very limited number <strong>of</strong> acoustic events was registered. It<br />
remained unclear, however, whether all the fiber bond<br />
breakage could be detected with the utilized equipment,<br />
since some <strong>of</strong> the broken bonds could not emit sufficient<br />
amount <strong>of</strong> energy at failure to be registered. For example,<br />
similar acoustic emission testing applied to cellulose<br />
nano<strong>paper</strong> by Henriksson et al. 2008 showed only very few<br />
events registered until the rupture.<br />
By observing the number <strong>of</strong> bonds failed in the network,<br />
Fig 14, we can conclude that the growth rate in the number<br />
<strong>of</strong> contacts follows an exponential law. At the same time,<br />
relatively few bonds, namely, 3% <strong>of</strong> the total number, failed<br />
<strong>com</strong>pletely in the network with strong bonds before the<br />
catastrophic failure. Although more contacts failed in the<br />
network with weaker bonds, the total number <strong>of</strong> them stayed<br />
below 5%. By observing the difference between the number<br />
<strong>of</strong> fractured and fully separated bonds at a given substep, Fig<br />
14, we can conclude that there is no observable delay<br />
between the damage and <strong>com</strong>plete separation <strong>of</strong> the bonds<br />
(dashed and solid lines almost coincide).<br />
Let us now examine the processes on the network level<br />
which preceded the failure and <strong>com</strong>pare to what was<br />
measured in the experiments. We looked first how the failed<br />
bonds were distributed in the network. Fig 15a shows initial<br />
contact positions in the network while Fig 15b and Fig 15c<br />
show the fractured bonds at the time <strong>of</strong> onset <strong>of</strong> s<strong>of</strong>tening.<br />
The color scale indicates the state <strong>of</strong> damage where 0<br />
corresponds to undamaged state and 1 to separated state<br />
according to Fig 3. Only the bonds having some degree <strong>of</strong><br />
Nordic Pulp and Paper Research Journal Vol 27 no.2/2012 323