Verbyla, D.. 2008 The greening and browning of Alaska based on ...
Verbyla, D.. 2008 The greening and browning of Alaska based on ...
Verbyla, D.. 2008 The greening and browning of Alaska based on ...

You also want an ePaper? Increase the reach of your titles
YUMPU automatically turns print PDFs into web optimized ePapers that Google loves.
D. <str<strong>on</strong>g>Verbyla</str<strong>on</strong>g><br />
INTRODUCTION<br />
An increasing trend in the satellite-derived normalized difference<br />
vegetati<strong>on</strong> index (NDVI) has been reported as a ‘<str<strong>on</strong>g>greening</str<strong>on</strong>g> trend’<br />
at global (Myneni et al., 1997; Slayback et al., 2003) <str<strong>on</strong>g>and</str<strong>on</strong>g> regi<strong>on</strong>al<br />
scales (Hicke et al., 2002; Jia et al., 2003). <str<strong>on</strong>g>The</str<strong>on</strong>g> NDVI is correlated<br />
to the fracti<strong>on</strong> <str<strong>on</strong>g>of</str<strong>on</strong>g> photosynthetically active radiati<strong>on</strong> absorbed by<br />
plants, <str<strong>on</strong>g>and</str<strong>on</strong>g> thus to photosynthetic activity. A warming climate<br />
has led to earlier soil thaw, earlier green-up <str<strong>on</strong>g>and</str<strong>on</strong>g> l<strong>on</strong>ger growing<br />
seas<strong>on</strong>s in boreal <str<strong>on</strong>g>and</str<strong>on</strong>g> tundra regi<strong>on</strong>s that may result in increased<br />
gross photosynthetic activity (Slayback et al., 2003) <str<strong>on</strong>g>and</str<strong>on</strong>g> net primary<br />
productivity (Kimball et al., 2007).<br />
At the c<strong>on</strong>tinental scale <str<strong>on</strong>g>of</str<strong>on</strong>g> North America, NDVI trends in the<br />
boreal forest regi<strong>on</strong> have been weak or negative (Goetz et al.,<br />
2005; Bunn & Goetz, 2006), while tundra regi<strong>on</strong>s have increased<br />
in NDVI with the warming climate (Bunn et al., 2005, 2007).<br />
At the circumpolar scale, Bunn & Goetz (2006) found trends from<br />
the global boreal forest to vary by seas<strong>on</strong> <str<strong>on</strong>g>and</str<strong>on</strong>g> cover type, with a<br />
<str<strong>on</strong>g>greening</str<strong>on</strong>g> trend in areas <str<strong>on</strong>g>of</str<strong>on</strong>g> sparse tree cover while more densely<br />
forested areas experienced a <str<strong>on</strong>g>browning</str<strong>on</strong>g> trend (decreasing NDVI),<br />
especially in late summer. <str<strong>on</strong>g>The</str<strong>on</strong>g>y hypothesized that temperatureinduced<br />
drought stress was likely to be influencing the decreasing<br />
trend in NDVI in some boreal forest areas.<br />
<str<strong>on</strong>g>The</str<strong>on</strong>g> objective <str<strong>on</strong>g>of</str<strong>on</strong>g> this paper is to examine the trends <str<strong>on</strong>g>of</str<strong>on</strong>g> 1982–<br />
2003 NDVI within <str<strong>on</strong>g>Alaska</str<strong>on</strong>g> <str<strong>on</strong>g>and</str<strong>on</strong>g> western Yuk<strong>on</strong> Territory at several<br />
spatial scales. <str<strong>on</strong>g>The</str<strong>on</strong>g> study area c<strong>on</strong>sisted <str<strong>on</strong>g>of</str<strong>on</strong>g> a spatial hierarchy <str<strong>on</strong>g>of</str<strong>on</strong>g><br />
regi<strong>on</strong>s with mean summer temperatures ranging from 4 to 10 °C<br />
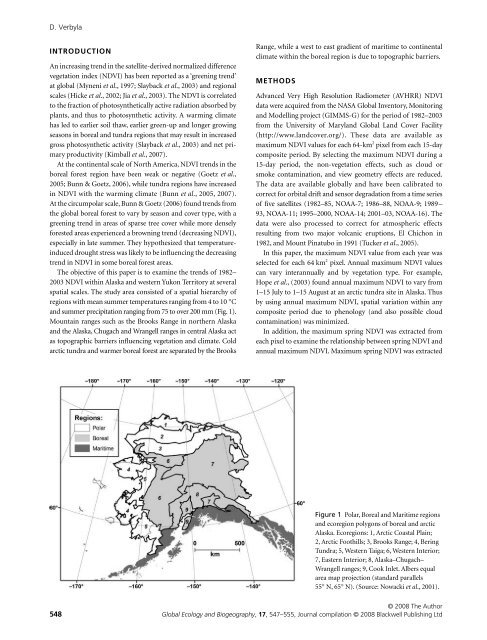
<str<strong>on</strong>g>and</str<strong>on</strong>g> summer precipitati<strong>on</strong> ranging from 75 to over 200 mm (Fig. 1).<br />
Mountain ranges such as the Brooks Range in northern <str<strong>on</strong>g>Alaska</str<strong>on</strong>g><br />
<str<strong>on</strong>g>and</str<strong>on</strong>g> the <str<strong>on</strong>g>Alaska</str<strong>on</strong>g>, Chugach <str<strong>on</strong>g>and</str<strong>on</strong>g> Wrangell ranges in central <str<strong>on</strong>g>Alaska</str<strong>on</strong>g> act<br />
as topographic barriers influencing vegetati<strong>on</strong> <str<strong>on</strong>g>and</str<strong>on</strong>g> climate. Cold<br />
arctic tundra <str<strong>on</strong>g>and</str<strong>on</strong>g> warmer boreal forest are separated by the Brooks<br />
Range, while a west to east gradient <str<strong>on</strong>g>of</str<strong>on</strong>g> maritime to c<strong>on</strong>tinental<br />
climate within the boreal regi<strong>on</strong> is due to topographic barriers.<br />
METHODS<br />
Advanced Very High Resoluti<strong>on</strong> Radiometer (AVHRR) NDVI<br />
data were acquired from the NASA Global Inventory, M<strong>on</strong>itoring<br />
<str<strong>on</strong>g>and</str<strong>on</strong>g> Modelling project (GIMMS-G) for the period <str<strong>on</strong>g>of</str<strong>on</strong>g> 1982–2003<br />
from the University <str<strong>on</strong>g>of</str<strong>on</strong>g> Maryl<str<strong>on</strong>g>and</str<strong>on</strong>g> Global L<str<strong>on</strong>g>and</str<strong>on</strong>g> Cover Facility<br />
(http://www.l<str<strong>on</strong>g>and</str<strong>on</strong>g>cover.org/). <str<strong>on</strong>g>The</str<strong>on</strong>g>se data are available as<br />
maximum NDVI values for each 64-km 2 pixel from each 15-day<br />
composite period. By selecting the maximum NDVI during a<br />
15-day period, the n<strong>on</strong>-vegetati<strong>on</strong> effects, such as cloud or<br />
smoke c<strong>on</strong>taminati<strong>on</strong>, <str<strong>on</strong>g>and</str<strong>on</strong>g> view geometry effects are reduced.<br />
<str<strong>on</strong>g>The</str<strong>on</strong>g> data are available globally <str<strong>on</strong>g>and</str<strong>on</strong>g> have been calibrated to<br />
correct for orbital drift <str<strong>on</strong>g>and</str<strong>on</strong>g> sensor degradati<strong>on</strong> from a time series<br />
<str<strong>on</strong>g>of</str<strong>on</strong>g> five satellites (1982–85, NOAA-7; 1986–88, NOAA-9; 1989–<br />
93, NOAA-11; 1995–2000, NOAA-14; 2001–03, NOAA-16). <str<strong>on</strong>g>The</str<strong>on</strong>g><br />
data were also processed to correct for atmospheric effects<br />
resulting from two major volcanic erupti<strong>on</strong>s, El Chich<strong>on</strong> in<br />
1982, <str<strong>on</strong>g>and</str<strong>on</strong>g> Mount Pinatubo in 1991 (Tucker et al., 2005).<br />
In this paper, the maximum NDVI value from each year was<br />
selected for each 64 km 2 pixel. Annual maximum NDVI values<br />
can vary interannually <str<strong>on</strong>g>and</str<strong>on</strong>g> by vegetati<strong>on</strong> type. For example,<br />
Hope et al., (2003) found annual maximum NDVI to vary from<br />
1–15 July to 1–15 August at an arctic tundra site in <str<strong>on</strong>g>Alaska</str<strong>on</strong>g>. Thus<br />
by using annual maximum NDVI, spatial variati<strong>on</strong> within any<br />
composite period due to phenology (<str<strong>on</strong>g>and</str<strong>on</strong>g> also possible cloud<br />
c<strong>on</strong>taminati<strong>on</strong>) was minimized.<br />
In additi<strong>on</strong>, the maximum spring NDVI was extracted from<br />
each pixel to examine the relati<strong>on</strong>ship between spring NDVI <str<strong>on</strong>g>and</str<strong>on</strong>g><br />
annual maximum NDVI. Maximum spring NDVI was extracted<br />
Figure 1 Polar, Boreal <str<strong>on</strong>g>and</str<strong>on</strong>g> Maritime regi<strong>on</strong>s<br />
<str<strong>on</strong>g>and</str<strong>on</strong>g> ecoregi<strong>on</strong> polyg<strong>on</strong>s <str<strong>on</strong>g>of</str<strong>on</strong>g> boreal <str<strong>on</strong>g>and</str<strong>on</strong>g> arctic<br />
<str<strong>on</strong>g>Alaska</str<strong>on</strong>g>. Ecoregi<strong>on</strong>s: 1, Arctic Coastal Plain;<br />
2, Arctic Foothills; 3, Brooks Range; 4, Bering<br />
Tundra; 5, Western Taiga; 6, Western Interior;<br />
7, Eastern Interior; 8, <str<strong>on</strong>g>Alaska</str<strong>on</strong>g>–Chugach–<br />
Wrangell ranges; 9, Cook Inlet. Albers equal<br />
area map projecti<strong>on</strong> (st<str<strong>on</strong>g>and</str<strong>on</strong>g>ard parallels<br />
55° N, 65° N). (Source: Nowacki et al., 2001).<br />
© <str<strong>on</strong>g>2008</str<strong>on</strong>g> <str<strong>on</strong>g>The</str<strong>on</strong>g> Author<br />
548 Global Ecology <str<strong>on</strong>g>and</str<strong>on</strong>g> Biogeography, 17, 547–555, Journal compilati<strong>on</strong> © <str<strong>on</strong>g>2008</str<strong>on</strong>g> Blackwell Publishing Ltd