Verbyla, D.. 2008 The greening and browning of Alaska based on ...
Verbyla, D.. 2008 The greening and browning of Alaska based on ...
Verbyla, D.. 2008 The greening and browning of Alaska based on ...

Create successful ePaper yourself
Turn your PDF publications into a flip-book with our unique Google optimized e-Paper software.
<str<strong>on</strong>g>Alaska</str<strong>on</strong>g> NDVI trends<br />
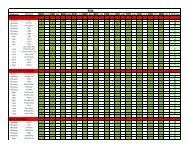
Table 3 Linear trend in annual maximum normalized difference vegetati<strong>on</strong> index (NDVI) (1982–2003) within climate stati<strong>on</strong> 100-km buffers.<br />
Slopes represent changes in NDVI (unitless) per year (n = 22).<br />
Climate stati<strong>on</strong> r 2 Slope P-value No. <str<strong>on</strong>g>of</str<strong>on</strong>g> pixels<br />
Mean May–Aug.<br />
temp. ( o C)<br />
Mean annual<br />
precipitati<strong>on</strong> (mm)<br />
Bering tundra regi<strong>on</strong><br />
Bethel 0.09 –0.002 0.16 455 10 453<br />
Kotzebue 0.007 0.0003 0.72 219 8 282<br />
Nome 0.01 +0.0005 0.59 145 8 438<br />
King Salm<strong>on</strong> 0.01 –0.0005 0.63 291 11 497<br />
Arctic tundra regi<strong>on</strong><br />
Barrow 0.56 +0.005 < 0.01 419 1 111<br />
Kuparuk 0.65 +0.005 < 0.01 235 3 97<br />
Umiat 0.55 +0.004 < 0.01 278 6 126<br />
Boreal forest regi<strong>on</strong><br />
Bettles 0.33 –0.002 < 0.01 122 12 380<br />
Delta 0.67 –0.004 < 0.01 118 13 309<br />
Fairbanks 0.46 –0.003 < 0.01 180 14 278<br />
Gulkana 0.30 –0.002 < 0.01 49 11 294<br />
McGrath 0.43 –0.004 < 0.01 185 12 465<br />
Talkeetna 0.19 –0.002 0.04 131 13 738<br />
significant (P > 0.16) linear relati<strong>on</strong>ships between annual<br />
maximum NDVI as a functi<strong>on</strong> <str<strong>on</strong>g>of</str<strong>on</strong>g> early spring NDVI for boreal<br />
buffers (r 2 ranging from < 0.01 to 0.09) Unlike the arctic tundra<br />
stati<strong>on</strong>s, there were no significant linear relati<strong>on</strong>ships between<br />
annual maximum NDVI <str<strong>on</strong>g>and</str<strong>on</strong>g> current or lagged summer warmth<br />
index values (P > 0.30, r 2 < 0.10).<br />
Bunn et al. (2005) found that the previous spring minimum<br />
temperature was an important variable in predicting summer<br />
NDVI in c<strong>on</strong>iferous <str<strong>on</strong>g>and</str<strong>on</strong>g> broadleaf boreal areas <str<strong>on</strong>g>of</str<strong>on</strong>g> Canada. In this<br />
study, the linear relati<strong>on</strong>ships <str<strong>on</strong>g>of</str<strong>on</strong>g> annual maximum NDVI as a<br />
functi<strong>on</strong> <str<strong>on</strong>g>of</str<strong>on</strong>g> previous spring temperature were weak (r 2 ranging<br />
from < 0.01 to 0.22). <str<strong>on</strong>g>The</str<strong>on</strong>g> linear relati<strong>on</strong>ships <str<strong>on</strong>g>of</str<strong>on</strong>g> annual maximum<br />
NDVI as a functi<strong>on</strong> <str<strong>on</strong>g>of</str<strong>on</strong>g> August through July precipitati<strong>on</strong> were<br />
also weak (r 2 ranging from 0.06 to 0.24).<br />
<str<strong>on</strong>g>The</str<strong>on</strong>g> 1982–2003 pattern <str<strong>on</strong>g>of</str<strong>on</strong>g> an increasing NDVI trend in<br />
northern arctic <str<strong>on</strong>g>Alaska</str<strong>on</strong>g> <str<strong>on</strong>g>and</str<strong>on</strong>g> a decreasing trend in interior <str<strong>on</strong>g>Alaska</str<strong>on</strong>g><br />
also was evident from the pixel-level linear regressi<strong>on</strong>s. <str<strong>on</strong>g>The</str<strong>on</strong>g><br />
highest rate <str<strong>on</strong>g>of</str<strong>on</strong>g> increase occurred al<strong>on</strong>g the central <str<strong>on</strong>g>and</str<strong>on</strong>g> eastern<br />
Arctic coastal plain, while the highest rate <str<strong>on</strong>g>of</str<strong>on</strong>g> decrease occurred in<br />
basins <str<strong>on</strong>g>of</str<strong>on</strong>g> interior <str<strong>on</strong>g>Alaska</str<strong>on</strong>g> (Fig. 3).<br />
DISCUSSION<br />
NDVI trends across the <str<strong>on</strong>g>Alaska</str<strong>on</strong>g>n tundra<br />
<str<strong>on</strong>g>The</str<strong>on</strong>g> growing seas<strong>on</strong> <str<strong>on</strong>g>of</str<strong>on</strong>g> the Arctic is now at its warmest relative to<br />
at least the past 400 years (Overpeck et al., 1997). Arctic <str<strong>on</strong>g>Alaska</str<strong>on</strong>g> is<br />
undergoing a system-wide resp<strong>on</strong>se to an altered climatic state<br />
(Hinzman et al., 2005). <str<strong>on</strong>g>The</str<strong>on</strong>g> summer warming in arctic <str<strong>on</strong>g>Alaska</str<strong>on</strong>g><br />
may be due to a lengthening <str<strong>on</strong>g>of</str<strong>on</strong>g> the snow-free seas<strong>on</strong>, with early<br />
sensible heating <str<strong>on</strong>g>of</str<strong>on</strong>g> the lower atmosphere (Chapin et al., 2005).<br />
Vegetati<strong>on</strong> resp<strong>on</strong>ses have included delayed senescence (March<str<strong>on</strong>g>and</str<strong>on</strong>g><br />
et al., 2004) <str<strong>on</strong>g>and</str<strong>on</strong>g> increased broadleaf shrub abundance across the<br />
<str<strong>on</strong>g>Alaska</str<strong>on</strong>g>n arctic tundra (Sturm et al., 2001; Tape et al., 2006). <str<strong>on</strong>g>The</str<strong>on</strong>g><br />
increase in annual maximum NDVI may be due to an increase<br />
in height <str<strong>on</strong>g>and</str<strong>on</strong>g> cover <str<strong>on</strong>g>of</str<strong>on</strong>g> shrubs <str<strong>on</strong>g>and</str<strong>on</strong>g> graminoids (Walker et al.,<br />
2006).<br />
Within the arctic climate stati<strong>on</strong> buffers there was a significant<br />
linear relati<strong>on</strong>ship between annual maximum NDVI <str<strong>on</strong>g>and</str<strong>on</strong>g> annual<br />
summer warmth index values, c<strong>on</strong>sistent with the results <str<strong>on</strong>g>of</str<strong>on</strong>g><br />
March<str<strong>on</strong>g>and</str<strong>on</strong>g> et al. (2004), who found infrared heating <str<strong>on</strong>g>of</str<strong>on</strong>g> tundra<br />
plots significantly increased NDVI within a few weeks <str<strong>on</strong>g>of</str<strong>on</strong>g> heating.<br />
A str<strong>on</strong>ger linear relati<strong>on</strong>ship was observed between annual<br />
maximum NDVI <str<strong>on</strong>g>and</str<strong>on</strong>g> the previous year’s summer warmth index.<br />
For example, the highest summer warmth index at Barrow,<br />
Kuparuk <str<strong>on</strong>g>and</str<strong>on</strong>g> Umiat occurred in 1989 <str<strong>on</strong>g>and</str<strong>on</strong>g> the highest residual<br />
from the NDVI trend lines occurred the next year. Spring greenup,<br />
expressed as maximum NDVI from the 1–15 June composite<br />
period, was a poor predictor <str<strong>on</strong>g>of</str<strong>on</strong>g> annual maximum NDVI at the<br />
climate stati<strong>on</strong> buffer scale <str<strong>on</strong>g>and</str<strong>on</strong>g> at the ecoregi<strong>on</strong> scale. Thus it<br />
appears that annual maximum NDVI was not dependent <strong>on</strong><br />
whether spring was early or late for any given year.<br />
<str<strong>on</strong>g>The</str<strong>on</strong>g>re were significant positive temporal trends in NDVI from<br />
1982 to 2003 at all spatial scales examined in the arctic tundra<br />
regi<strong>on</strong>. However, there were no significant temporal trends in<br />
NDVI at any spatial scale in the shrub tundra regi<strong>on</strong> <str<strong>on</strong>g>of</str<strong>on</strong>g> western<br />
<str<strong>on</strong>g>Alaska</str<strong>on</strong>g>. This may be due to the much colder climate <str<strong>on</strong>g>of</str<strong>on</strong>g> the arctic<br />
ecoregi<strong>on</strong>s relative to the Bering tundra ecoregi<strong>on</strong> (Table 3), with<br />
warming occurring at a faster rate in the arctic regi<strong>on</strong>. In general,<br />
there has been less warming <str<strong>on</strong>g>and</str<strong>on</strong>g> drying in western <str<strong>on</strong>g>Alaska</str<strong>on</strong>g> relative<br />
to central <str<strong>on</strong>g>and</str<strong>on</strong>g> eastern arctic <str<strong>on</strong>g>Alaska</str<strong>on</strong>g>, which has been described as<br />
a steepened gradient in c<strong>on</strong>tinentality over the past 20 years<br />
(Thomps<strong>on</strong> et al., 2006). <str<strong>on</strong>g>The</str<strong>on</strong>g> pattern <str<strong>on</strong>g>of</str<strong>on</strong>g> increasing NDVI over<br />
the period 1982–2003 in tundra regi<strong>on</strong>s <str<strong>on</strong>g>of</str<strong>on</strong>g> <str<strong>on</strong>g>Alaska</str<strong>on</strong>g> followed this<br />
west–east trend, with the northern arctic trend str<strong>on</strong>gest east <str<strong>on</strong>g>of</str<strong>on</strong>g><br />
160° W l<strong>on</strong>gitude (Fig. 3).<br />
© <str<strong>on</strong>g>2008</str<strong>on</strong>g> <str<strong>on</strong>g>The</str<strong>on</strong>g> Author<br />
Global Ecology <str<strong>on</strong>g>and</str<strong>on</strong>g> Biogeography, 17, 547–555, Journal compilati<strong>on</strong> © <str<strong>on</strong>g>2008</str<strong>on</strong>g> Blackwell Publishing Ltd 551