Verbyla, D.. 2008 The greening and browning of Alaska based on ...
Verbyla, D.. 2008 The greening and browning of Alaska based on ...
Verbyla, D.. 2008 The greening and browning of Alaska based on ...

Create successful ePaper yourself
Turn your PDF publications into a flip-book with our unique Google optimized e-Paper software.
D. <str<strong>on</strong>g>Verbyla</str<strong>on</strong>g><br />
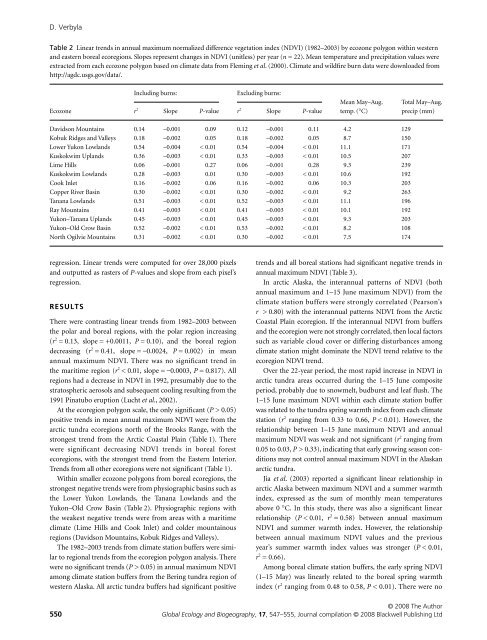
Table 2 Linear trends in annual maximum normalized difference vegetati<strong>on</strong> index (NDVI) (1982–2003) by ecoz<strong>on</strong>e polyg<strong>on</strong> within western<br />
<str<strong>on</strong>g>and</str<strong>on</strong>g> eastern boreal ecoregi<strong>on</strong>s. Slopes represent changes in NDVI (unitless) per year (n = 22). Mean temperature <str<strong>on</strong>g>and</str<strong>on</strong>g> precipitati<strong>on</strong> values were<br />
extracted from each ecoz<strong>on</strong>e polyg<strong>on</strong> <str<strong>on</strong>g>based</str<strong>on</strong>g> <strong>on</strong> climate data from Fleming et al. (2000). Climate <str<strong>on</strong>g>and</str<strong>on</strong>g> wildfire burn data were downloaded from<br />
http://agdc.usgs.gov/data/.<br />
Ecoz<strong>on</strong>e<br />
Including burns:<br />
Excluding burns:<br />
r 2 Slope P-value r 2 Slope P-value<br />
Mean May–Aug.<br />
temp. (°C)<br />
Total May–Aug.<br />
precip (mm)<br />
Davids<strong>on</strong> Mountains 0.14 –0.001 0.09 0.12 –0.001 0.11 4.2 129<br />
Kobuk Ridges <str<strong>on</strong>g>and</str<strong>on</strong>g> Valleys 0.18 –0.002 0.05 0.18 –0.002 0.05 8.7 150<br />
Lower Yuk<strong>on</strong> Lowl<str<strong>on</strong>g>and</str<strong>on</strong>g>s 0.54 –0.004 < 0.01 0.54 –0.004 < 0.01 11.1 171<br />
Kuskokwim Upl<str<strong>on</strong>g>and</str<strong>on</strong>g>s 0.36 –0.003 < 0.01 0.33 –0.003 < 0.01 10.5 207<br />
Lime Hills 0.06 –0.001 0.27 0.06 –0.001 0.28 9.3 239<br />
Kuskokwim Lowl<str<strong>on</strong>g>and</str<strong>on</strong>g>s 0.28 –0.003 0.01 0.30 –0.003 < 0.01 10.6 192<br />
Cook Inlet 0.16 –0.002 0.06 0.16 –0.002 0.06 10.3 203<br />
Copper River Basin 0.30 –0.002 < 0.01 0.30 –0.002 < 0.01 9.2 263<br />
Tanana Lowl<str<strong>on</strong>g>and</str<strong>on</strong>g>s 0.51 –0.003 < 0.01 0.52 –0.003 < 0.01 11.1 196<br />
Ray Mountains 0.41 –0.003 < 0.01 0.41 –0.003 < 0.01 10.1 192<br />
Yuk<strong>on</strong>–Tanana Upl<str<strong>on</strong>g>and</str<strong>on</strong>g>s 0.45 –0.003 < 0.01 0.45 –0.003 < 0.01 9.3 203<br />
Yuk<strong>on</strong>–Old Crow Basin 0.52 –0.002 < 0.01 0.53 –0.002 < 0.01 8.2 108<br />
North Ogilvie Mountains 0.31 –0.002 < 0.01 0.30 –0.002 < 0.01 7.5 174<br />
regressi<strong>on</strong>. Linear trends were computed for over 28,000 pixels<br />
<str<strong>on</strong>g>and</str<strong>on</strong>g> outputted as rasters <str<strong>on</strong>g>of</str<strong>on</strong>g> P-values <str<strong>on</strong>g>and</str<strong>on</strong>g> slope from each pixel’s<br />
regressi<strong>on</strong>.<br />
RESULTS<br />
<str<strong>on</strong>g>The</str<strong>on</strong>g>re were c<strong>on</strong>trasting linear trends from 1982–2003 between<br />
the polar <str<strong>on</strong>g>and</str<strong>on</strong>g> boreal regi<strong>on</strong>s, with the polar regi<strong>on</strong> increasing<br />
(r 2 = 0.13, slope = +0.0011, P = 0.10), <str<strong>on</strong>g>and</str<strong>on</strong>g> the boreal regi<strong>on</strong><br />
decreasing (r 2 = 0.41, slope = –0.0024, P = 0.002) in mean<br />
annual maximum NDVI. <str<strong>on</strong>g>The</str<strong>on</strong>g>re was no significant trend in<br />
the maritime regi<strong>on</strong> (r 2 < 0.01, slope = –0.0003, P = 0.817). All<br />
regi<strong>on</strong>s had a decrease in NDVI in 1992, presumably due to the<br />
stratospheric aerosols <str<strong>on</strong>g>and</str<strong>on</strong>g> subsequent cooling resulting from the<br />
1991 Pinatubo erupti<strong>on</strong> (Lucht et al., 2002).<br />
At the ecoregi<strong>on</strong> polyg<strong>on</strong> scale, the <strong>on</strong>ly significant (P > 0.05)<br />
positive trends in mean annual maximum NDVI were from the<br />
arctic tundra ecoregi<strong>on</strong>s north <str<strong>on</strong>g>of</str<strong>on</strong>g> the Brooks Range, with the<br />
str<strong>on</strong>gest trend from the Arctic Coastal Plain (Table 1). <str<strong>on</strong>g>The</str<strong>on</strong>g>re<br />
were significant decreasing NDVI trends in boreal forest<br />
ecoregi<strong>on</strong>s, with the str<strong>on</strong>gest trend from the Eastern Interior.<br />
Trends from all other ecoregi<strong>on</strong>s were not significant (Table 1).<br />
Within smaller ecoz<strong>on</strong>e polyg<strong>on</strong>s from boreal ecoregi<strong>on</strong>s, the<br />
str<strong>on</strong>gest negative trends were from physiographic basins such as<br />
the Lower Yuk<strong>on</strong> Lowl<str<strong>on</strong>g>and</str<strong>on</strong>g>s, the Tanana Lowl<str<strong>on</strong>g>and</str<strong>on</strong>g>s <str<strong>on</strong>g>and</str<strong>on</strong>g> the<br />
Yuk<strong>on</strong>–Old Crow Basin (Table 2). Physiographic regi<strong>on</strong>s with<br />
the weakest negative trends were from areas with a maritime<br />
climate (Lime Hills <str<strong>on</strong>g>and</str<strong>on</strong>g> Cook Inlet) <str<strong>on</strong>g>and</str<strong>on</strong>g> colder mountainous<br />
regi<strong>on</strong>s (Davids<strong>on</strong> Mountains, Kobuk Ridges <str<strong>on</strong>g>and</str<strong>on</strong>g> Valleys).<br />
<str<strong>on</strong>g>The</str<strong>on</strong>g> 1982–2003 trends from climate stati<strong>on</strong> buffers were similar<br />
to regi<strong>on</strong>al trends from the ecoregi<strong>on</strong> polyg<strong>on</strong> analysis. <str<strong>on</strong>g>The</str<strong>on</strong>g>re<br />
were no significant trends (P > 0.05) in annual maximum NDVI<br />
am<strong>on</strong>g climate stati<strong>on</strong> buffers from the Bering tundra regi<strong>on</strong> <str<strong>on</strong>g>of</str<strong>on</strong>g><br />
western <str<strong>on</strong>g>Alaska</str<strong>on</strong>g>. All arctic tundra buffers had significant positive<br />
trends <str<strong>on</strong>g>and</str<strong>on</strong>g> all boreal stati<strong>on</strong>s had significant negative trends in<br />
annual maximum NDVI (Table 3).<br />
In arctic <str<strong>on</strong>g>Alaska</str<strong>on</strong>g>, the interannual patterns <str<strong>on</strong>g>of</str<strong>on</strong>g> NDVI (both<br />
annual maximum <str<strong>on</strong>g>and</str<strong>on</strong>g> 1–15 June maximum NDVI) from the<br />
climate stati<strong>on</strong> buffers were str<strong>on</strong>gly correlated (Pears<strong>on</strong>’s<br />
r > 0.80) with the interannual patterns NDVI from the Arctic<br />
Coastal Plain ecoregi<strong>on</strong>. If the interannual NDVI from buffers<br />
<str<strong>on</strong>g>and</str<strong>on</strong>g> the ecoregi<strong>on</strong> were not str<strong>on</strong>gly correlated, then local factors<br />
such as variable cloud cover or differing disturbances am<strong>on</strong>g<br />
climate stati<strong>on</strong> might dominate the NDVI trend relative to the<br />
ecoregi<strong>on</strong> NDVI trend.<br />
Over the 22-year period, the most rapid increase in NDVI in<br />
arctic tundra areas occurred during the 1–15 June composite<br />
period, probably due to snowmelt, budburst <str<strong>on</strong>g>and</str<strong>on</strong>g> leaf flush. <str<strong>on</strong>g>The</str<strong>on</strong>g><br />
1–15 June maximum NDVI within each climate stati<strong>on</strong> buffer<br />
was related to the tundra spring warmth index from each climate<br />
stati<strong>on</strong> (r 2 ranging from 0.33 to 0.66, P < 0.01). However, the<br />
relati<strong>on</strong>ship between 1–15 June maximum NDVI <str<strong>on</strong>g>and</str<strong>on</strong>g> annual<br />
maximum NDVI was weak <str<strong>on</strong>g>and</str<strong>on</strong>g> not significant (r 2 ranging from<br />
0.05 to 0.03, P > 0.33), indicating that early growing seas<strong>on</strong> c<strong>on</strong>diti<strong>on</strong>s<br />
may not c<strong>on</strong>trol annual maximum NDVI in the <str<strong>on</strong>g>Alaska</str<strong>on</strong>g>n<br />
arctic tundra.<br />
Jia et al. (2003) reported a significant linear relati<strong>on</strong>ship in<br />
arctic <str<strong>on</strong>g>Alaska</str<strong>on</strong>g> between maximum NDVI <str<strong>on</strong>g>and</str<strong>on</strong>g> a summer warmth<br />
index, expressed as the sum <str<strong>on</strong>g>of</str<strong>on</strong>g> m<strong>on</strong>thly mean temperatures<br />
above 0 °C. In this study, there was also a significant linear<br />
relati<strong>on</strong>ship (P < 0.01, r 2 = 0.58) between annual maximum<br />
NDVI <str<strong>on</strong>g>and</str<strong>on</strong>g> summer warmth index. However, the relati<strong>on</strong>ship<br />
between annual maximum NDVI values <str<strong>on</strong>g>and</str<strong>on</strong>g> the previous<br />
year’s summer warmth index values was str<strong>on</strong>ger (P < 0.01,<br />
r 2 = 0.66).<br />
Am<strong>on</strong>g boreal climate stati<strong>on</strong> buffers, the early spring NDVI<br />
(1–15 May) was linearly related to the boreal spring warmth<br />
index (r 2 ranging from 0.48 to 0.58, P < 0.01). <str<strong>on</strong>g>The</str<strong>on</strong>g>re were no<br />
© <str<strong>on</strong>g>2008</str<strong>on</strong>g> <str<strong>on</strong>g>The</str<strong>on</strong>g> Author<br />
550 Global Ecology <str<strong>on</strong>g>and</str<strong>on</strong>g> Biogeography, 17, 547–555, Journal compilati<strong>on</strong> © <str<strong>on</strong>g>2008</str<strong>on</strong>g> Blackwell Publishing Ltd