Verbyla, D.. 2008 The greening and browning of Alaska based on ...
Verbyla, D.. 2008 The greening and browning of Alaska based on ...
Verbyla, D.. 2008 The greening and browning of Alaska based on ...

Create successful ePaper yourself
Turn your PDF publications into a flip-book with our unique Google optimized e-Paper software.
<str<strong>on</strong>g>Alaska</str<strong>on</strong>g> NDVI trends<br />
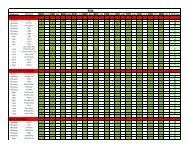
Figure 2 Buffers <str<strong>on</strong>g>of</str<strong>on</strong>g> radius 100 km centred<br />
<strong>on</strong> first-order climate stati<strong>on</strong>s used in this<br />
study. Arctic tundra stati<strong>on</strong>s: Barrow,<br />
Kuparuk, Umiat. Bering tundra stati<strong>on</strong>s:<br />
Kotzebue, Nome, Bethel, King Salm<strong>on</strong>. Boreal<br />
forest stati<strong>on</strong>s: Bettles, McGrath, Fairbanks,<br />
Delta, Talkeetna, Gulkana. Only pixels within<br />
100-m elevati<strong>on</strong> <str<strong>on</strong>g>of</str<strong>on</strong>g> each climate stati<strong>on</strong> were<br />
used in the analysis. Albers equal area map<br />
projecti<strong>on</strong> (st<str<strong>on</strong>g>and</str<strong>on</strong>g>ard parallels 55° N, 65° N).<br />
from the period 1–15 June for arctic tundra pixels, <str<strong>on</strong>g>and</str<strong>on</strong>g> the<br />
period 15–30 May for boreal forest pixels, since these composite<br />
periods corresp<strong>on</strong>d to the spring green-up period for tundra <str<strong>on</strong>g>and</str<strong>on</strong>g><br />
boreal forest regi<strong>on</strong>s in <str<strong>on</strong>g>Alaska</str<strong>on</strong>g>.<br />
Simple linear regressi<strong>on</strong> was used to summarize the trend in<br />
annual maximum NDVI within each regi<strong>on</strong> during the 22-year<br />
period. A spatial hierarchy <str<strong>on</strong>g>of</str<strong>on</strong>g> ecoregi<strong>on</strong> polyg<strong>on</strong>s was used as<br />
defined by Nowacki et al. (2001). At the largest spatial scale <str<strong>on</strong>g>of</str<strong>on</strong>g><br />
analysis, the trends within polar, boreal <str<strong>on</strong>g>and</str<strong>on</strong>g> maritime regi<strong>on</strong>s<br />
(Fig. 1) were investigated. <str<strong>on</strong>g>The</str<strong>on</strong>g> polar regi<strong>on</strong> was predominantly a<br />
tundra z<strong>on</strong>e with cold summer temperatures. <str<strong>on</strong>g>The</str<strong>on</strong>g> boreal regi<strong>on</strong><br />
was predominantly boreal forest within the rain shadow <str<strong>on</strong>g>of</str<strong>on</strong>g> major<br />
mountain ranges. <str<strong>on</strong>g>The</str<strong>on</strong>g> maritime regi<strong>on</strong> was a wet regi<strong>on</strong> <str<strong>on</strong>g>of</str<strong>on</strong>g><br />
coastal areas influenced by the Pacific Ocean.<br />
Within the polar <str<strong>on</strong>g>and</str<strong>on</strong>g> boreal regi<strong>on</strong>s, a smaller scale <str<strong>on</strong>g>of</str<strong>on</strong>g> ecoregi<strong>on</strong><br />
polyg<strong>on</strong>s was used because there is a west to east gradient <str<strong>on</strong>g>of</str<strong>on</strong>g><br />
maritime to c<strong>on</strong>tinental climate within the <str<strong>on</strong>g>Alaska</str<strong>on</strong>g>n boreal forest<br />
<str<strong>on</strong>g>and</str<strong>on</strong>g> a coastal temperature gradient within the polar z<strong>on</strong>e. Each<br />
ecoregi<strong>on</strong> was a polyg<strong>on</strong> defined by physiography (Table 1,<br />
Fig. 1). At a smaller scale, ecoz<strong>on</strong>e polyg<strong>on</strong>s (Nowacki et al.,<br />
2001) within the boreal ecoregi<strong>on</strong>s were also examined to further<br />
assess the effect <str<strong>on</strong>g>of</str<strong>on</strong>g> the east to west climatic gradient within the<br />
boreal regi<strong>on</strong>. Areas that were burned during 1973–2003 were<br />
excluded from the analysis since wildfire is comm<strong>on</strong> within<br />
boreal <str<strong>on</strong>g>Alaska</str<strong>on</strong>g> <str<strong>on</strong>g>and</str<strong>on</strong>g> can influence NDVI values.<br />
First-order climate stati<strong>on</strong>s within the polar <str<strong>on</strong>g>and</str<strong>on</strong>g> boreal<br />
regi<strong>on</strong>s <str<strong>on</strong>g>of</str<strong>on</strong>g> <str<strong>on</strong>g>Alaska</str<strong>on</strong>g> were used to investigate the interannual<br />
relati<strong>on</strong>ship between annual maximum NDVI <str<strong>on</strong>g>and</str<strong>on</strong>g> temperature/<br />
precipitati<strong>on</strong> indices. A buffer was created around the locati<strong>on</strong> <str<strong>on</strong>g>of</str<strong>on</strong>g><br />
each climate stati<strong>on</strong>, as all pixels within 100 m elevati<strong>on</strong> <str<strong>on</strong>g>and</str<strong>on</strong>g><br />
within 100 km <str<strong>on</strong>g>of</str<strong>on</strong>g> the climate stati<strong>on</strong>. <str<strong>on</strong>g>The</str<strong>on</strong>g>re were few climate<br />
stati<strong>on</strong>s in <str<strong>on</strong>g>Alaska</str<strong>on</strong>g> with records from the period 1982–2003: three<br />
Table 1 Linear trends in annual maximum normalized difference<br />
vegetati<strong>on</strong> index (NDVI) (1982–2003) by ecoregi<strong>on</strong> (n = 22 years).<br />
Slopes represent changes in NDVI (unitless) per year (n = 22).<br />
Ecoregi<strong>on</strong> r 2 Slope P-value<br />
1. Arctic Coastal Plain 0.63 +0.005 < 0.01<br />
2. Arctic Foothills 0.52 +0.003 < 0.01<br />
3. Brooks Range 0.09 +0.0008 0.17<br />
4. Bering Tundra 0.04 –0.0008 0.37<br />
5. Western Taiga 0.17 –0.002 0.05<br />
6. Western Interior 0.38 –0.003 < 0.01<br />
7. Eastern Interior 0.53 –0.003 < 0.01<br />
8. Wrangell/<str<strong>on</strong>g>Alaska</str<strong>on</strong>g> ranges 0.04 –0.0008 0.38<br />
9. Cook Inlet 0.16 –0.002 0.07<br />
stati<strong>on</strong>s from the arctic tundra regi<strong>on</strong>, four stati<strong>on</strong>s from the<br />
Bering tundra regi<strong>on</strong> <str<strong>on</strong>g>and</str<strong>on</strong>g> six stati<strong>on</strong>s from the interior boreal<br />
regi<strong>on</strong> (Fig. 2). Climate data for the period 1982–2003 were<br />
downloaded from the Western Regi<strong>on</strong>al Climate Center website<br />
(http://www.wrcc.dri.edu/). An annual summer warmth index<br />
(Jia et al., 2003) was computed for tundra climate stati<strong>on</strong>s as the<br />
sum <str<strong>on</strong>g>of</str<strong>on</strong>g> m<strong>on</strong>thly mean temperatures above 0 °C.<br />
Spring budburst <str<strong>on</strong>g>and</str<strong>on</strong>g> green-up typically occur in early June in<br />
tundra areas <str<strong>on</strong>g>and</str<strong>on</strong>g> early May in boreal areas <str<strong>on</strong>g>of</str<strong>on</strong>g> <str<strong>on</strong>g>Alaska</str<strong>on</strong>g>. A tundra<br />
spring warmth index was computed for tundra buffers as the<br />
sum <str<strong>on</strong>g>of</str<strong>on</strong>g> m<strong>on</strong>thly mean temperatures for May plus June <str<strong>on</strong>g>of</str<strong>on</strong>g> each<br />
year. A boreal spring warmth index was computed for boreal<br />
buffers as the sum <str<strong>on</strong>g>of</str<strong>on</strong>g> m<strong>on</strong>thly mean temperatures for April plus<br />
May <str<strong>on</strong>g>of</str<strong>on</strong>g> each year.<br />
<str<strong>on</strong>g>The</str<strong>on</strong>g> finest grain size used in this study was the pixel level. <str<strong>on</strong>g>The</str<strong>on</strong>g><br />
linear trend for each 64-km 2 pixel was computed using a linear<br />
© <str<strong>on</strong>g>2008</str<strong>on</strong>g> <str<strong>on</strong>g>The</str<strong>on</strong>g> Author<br />
Global Ecology <str<strong>on</strong>g>and</str<strong>on</strong>g> Biogeography, 17, 547–555, Journal compilati<strong>on</strong> © <str<strong>on</strong>g>2008</str<strong>on</strong>g> Blackwell Publishing Ltd 549