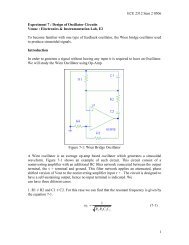
AC Peak, RMS, and Phase Measurement
AC Peak, RMS, and Phase Measurement
AC Peak, RMS, and Phase Measurement

You also want an ePaper? Increase the reach of your titles
YUMPU automatically turns print PDFs into web optimized ePapers that Google loves.
ENGINEERING lAB 1<br />
11:85 "And O my people! give just measure <strong>and</strong> weight, nor withhold from the people the things<br />
that are their due: commit not evil in the l<strong>and</strong> with intent to do mischief.<br />
Electric Circuits Lab. Experiment 5<br />
<strong>AC</strong> <strong>Peak</strong>, <strong>RMS</strong>, <strong>and</strong> <strong>Phase</strong> <strong>Measurement</strong><br />
Aims:<br />
• To become familiar with the oscilloscope <strong>and</strong> what it does.<br />
• To learn how to use the various controls on the oscilloscope.<br />
• Identify the characteristics of basic non-sinusoidal waveforms.<br />
Background & Theory:<br />
The Oscilloscope is a device for observing <strong>and</strong> taking measurements of electrical<br />
signals <strong>and</strong> waveforms.<br />
The analog oscilloscope consists of a cathode ray tube (CRT) which displays a<br />
graph, primarily voltage versus time. It also has one or more amplifiers to supply<br />
voltage signals to the CRT <strong>and</strong> a time base system for generating the time scale.<br />
Some of the modern digital oscilloscopes use a liquid crystal display screen for the<br />
same purpose.<br />
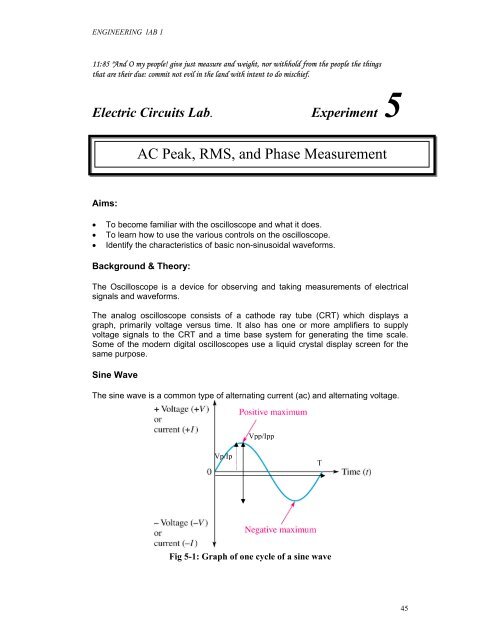
Sine Wave<br />
The sine wave is a common type of alternating current (ac) <strong>and</strong> alternating voltage.<br />
Vpp/Ipp<br />
Vp/Ip<br />
T<br />
Fig 5-1: Graph of one cycle of a sine wave<br />
45
ENGINEERING lAB 1<br />
For the wave form above<br />
Time period = T<br />
Frequency f = 1/T<br />
v = V sin 2π ft = V sin(2π<br />
/ T ) t<br />
Period of Sine Wave<br />
The time required for a sine wave to complete one full cycle is called the period (T).<br />
–A cycle consists of one complete positive, <strong>and</strong> one complete negative<br />
alternation.<br />
–The period of a sine wave can be measured between any two corresponding<br />
points on the waveform by any of the three methods.<br />
i) The period can be measured from one zero crossing to the<br />
corresponding zero crossing in the next cycle.<br />
ii) The period can be measured from the positive peak in one cycle to the<br />
positive peak in the next cycle.<br />
iii) The period can be measured from the negative peak in one cycle to<br />
the negative peak in the next cycle.<br />
Frequency of a Sine Wave<br />
Frequency ( f ) is the number of cycles that a sine wave completes in one second.<br />
–The more cycles completed in one second. The higher the frequency.<br />
–Frequency is measured in hertz (Hz)<br />
Relationship between frequency ( f ) <strong>and</strong> period (T) is:<br />
f = 1/T<br />
Electronic Signal / Frequency Generators<br />
In the lab, we usually use a signal generator to produce a variety of waveforms at a<br />
wide range of frequencies.<br />
–An oscillator in the signal generator produces the repetitive wave.<br />
–We are able to set the frequency <strong>and</strong> amplitude of the signal from the signal<br />
generator.<br />
Instantaneous Values of Sine Waves<br />
The instantaneous values of a sine wave voltage (or current) are different at different<br />
points along the curve, having negative <strong>and</strong> positive values.<br />
Instantaneous values are represented as:<br />
v <strong>and</strong> I<br />
<strong>Peak</strong> Values of Sine Waves<br />
The peak value of a sine wave is the value of voltage or current at the positive or<br />
negative maximum with respect to zero.<br />
<strong>Peak</strong> values are represented as:<br />
Vp <strong>and</strong> Ip<br />
<strong>Peak</strong>-to-<strong>Peak</strong> Values<br />
The peak-to-peak value of a sine wave is the voltage or current from the positive<br />
peak to the negative peak.<br />
The peak-to-peak values are represented as:<br />
Vpp <strong>and</strong> Ipp Where: Vpp = 2Vp <strong>and</strong> Ipp = 2Ip<br />
EFFECTIVE VALUE:<br />
46
ENGINEERING lAB 1<br />
Effective (rms) values of ac waveforms are given as:<br />
T<br />
1 2<br />
Vm<br />
V = v dt =<br />
T<br />
∫ (For sinusoidal wave)<br />
2<br />
0<br />
T<br />
1 2<br />
I<br />
m<br />
I = i dt =<br />
T<br />
∫<br />
(For sinusoidal wave)<br />
2<br />
0<br />
These values are directly measured in ac voltmeter / ammeters <strong>and</strong> can be used in<br />
power calculation as:<br />
2 2<br />
P = I R = V / R W<br />
True /Average Power<br />
2 2<br />
P = VI ⋅Cosθ<br />
W or P = I R = V / R W<br />
Apparent Power P A<br />
= VI VA<br />
Reactive Power P R<br />
= VI.<br />
Sinθ<br />
VAR,<br />
Where θ is phase difference between voltage <strong>and</strong> current.\<br />
AVERAGE VALUE<br />
Average values of ac waveforms are given as:<br />
T<br />
1<br />
= ∫ vdt = 0<br />
T 0<br />
T<br />
1<br />
= ∫ idt = 0<br />
T<br />
V (For sinusoidal wave)<br />
I (For sinusoidal wave)<br />
0<br />
PHASE DIFFERENCE:<br />
v/i<br />
θ<br />
t<br />
T<br />
Fig 5-2. Two sinusoidal waves with phase difference<br />
The phase of a sine wave is an angular measurement that specifies the position of a<br />
sine wave relative to a reference. When a sine wave is shifted left or right with<br />
respect to this reference, there is a phase shift or phase difference.<br />
<strong>Phase</strong> difference between two ac sinusoidal waveforms is the difference in electrical<br />
angle between two identical points of the two waves. In Fig.5-2, the voltage <strong>and</strong><br />
current equations are given as:<br />
47
ENGINEERING lAB 1<br />
v = Vm Sin( 2π<br />
/ T ) t<br />
i<br />
m<br />
= I Sin( 2π<br />
/ Tt −θ<br />
)<br />
Expressions for Shifted Sine Waves<br />
•When a sine wave is shifted to the right of the reference by an angle f, is is termed<br />
lagging.<br />
•When a sine wave is shifted to the left of the reference by an angle f, is is termed<br />
leading.<br />
IMPEDANCE:<br />
Relation between the voltage across <strong>and</strong> the current through any component of an ac<br />
circuit is given by impedance. For the voltage <strong>and</strong> current waveforms in Fig.5-2, the<br />
corresponding impedance Z is given as:<br />
Z V / I ∠θ ) = V / I ∠θ<br />
=<br />
m m rms rms<br />
<strong>RMS</strong> Value of a Sine Wave<br />
The rms (root mean square) value of a sinusoidal voltage is equal to the dc voltage<br />
that produces the same amount of heat in a resistance as does the sinusoidal<br />
voltage.<br />
Vrms = 0.707Vp<br />
Irms = 0.707IpAverage Value of a Sine<br />
Wave<br />
The average value is the total area under the half-cycle curve divided by the distance<br />
in radians of the curve along the horizontal axis.<br />
Vavg = 0.637Vp<br />
Iavg = 0.637Ip<br />
Angular <strong>Measurement</strong> of a Sine Wave<br />
A degree is an angular measurement corresponding to 1/360 of a circle or a<br />
complete revolution.<br />
A radian (rad) is the angular measure along the circumference of a circle that is<br />
equal to the radius of the circle.<br />
There are 2p radians or 360° in one complete cycle of a sine wave.<br />
Ohms’s Law <strong>and</strong> Kirchhoff’s Laws in <strong>AC</strong> Circuits<br />
48
ENGINEERING lAB 1<br />
When time-varying ac voltages such as a sinusoidal voltage are applied to a circuit,<br />
the circuit laws that were studied earlier still apply.<br />
Ohm’s law <strong>and</strong> Kirchhoff’s laws apply to ac circuits in the same way that they apply to<br />
dc circuits.<br />
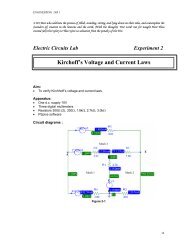
Apparatus:<br />
• Oscilloscope<br />
• Function generation<br />
• Digital Multimeter<br />
• Capacitor 1µF, 10µF<br />
• Resistance 100 Ω,<br />
• Breadboard<br />
1µF/10 µF<br />
+<br />
10V p-p<br />
1 KHz<br />
Osc.<br />
Ch-1<br />
10V p-p<br />
1 KHz<br />
Osc.<br />
Ch-1<br />
100Ω<br />
Osc.<br />
Ch-2<br />
_<br />
Fig. 5-3(a)<br />
Fig. 5-3(b)<br />
Method:<br />
1. Connect the output of the function generator directly to channel 1 of the<br />
oscilloscope as shown in Fig 5-3(a). Set the amplitude of the wave at 10V <strong>and</strong><br />
the frequency at 1 kHz. Select sinusoidal wave shape.<br />
2. Sketch the wave shape observed on the oscilloscope. Determine the time period<br />
of the wave <strong>and</strong> calculate the frequency.<br />
3. Measure the ac <strong>and</strong> dc voltage.<br />
4. Change the frequency to 500Hz <strong>and</strong> note what happens to the display of the<br />
wave. Repeat when the frequency is increased to 2 KHz with the increment of<br />
500Hz.<br />
5. Construct the circuit as shown in Fig. 5-3(b) considering 1µF capacitor.<br />
6. Measure the input voltage <strong>and</strong> the input current with the oscilloscope. In order to<br />
measure current flowing through the circuit, measure the voltage across the<br />
resistor by using oscilloscope <strong>and</strong> then divide by resistor which gives the current<br />
flowing through the circuit. The ratio between the voltage <strong>and</strong> the current gives<br />
the magnitude of the impedance, Z. Record the results in Table 5-1.<br />
7. Observe the wave shapes of oscilloscope channels 1 <strong>and</strong> 2 simultaneously. Find<br />
the frequency of both the waves <strong>and</strong> amplitude from the display. Determine the<br />
phase difference between the two waves. The phase difference is give by<br />
∆t o<br />
θ = 360 , where ' ∆ t ' is the time delay between the two waves. Also observe<br />
T<br />
which of the two waves lead. Note that the voltage in channel 2 is the voltage<br />
across a resistance <strong>and</strong> hence this is in phase with the current flowing in the<br />
circuit. Find the impedance of the circuit by oscilloscope.<br />
49
ENGINEERING lAB 1<br />
8. Repeat step 5 to 7 for considering 10µF.<br />
9. Repeat step 5 to 7 by changing frequency 1kHz, 5kHz <strong>and</strong> 10kHz for 1µF<br />
capacitor. Record the results in Table 5-2.<br />
REPORT:<br />
1. Compare the frequency of the wave determined from the oscilloscope with the<br />
mentioned value on the function generator in step 2 of the procedure.<br />
2. Calculate the rms value of the voltage observed in step 2 of the procedure <strong>and</strong><br />
compare with that measured in step 3.<br />
3. How does the time period vary when the frequency of the wave is changed in<br />
step 4<br />
4. Calculate the magnitude of the impedance from the readings taken in step 6.<br />
5. Find the magnitude <strong>and</strong> the phase angle of the impedance from the readings<br />
taken in step 6 <strong>and</strong> 7.<br />
6. Find the magnitude <strong>and</strong> the phase angle of the impedance from the readings<br />
taken in step 7.<br />
7. Find apparent power, true/average power <strong>and</strong> reactive power for both the<br />
capacitive circuits using Volt-Ampere method <strong>and</strong> also by using oscilloscope.<br />
50
ENGINEERING lAB 1<br />
Table of Results<br />
Nominal<br />
values<br />
R=0.1kΩ<br />
1kHz C=1µF<br />
10 Vpp R=0.1kΩ<br />
C=10µF<br />
Meas.<br />
values<br />
R=<br />
C=<br />
R=<br />
C=<br />
V R VS I T<br />
<strong>Phase</strong><br />
angle<br />
Power<br />
Factor<br />
P A<br />
P T<br />
5kHz<br />
10 Vpp<br />
10kHz<br />
10 Vpp<br />
Nominal<br />
values<br />
R=0.1kΩ<br />
C=1µF<br />
R=0.1kΩ<br />
C=1µF<br />
Table 5-1 Measured Values<br />
Meas.<br />
values<br />
V R<br />
V<br />
<strong>Phase</strong><br />
C I T<br />
angle<br />
R=<br />
C=<br />
R=<br />
C=<br />
Power<br />
Factor<br />
P A<br />
P T<br />
Table 5-2 Measured Values<br />
Resistance<br />
Ω<br />
(nominal<br />
value)<br />
Capacitance<br />
uF (nominal<br />
value)<br />
Distance<br />
between Zero<br />
points<br />
d cm.<br />
Width of<br />
Sine wave<br />
D cm<br />
<strong>Phase</strong> angle<br />
(calculated)<br />
θ degree<br />
Power factor<br />
%<br />
(calculated)<br />
100 1<br />
100 10<br />
Table 5-3 Measured Values<br />
45