Kirchoff's Voltage and Current Laws
Kirchoff's Voltage and Current Laws
Kirchoff's Voltage and Current Laws

You also want an ePaper? Increase the reach of your titles
YUMPU automatically turns print PDFs into web optimized ePapers that Google loves.
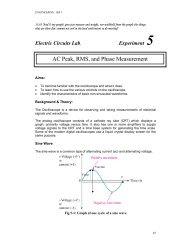
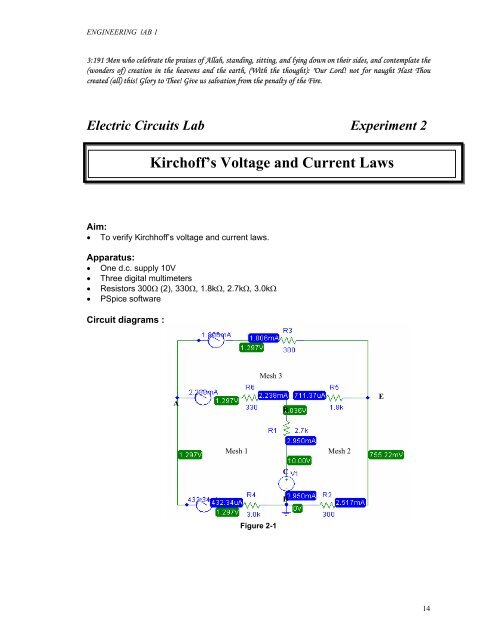
ENGINEERING lAB 13:191 Men who celebrate the praises of Allah, st<strong>and</strong>ing, sitting, <strong>and</strong> lying down on their sides, <strong>and</strong> contemplate the(wonders of) creation in the heavens <strong>and</strong> the earth, (With the thought): "Our Lord! not for naught Hast Thoucreated (all) this! Glory to Thee! Give us salvation from the penalty of the Fire.Electric Circuits Lab Experiment 2Kirchoff’s <strong>Voltage</strong> <strong>and</strong> <strong>Current</strong> <strong>Laws</strong>Aim:• To verify Kirchhoff’s voltage <strong>and</strong> current laws.Apparatus:• One d.c. supply 10V• Three digital multimeters• Resistors 300Ω (2), 330Ω, 1.8kΩ, 2.7kΩ, 3.0kΩ• PSpice softwareCircuit diagrams :Mesh 3ABEMesh 1 Mesh 2CDFigure 2-114
ENGINEERING lAB 1Method:(a) Kirchhoff’s <strong>Voltage</strong> Law :1. Measure the resistance of each resistor. Set the supply voltage to 10V. Record themeasured values in Table 2-1a.2. Construct the circuit shown in Figure 2-13. Commence at point A <strong>and</strong> measure the potential difference between each successivepair of lettered terminals for Mesh 1. i.e A-B, B-C , C-D <strong>and</strong> D-A. (Note :DMM’s probeshave to placed consistently.)4. Record down the measured values in Table 2-1b.5. Measure the potential difference for the points AC, CE <strong>and</strong> EA. Verify kirchoff’s voltagelaw using the displayed values. (Note that V CA is actually V C – V A ). What can be deducedfrom this condition? Record the measured values in Table 2-1c.(b) Kirchhoff’s <strong>Current</strong> Law:6. Measure the branch currents entering node A by placing ammeter as shown in Figure 2-1.7. Record the magnitude <strong>and</strong> the direction of the current as indicated by each ammeter inTable 2-2.Analysis, deductions <strong>and</strong> conclusion:1. Has Kirchhoff’s laws been verified? What facts determined for the results of this testsupport this decision?2. Do the test results compare favorably with those simulated by PSpice? What could besome of the causes for the discrepancies?3. Are there any circuit configurations for which Kirchhoff’s laws are not applicable?Substantiate your answer.4. For what type of circuit configurations would it be prudent not to apply Kirchhoff’s laws?Pspice Analysis 11. Utilising measured values of resistors <strong>and</strong> supplies, construct a schematic diagram forFigure 2.1. Display the voltages <strong>and</strong> current values using P-Spice. Verify Kirchoff’svoltage law. Record your results <strong>and</strong> find the relative error.2. Tips:By inserting the current probes as in the schematic, desired results can be obtained fromthe output.From the schematic window, you can obtain PSpice outputAnalysis tab –> Examine Output. Study the output.Note the sign for the branch currents.Double clicking the IPROBE to acquire the part’s name by enabling both boxes.Sample of output is as followsVOLTAGE SOURCE CURRENTS15
ENGINEERING lAB 1NAMEV_V1v_V2v_V3v_V4CURRENT-2.950E-03-2.238E-034.323E-041.806E-033. Record the magnitude <strong>and</strong> the direction (-ve-into node , +ve-out of node) of the currentsat each ammeter position. Using the values of the branch currents from the output, verifyKirchoff’s current law. Assign proper title to the schematic <strong>and</strong> thus output for submissionMarking SchemeInformation for each formatted categories must be provided as outlined in the introduction.II.III.III.IV.Valid plot (area enclosed must be bounded <strong>and</strong>symmetrical so as to cancel +ve & -ve areas) - 2 pts.Tabulated results - 2 pts.PSpice schematic with displayed results, <strong>and</strong> output - 4pts.Discussion <strong>and</strong> conclusion by attempting all questions - 2 pts.16
ENGINEERING lAB 1Table of ResultsMeasured components valuesV1 R1 R2 R3 R4 R5 R6Table 2-1aReferencepointsA-BB-CC-DD-APotentialDifference(V)Measured ValuesSign (+ or -)Table 2-1bTheoretical ValuesPotentialDifference(V)Sign (+ or -)ReferencepointsA-CC-EE-APotentialDifference(V)Measured ValuesSign (+ or -)Table 2-1cTheoretical ValuesPotentialDifference(V)Sign (+ or -)Resistance <strong>Current</strong> <strong>Current</strong> directionR3R4R6Table 2-214