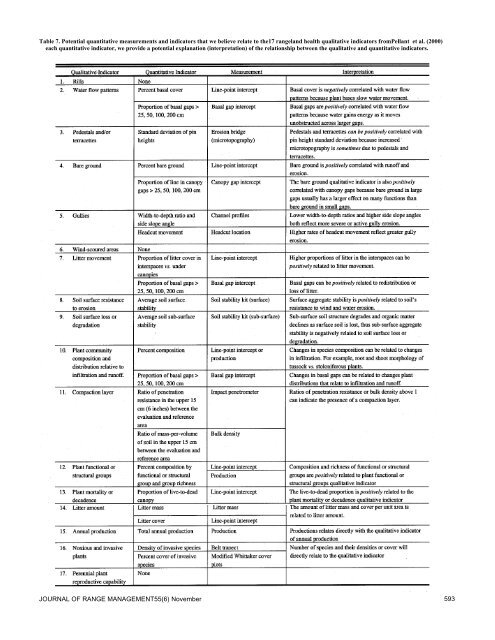
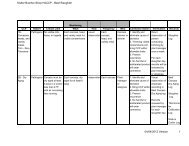
Table 7. Potential quantitative measurements <strong>and</strong> <strong>indicators</strong> that we believe relate to the17 rangel<strong>and</strong> <strong>health</strong> <strong>qualitative</strong> <strong>indicators</strong> fromPellant et al. (2000) each quantitative indicator, we provide a potential explanation (interpretation) of the relationship between the <strong>qualitative</strong> <strong>and</strong> quantitative <strong>indicators</strong>. JOURNAL OF RANGE MANAGEMENT55(6) November 593
decision systems <strong>and</strong> provide weightings <strong>for</strong> <strong>indicators</strong> have been proposed (Leininger et al. 1999, Weltz et al. 1999), but since this variation in importance of <strong>indicators</strong> exists, evaluators should not apply numerical values to indicator categories <strong>and</strong> determine an average rank <strong>for</strong> each attribute, nor should they rate the attribute based on the modal category (e.g., the category receiving the greatest number of <strong>indicators</strong>). Table 6 provides an example of how an evaluator might arrive at a different rating than would be achieved by a rank average. To calculate the average rank, each indicator category is given a whole number-ranked value <strong>and</strong> the category limits are established as the range of possible ranks divided by the number of categories. In our example, the 5 categories (None-to-Slight to Extreme) are assigned ranks from 1 to 5, respectively. The category limits among the 5 categories would have a 1.0 unit range (the range of 5 if we use 0.5 <strong>and</strong> 5.49 as the minimum <strong>and</strong> maximum, divided by the number of categories, 5). Thus, the average rank <strong>for</strong> each of the 3 <strong>attributes</strong> would be 2.3 <strong>for</strong> Soil <strong>and</strong> Site Stability, 3.6 <strong>for</strong> Biotic Integrity, <strong>and</strong> 2.5 <strong>for</strong> Hydrologic Function. Using the 1.0 category limits, Soil <strong>and</strong> Site Stability would be in the Slight-to-Moderate category (1.5 < 2.3 < 2.49), Biotic Integrity in the Moderate-to- Extreme (3.5 < 3.6 < 4.49), <strong>and</strong> Hydrologic Function narrowly falling in the Moderate category (2.5 = 2.5 < 3.49). For Soil <strong>and</strong> Site Stability, the rank average was one category different than the evaluator’s rating. Although this example shows the rank average’s summary as being closer to the None-to-Slight category than the evaluator’s summary, other examples could illustrate an opposite deviation. Since indicator weights have not been st<strong>and</strong>ardized <strong>and</strong> since the choice of a weighting system may influence the overall <strong>assessment</strong> (Weltz et al. 1999), we suggest that evaluators use tick marks or histograms <strong>for</strong> each category to create a frequency distribution of the <strong>indicators</strong> within each attribute to assist them in providing their <strong>assessment</strong> of each attribute (Table 6; Fig. 1). Consequently, the rationale regarding rankings should be recorded on the worksheet (Table 6b) to assist others in interpreting the evaluator’s attribute summaries. All worksheets <strong>and</strong> rating <strong>for</strong>ms should be retained to provide a record of the <strong>assessment</strong>. Intended Applications This approach was developed as a tool <strong>for</strong> conducting a moment-in-time <strong>qualitative</strong> <strong>assessment</strong> of rangel<strong>and</strong> status <strong>and</strong> as a communication <strong>and</strong> training tool <strong>for</strong> helping l<strong>and</strong> managers <strong>and</strong> other interested people to better underst<strong>and</strong> rangel<strong>and</strong> ecological processes <strong>and</strong> their relationship to <strong>indicators</strong>. The <strong>qualitative</strong> nature of this approach is the major reason why only experienced <strong>and</strong> knowledgeable people should conduct this technique. We believe an adequate knowledge of the ecological site <strong>and</strong> soils are necessary to interpret many of the <strong>indicators</strong>. People with experience in other ecosystems will likely require training <strong>and</strong> several years of experience to underst<strong>and</strong> the appropriate level of occurrence <strong>for</strong> <strong>indicators</strong> in new ecosystems. Analogous to the way rangel<strong>and</strong> condition provides a snapshot of vegetation similarity to a potential natural community, this approach provides a snapshot of ecosystem status relative to an expected status <strong>for</strong> l<strong>and</strong>s within the identified ecological site. Management should not be changed s o l e l y on the findings of this approach, but this approach may be used in conjunction with quantitative monitoring data that do provide a temporal <strong>assessment</strong> of trend, resource use records (livestock, recreation, etc.) <strong>and</strong> long-term weather in<strong>for</strong>mation to identify potential causes of current or historic changes in vegetation <strong>and</strong> soils. Others have reported on the potential <strong>for</strong> using earlier versions of this technique to assess trend of ecosystem status over time (Weltz et al. 1999), but at this moment, we are not recommending that people use this or any earlier version of this approach <strong>for</strong> measuring rangel<strong>and</strong> trend, the direction of change in rangel<strong>and</strong> status over time. Our opposition to such a use is based on 2 factors, our lack of repeated attribute ratings at a single location to determine the year-to-year variation in these ratings, <strong>and</strong> our belief that quantitative techniques are available that would provide better precision in determining rangel<strong>and</strong> trend. Although we oppose the use of this technique <strong>for</strong> determining rangel<strong>and</strong> trend, we do believe it is an excellent tool <strong>for</strong> identifying locations where monitoring should be conducted <strong>and</strong> <strong>for</strong> narrowing choices of variables to monitor. Potential c<strong>and</strong>idate locations <strong>for</strong> establishing quantitative monitoring plots are those locations where the <strong>qualitative</strong> procedure identified several <strong>indicators</strong> within an attribute with ratings of Moderate or greater deviation from that expected <strong>for</strong> the ecological site. At those sites, quantitative measurements <strong>for</strong> each identified indicator should be considered in a monitoring plan (Table 7). Several documents provide suggestions <strong>for</strong> quantitative monitoring protocols relating to these <strong>indicators</strong> as well as other more traditional rangel<strong>and</strong> monitoring procedures (Bonham 1989, Interagency Technical Team 1996, de Soyza et al. 1997, 2000, Herrick et al. 2002). This <strong>qualitative</strong> procedure evolved in part from the NRC (1994) approach that advocated a national <strong>assessment</strong> of rangel<strong>and</strong>s. However, we do not believe that individual site-specific <strong>assessment</strong>s that are used to evaluate rangel<strong>and</strong>s at a local scale should be combined into state or national <strong>assessment</strong>s without at least combining these <strong>qualitative</strong> <strong>attributes</strong> with quantitative data, stratifying the l<strong>and</strong>scape into hierarchical strata (e.g., ecological sites <strong>and</strong> major l<strong>and</strong> resource areas), <strong>and</strong> applying a statistically valid sampling method. This does not mean that this <strong>qualitative</strong> procedure cannot be used to provide a preliminary <strong>assessment</strong> of a management unit such as a pasture or an allotment. When evaluating a management unit, the manager should stratify the unit into ecological sites <strong>and</strong> topographic positions. Within each stratum, the manager should evaluate a sample of locations with this protocol. Each stratum should be summarized separately. A manager may use the distribution of attribute ratings within a stratum to develop an interpretation of the attribute’s status in that stratum <strong>and</strong> then use the complete set of strata summaries to write an interpretation of the preliminary management unit status. Modification <strong>and</strong> Future Development We do not believe this technique is final at this stage. The published technical reference indicates that the technique is version 3. The modified ecological reference worksheet presented in this paper documents the next iteration of this technique <strong>and</strong> we recommend that evaluators who use this modified reference worksheet <strong>and</strong> cite this paper. Modifications of the technical references will carry later version numbers. This reflects both continuity with earlier versions, <strong>and</strong> our belief that this technique will be modified in the future as new in<strong>for</strong>mation is incorporated. 594 JOURNAL OF RANGE MANAGEMENT 55(6) November 2002