Rangeland health attributes and indicators for qualitative assessment
Rangeland health attributes and indicators for qualitative assessment
Rangeland health attributes and indicators for qualitative assessment

You also want an ePaper? Increase the reach of your titles
YUMPU automatically turns print PDFs into web optimized ePapers that Google loves.
Evaluators must return to the evaluation<br />
area to complete the remaining steps. In<br />
Step 4, evaluators complete a canopy <strong>and</strong><br />
ground cover worksheet <strong>and</strong> a species<br />
dominance worksheet similar to those<br />
done on the ERA. In addition, evaluators<br />
complete the previous structural <strong>and</strong> functional<br />
grouping worksheet by estimating<br />
<strong>and</strong> recording the dominance category of<br />
each structural <strong>and</strong> functional group <strong>for</strong><br />
the evaluation area. Photographs <strong>and</strong><br />
quantitative data are again recommended<br />
to aid in future interpretations of the site’s<br />
status.<br />
Step 5 involves rating the 17 <strong>indicators</strong><br />
using the narrative descriptions <strong>for</strong> each<br />
indicator. These ratings are relative to the<br />
ecological site description <strong>and</strong> the ERA<br />
<strong>for</strong> the specific ecological site. Table 5<br />
includes an example. In Step 6, evaluators<br />
summarize the indicator ratings <strong>for</strong> each<br />
attribute <strong>and</strong> provide a summarized<br />
attribute rating <strong>for</strong> the site (Table 6).<br />
Indicator <strong>and</strong> attribute ratings in these last<br />
2 steps are based on their degree of departure<br />
from that expected based on the ecological<br />
site description or reference areas.<br />
We recognize that the relative importance<br />
of different <strong>indicators</strong> varies among ecological<br />
sites, but we do not believe <strong>indicators</strong><br />
can be properly weighted nor do we<br />
believe applicability of <strong>indicators</strong> <strong>for</strong> each<br />
ecological site can be determined <strong>for</strong> all<br />
ecological sites throughout the nation. In<br />
the future, this may be possible <strong>and</strong> these<br />
<strong>assessment</strong>s <strong>and</strong> comments may be helpful<br />
in determining such a weighting or application<br />
system.<br />
We recognize that this rating system<br />
appears to lend itself to numerical values<br />
or ranks that could be averaged <strong>and</strong><br />
weighted. Attempts to create numerical<br />
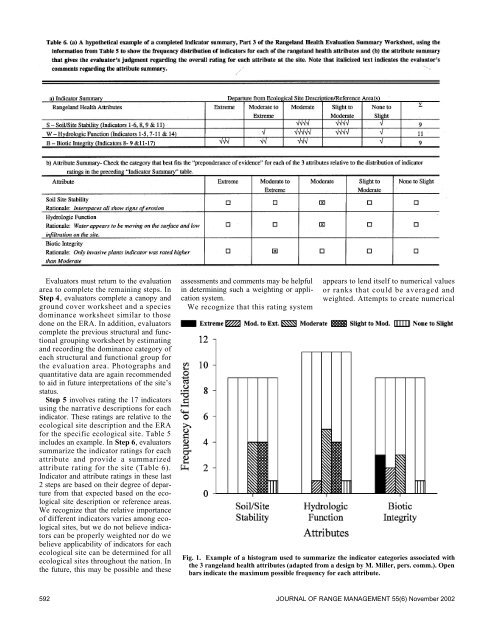
Fig. 1. Example of a histogram used to summarize the indicator categories associated with<br />
the 3 rangel<strong>and</strong> <strong>health</strong> <strong>attributes</strong> (adapted from a design by M. Miller, pers. comm.). Open<br />
bars indicate the maximum possible frequency <strong>for</strong> each attribute.<br />
592 JOURNAL OF RANGE MANAGEMENT 55(6) November 2002