Walkability Catchment - The Greenfield Tool Box
Walkability Catchment - The Greenfield Tool Box
Walkability Catchment - The Greenfield Tool Box

You also want an ePaper? Increase the reach of your titles
YUMPU automatically turns print PDFs into web optimized ePapers that Google loves.
<strong>Walkability</strong> <strong>Catchment</strong><br />
<strong>Greenfield</strong> <strong>Tool</strong> <strong>Box</strong><br />
DESIGN<br />
PROCESS.................. Evaluation Metric<br />
IMPLEMENTATION<br />
72<br />
Credit | Creative Commons | eluiscabrera<br />
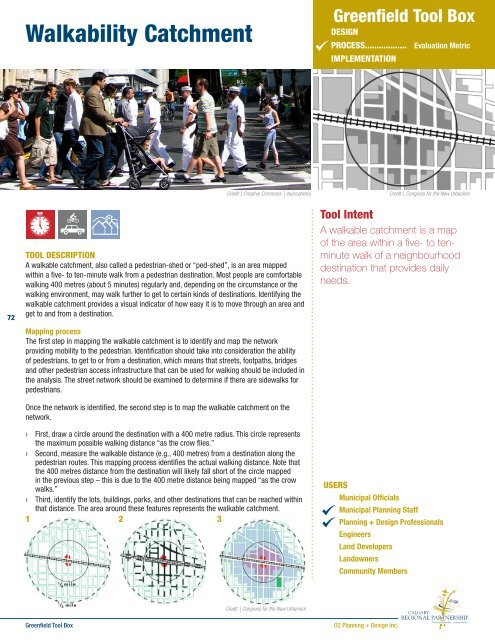
TOOL DESCRIPTION<br />
A walkable catchment, also called a pedestrian-shed or “ped-shed”, is an area mapped<br />
within a five- to ten-minute walk from a pedestrian destination. Most people are comfortable<br />
walking 400 metres (about 5 minutes) regularly and, depending on the circumstance or the<br />
walking environment, may walk further to get to certain kinds of destinations. Identifying the<br />
walkable catchment provides a visual indicator of how easy it is to move through an area and<br />
get to and from a destination.<br />
Mapping process<br />
<strong>The</strong> first step in mapping the walkable catchment is to identify and map the network<br />
providing mobility to the pedestrian. Identification should take into consideration the ability<br />
of pedestrians, to get to or from a destination, which means that streets, footpaths, bridges<br />
and other pedestrian access infrastructure that can be used for walking should be included in<br />
the analysis. <strong>The</strong> street network should be examined to determine if there are sidewalks for<br />
pedestrians.<br />
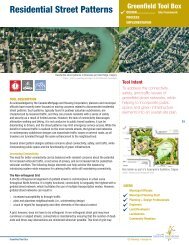
Once the network is identified, the second step is to map the walkable catchment on the<br />
network.<br />
› First, draw a circle around the destination with a 400 metre radius. This circle represents<br />
the maximum possible walking distance “as the crow flies.”<br />
› Second, measure the walkable distance (e.g., 400 metres) from a destination along the<br />
pedestrian routes. This mapping process identifies the actual walking distance. Note that<br />
the 400 metres distance from the destination will likely fall short of the circle mapped<br />
in the previous step – this is due to the 400 metre distance being mapped “as the crow<br />
walks.”<br />
› Third, identify the lots, buildings, parks, and other destinations that can be reached within<br />
that distance. <strong>The</strong> area around these features represents the walkable catchment.<br />
1 2 3<br />
Credit | Congress for the New Urbanism<br />
<strong>Tool</strong> Intent<br />
A walkable catchment is a map<br />
of the area within a five- to tenminute<br />
walk of a neighbourhood<br />
destination that provides daily<br />
needs.<br />
USERS<br />
Municipal Officials<br />
Municipal Planning Staff<br />
Planning + Design Professionals<br />
Engineers<br />
Land Developers<br />
Landowners<br />
Community Members<br />
Credit | Congress for the New Urbanism<br />
<strong>Greenfield</strong> <strong>Tool</strong> <strong>Box</strong><br />
O2 Planning + Design Inc.
32 Street East<br />
Range Road 293<br />
<strong>Walkability</strong> <strong>Catchment</strong><br />
This mapping process can be completed by hand on paper maps using a scale ruler and grid.<br />
It can also be automated using typical geographic information system (GIS) software. GIS can<br />
perform a cost-distance calculation along a road and path dataset (see sidebar example).<br />
Automated mapping is recommended, since it more reliability and faster than drawing by<br />
hand.<br />
Scoring method<br />
Once the walkable catchment is mapped, it can be scored. <strong>The</strong> score is calculated as the<br />
area within a five-minute walking distance (i.e, 400 m), expressed as a percentage of the<br />
maximum area that could be within a five-minute walk under ideal circumstances (i.e., the<br />
area within the circle with a radius of 400 m). Higher walkability is associated with a higher<br />
proportion of the maximum area; a good target is to have 60% of an area within a five-minute<br />
walk, or a ten-minute walk to a transit station.<br />
Destinations<br />
A walkable catchment can be mapped from any location. In using this tool to understand the<br />
completeness of a neighbourhood, consider destinations that offer goods and services that<br />
provide daily needs. This includes:<br />
› Bank<br />
› Child Care Facility<br />
› Community/civic centre<br />
› Convenience store<br />
› Grocery store<br />
› Hair care<br />
› Hardware store<br />
› Indoor recreation facility<br />
Some of these destinations might attract pedestrians from a farther distance than others.<br />
Different walkability radii can be applied to distinct destinations or land uses in urban areas<br />
based on their typical draw and appeal.<br />
Destination<br />
› Library<br />
› Live/work housing<br />
› Medical/dental office<br />
› Park<br />
› Pharmacy<br />
› Place of worship<br />
› Police/fire station<br />
› Post office<br />
› Laundry/dry cleaner<br />
› Restaurant<br />
› School<br />
› Senior car facility<br />
› Car share location<br />
› Transit stop<br />
Distance the average person is willing to walk to get to this<br />
destination<br />
LOCAL APPLICATIONS<br />
Foothills Composite High School <strong>Walkability</strong><br />
<strong>Catchment</strong>, Okotoks, AB<br />
549 Highway<br />
1600m<br />
Sheep River Drive<br />
Big Rock Trail<br />
Hunters Gate<br />
Westland Street<br />
Range Road 294A<br />
Riverside Way<br />
Westmount Way<br />
Crescent Road West<br />
Elizabeth Street<br />
800m<br />
Woodgate Road<br />
Westland Road<br />
Westridge Drive<br />
Westmount Road<br />
Tucker Link<br />
Woodhaven Drive<br />
400m<br />
Southridge Drive<br />
783 Highway<br />
Credit | O2 Planning + Design Inc.<br />
Knight Street<br />
n<br />
McRae Street<br />
South Railway Street<br />
Cimarron Way<br />
School<br />
Cimarron Drive<br />
Cimarron Trail<br />
Cimarron Grove Way<br />
7<br />
Oak Avenue<br />
Cimarron Boul evard<br />
Downey Road<br />
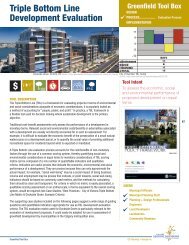
<strong>Walkability</strong> <strong>Catchment</strong><br />
0 - 400m (5 min.)<br />
400 - 800m (10 min.)<br />
800 - 1,600m (20 min.)<br />
1,600 - 3,200m (+20 min.)<br />
Stockton Point<br />
Crystalridge Drive<br />
North Railway Street<br />
Cimarron Springs Road<br />
Fisher Crescent<br />
S h e e p R i v e r<br />
This example illustrates the walkable catchment of Foothills<br />
Composite High School in Okotoks, AB, generated using a<br />
geographic information system (GIS). This example illustrates<br />
well the significant difference between mapping linear<br />
distance (“as the crow flies”, as shown by the red circles)<br />
and mapping based on actual routes (“as the crow walks”,<br />
as shown by the colored gradients). <strong>The</strong> latter technique<br />
provides a far more accurate picture of how accessible a<br />
neighbourhood really is. By using a GIS to produce a digital<br />
version of the analysis, the results can be easily shared in a<br />
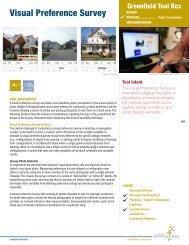
number of formats – the image below shows the results of<br />
the analysis brought into Google Earth, for example.<br />
32 Street East<br />
73<br />
Village square/Pocket park<br />
Neighbourhood park<br />
Grocery store<br />
Elementary school<br />
High school<br />
400 m<br />
800 m<br />
800 m<br />
1,500 m<br />
3,000 m<br />
Ideally, several destinations that provide daily needs within overlapping catchments will exist<br />
in a single neighbourhood. <strong>The</strong> kinds of destinations listed here typically serve small, local<br />
markets, which allow more than one of any type to operate within a walkable catchment. By<br />
mapping the walkable catchments of these kinds of destinations, the location of walkable<br />
clusters of destinations can be determined. Clusters allow multiple errands to be undertaken<br />
in a single trip, and can make walking a more worthwhile option.<br />
Credit | O2 Planning + Design Inc. | 2011 Google Earth TM<br />
WHEN IN THE PROCESS IT IS USED<br />
<strong>The</strong> walkable catchment tool can be is a used in several ways. It could be used during<br />
the site planning and design process, applied to assess different iterations of a site plan<br />
and inform revision of the overall community design. During public consultation, where<br />
several design proposals might be presented for discussion, the walkable catchment can be<br />
shown for multiple destinations on each proposal as a way to illustrate the relative degree<br />
of pedestrian “friendliness” of each. By using it to illustrate the accessibility of amenities,<br />
it could also be used as a way to market the new development to potential residents and<br />
tenants.<br />
<strong>Greenfield</strong> <strong>Tool</strong> <strong>Box</strong><br />
O2 Planning + Design Inc.
<strong>Walkability</strong> <strong>Catchment</strong><br />
POLICY SUPPORT<br />
Calgary Municipal Development Plan<br />
Transit-supportive density and uses policies<br />
b. Increase development densities in proximity of the Primary Transit Network by targeting<br />
residential and employment intensities within 400 metres of transit stops, in areas deemed<br />
appropriate through the Local Area Planning process and in accordance with the Typology<br />
thresholds identified in Part 3.<br />
CASE STUDIES | BEST PRACTICES<br />
Walkscore.org<br />
Walkscore automates the mapping and scoring process in a<br />
simple online tool. Given an address, the tool maps the extents<br />
of a five minute walk along street and pedestrian networks.<br />
<strong>The</strong> tool identifies the number and variety of daily-needs<br />
destinations within those extents. From this, it calculates<br />
an overall score on a scale of 0 to 100 for the address, with<br />
0 indicative of a “Car-Dependent” neighbourhood and 100<br />
indicating a “Walker’s Paradise”.<br />
Land use policies<br />
d. New communities should be organized to include the following:<br />
i. A number of distinct neighbourhoods that are defined by a 400-metre or five-minute<br />
walking distance from a NAC or Neighbourhood Corridor;<br />
Core Indicators for Land Use and Mobility<br />
Core Indicators Metric Baseline 60-year<br />
Target<br />
Accessibility to<br />
Primary Transit<br />
Network<br />
Per cent of population<br />
within 400 m of Primary<br />
Transit Network<br />
Per cent of jobs within<br />
400 m of Primary Transit<br />
Network<br />
LRT is the only transit service approaching<br />
Primary Transit levels of service in Calgary<br />
today.<br />
LRT is the only transit service approaching<br />
Primary Transit levels of service in Calgary<br />
today.<br />
45%<br />
67%<br />
72<br />
Okotoks Municipal Development Plan<br />
Neighborhood Design Targets<br />
In an effort to reduce demand on transportation infrastructure, decrease pollution, maintain<br />
air quality, reduce crime, and improve quality of life by placing work, recreation, and shopping<br />
opportunities closer to home, a mix of non-residential land uses and forms of residential<br />
dwellings in new neighbourhoods result in the following design targets<br />
› maximum distance between any given home and the nearest commercial shopping cell –<br />
20 minute walk. Maximum distance between any given home and the nearest off-street<br />
pathway system - 300 metres<br />
› maximum distance between any given home and neighbourhood recreation or facility<br />
opportunity in new cells - 15 minute walk<br />
› maximum distance between any given home and available industrial or other commercial<br />
employment cell - 20 minute walk<br />
Source | http://www.walkscore.com/<br />
RELATED TOOLS<br />
<strong>Walkability</strong> Audit<br />
Bikeability Audit<br />
Connectivity Index<br />
Residential Street Patterns<br />
<strong>The</strong> Neighbourhood Unit<br />
Block and Lot Standards<br />
ADDITIONAL RESOURCES<br />
Ped Shed Transportation Tech Sheet – Congress for the New Urbanism<br />
Process for Calculating Walkable <strong>Catchment</strong>s (http://www.cnu.org/sites/www.cnu.org/files/CNU_Ped_Sheds.pdf)<br />
Walking and Cycling – PedShed analysis (http://www.activehealthycommunities.com.au/content/walking-and-cycling-pedshed-analysis)<br />
Walkscore – online mapping tool that rates neighbourhood walkability (http://www.walkscore.com/)<br />
<strong>Greenfield</strong> <strong>Tool</strong> <strong>Box</strong><br />
O2 Planning + Design Inc.