Visual Preference Survey - The Greenfield Tool Box
Visual Preference Survey - The Greenfield Tool Box
Visual Preference Survey - The Greenfield Tool Box

Create successful ePaper yourself
Turn your PDF publications into a flip-book with our unique Google optimized e-Paper software.
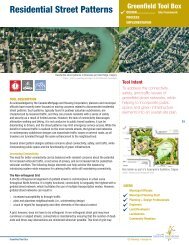
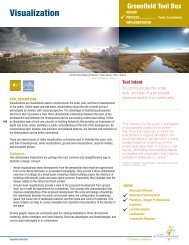
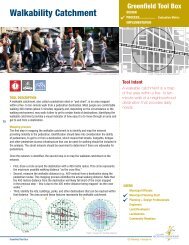
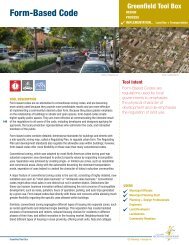
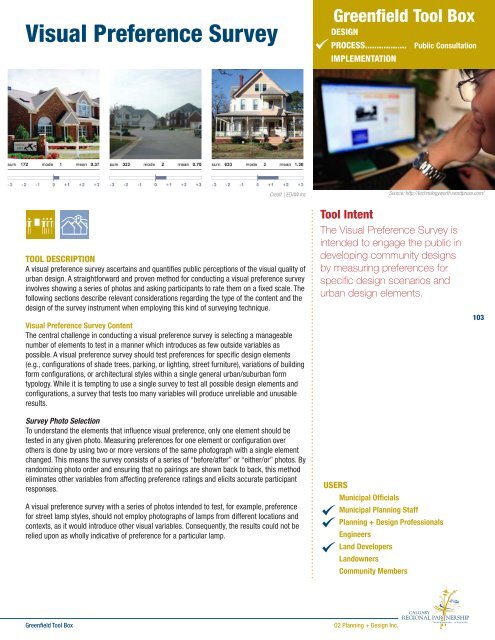
<strong>Visual</strong> <strong>Preference</strong> <strong>Survey</strong><strong>Greenfield</strong> <strong>Tool</strong> <strong>Box</strong>DESIGNPROCESS.................. Public ConsultationIMPLEMENTATIONCredit | EDAW IncSource: http://technologyworth.wordpress.com/TOOL DESCRIPTIONA visual preference survey ascertains and quantifies public perceptions of the visual quality ofurban design. A straightforward and proven method for conducting a visual preference surveyinvolves showing a series of photos and asking participants to rate them on a fixed scale. <strong>The</strong>following sections describe relevant considerations regarding the type of the content and thedesign of the survey instrument when employing this kind of surveying technique.<strong>Visual</strong> <strong>Preference</strong> <strong>Survey</strong> Content<strong>The</strong> central challenge in conducting a visual preference survey is selecting a manageablenumber of elements to test in a manner which introduces as few outside variables aspossible. A visual preference survey should test preferences for specific design elements(e.g., configurations of shade trees, parking, or lighting, street furniture), variations of buildingform configurations, or architectural styles within a single general urban/suburban formtypology. While it is tempting to use a single survey to test all possible design elements andconfigurations, a survey that tests too many variables will produce unreliable and unusableresults.<strong>Survey</strong> Photo SelectionTo understand the elements that influence visual preference, only one element should betested in any given photo. Measuring preferences for one element or configuration overothers is done by using two or more versions of the same photograph with a single elementchanged. This means the survey consists of a series of “before/after” or “either/or” photos. Byrandomizing photo order and ensuring that no pairings are shown back to back, this methodeliminates other variables from affecting preference ratings and elicits accurate participantresponses.A visual preference survey with a series of photos intended to test, for example, preferencefor street lamp styles, should not employ photographs of lamps from different locations andcontexts, as it would introduce other visual variables. Consequently, the results could not berelied upon as wholly indicative of preference for a particular lamp.<strong>Tool</strong> Intent<strong>The</strong> <strong>Visual</strong> <strong>Preference</strong> <strong>Survey</strong> isintended to engage the public indeveloping community designsby measuring preferences forspecific design scenarios andurban design elements.USERSMunicipal OfficialsMunicipal Planning StaffPlanning + Design ProfessionalsEngineersLand DevelopersLandownersCommunity Members103<strong>Greenfield</strong> <strong>Tool</strong> <strong>Box</strong>O2 Planning + Design Inc.
<strong>Visual</strong> <strong>Preference</strong> <strong>Survey</strong>SamplingResearch suggests that there is a difference between public and expert perceptions ofdesign. Undoubtedly, both perspectives offer something to the process and input from bothshould be included. If the visual preference survey is to be truly a measure of public visualpreference, it should rely on a representative sample of the population. <strong>The</strong> survey shouldabsolutely include, however, neighbors of the development and stakeholders, to inform thedesign based on the preferences of those with the most at stake over the long term with thefinal product.LOCAL APPLICATIONS<strong>Visual</strong> <strong>Preference</strong> <strong>Survey</strong>, Alberta Tourism,Parks, and Recreation<strong>The</strong> Government of Alberta Department of Tourism, Parks,and Recreation, has developed a visual preference surveymethodology for assessing preferences for scenic recreationand tourism landscapes. <strong>The</strong> same surveying techniques canbe easily adapted to assess visual preference for urban orsuburban form, design elements, and configurations.WHEN IN THE PROCESS IS IT USED?<strong>The</strong> visual preference survey is a public engagement tool for informing design and as suchshould be used at the beginning of the project.Source | http://www.municipaldevelopmentgroup.com/win09_006.pdf103Credit | O2 Planning + Design Inc.RELATED TOOLS<strong>Visual</strong>izationsCharretteADDITIONAL RESOURCESU.S. Department of Transportation, Federal Highway Administration/Federal Transportation Administration. “<strong>Visual</strong> <strong>Preference</strong> <strong>Survey</strong>s.” Chapter 4, Section C – Finding New Ways toCommunicate in Public Involvement Techniques for Transportation Decision Making. August 2002. (http://www.planning.dot.gov/PublicInvolvement/pi_documents/4c-g.asp | Accessed 22June 2011).Alberta Tourism, Parks, and Recreation. “Chapter 1: <strong>Visual</strong> <strong>Preference</strong> <strong>Survey</strong>.” In Scenic Resource Assessment of the North Saskatchewan Region. O2 Planning + Design Inc.: February2011.City of Chesapeake. Design Guidelines and <strong>Visual</strong> <strong>Preference</strong> <strong>Survey</strong> (http://www.chesapeake.va.us/services/depart/planning/pdf/design-guidelines/DesignGuidelines_060517_ResultsSummary.pdf)<strong>Greenfield</strong> <strong>Tool</strong> <strong>Box</strong>O2 Planning + Design Inc.