Introduction to Mining Geostatistics - Geovariances
Introduction to Mining Geostatistics - Geovariances
Introduction to Mining Geostatistics - Geovariances

You also want an ePaper? Increase the reach of your titles
YUMPU automatically turns print PDFs into web optimized ePapers that Google loves.
<strong>Introduction</strong> <strong>to</strong> <strong>Mining</strong> <strong>Geostatistics</strong><br />
F. RAMBERT, <strong>Geovariances</strong>, 49 bis av. Franklin Roosevelt, Avon,77212 France<br />
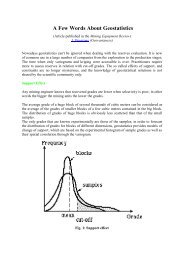
Below is a quick review of the many geostatistical <strong>to</strong>ols available <strong>to</strong> geoscientists nowadays, as well as a<br />
non-exhaustive list of typical fields of application in the <strong>Mining</strong> Industry.<br />
Geostatistical <strong>to</strong>ols<br />
<strong>Geostatistics</strong>, in combination with other statistical methods, offers a wide range of mathematical <strong>to</strong>ols that<br />
can be used <strong>to</strong> analyze, model, provide estimates and assess uncertainties, for different types of spatial<br />
features – e.g. grades or geological facies –<br />
<br />
Data <strong>Mining</strong><br />
Analysing in details the statistics and spatial correlation of the available data is always the key step of<br />
a geostatistical approach. For this purpose one can use the following <strong>to</strong>ols:<br />
Explora<strong>to</strong>ry Spatial Data Analysis (ESDA) consists in exploring the classical statistics as well as<br />
spatial statistics of one or several variables simultaneously, by means of His<strong>to</strong>grams, Cross-plots,<br />
QQ-plots, Variograms, etc. Linking these statistical graphs dynamically with data basemaps<br />
enables <strong>to</strong> further explore the data and assess the homogeneity of a population, the presence of<br />
outliers, etc.<br />
Variogram maps often help in finding the main directions of anisotropy of a phenomenon, while<br />
classical Experimental Variograms or Covariances are typically used <strong>to</strong> measure the spatial<br />
variability of the phenomenon in various directions.<br />
Principal Component Analysis (PCA) for multivariate statistical analysis.<br />
<br />
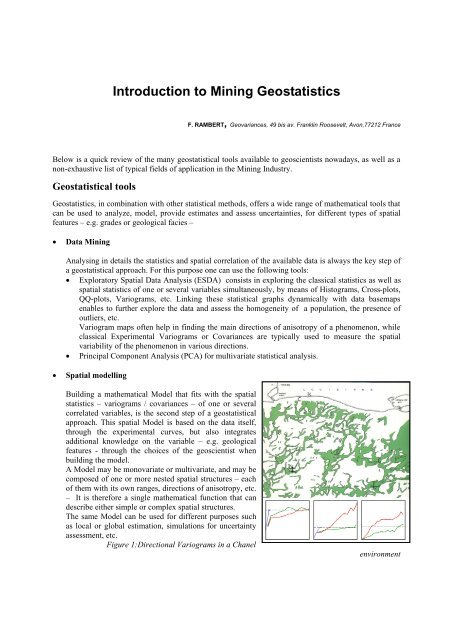
Spatial modelling<br />
Building a mathematical Model that fits with the spatial<br />
statistics – variograms / covariances – of one or several<br />
correlated variables, is the second step of a geostatistical<br />
approach. This spatial Model is based on the data itself,<br />
through the experimental curves, but also integrates<br />
additional knowledge on the variable – e.g. geological<br />
features - through the choices of the geoscientist when<br />
building the model.<br />
A Model may be monovariate or multivariate, and may be<br />
composed of one or more nested spatial structures – each<br />
of them with its own ranges, directions of anisotropy, etc.<br />
– It is therefore a single mathematical function that can<br />
describe either simple or complex spatial structures.<br />
The same Model can be used for different purposes such<br />
as local or global estimation, simulations for uncertainty<br />
assessment, etc.<br />
Figure 1:Directional Variograms in a Chanel<br />
environment
<strong>Introduction</strong> <strong>to</strong> <strong>Mining</strong> <strong>Geostatistics</strong>, RAMBERT F. 2<br />
<br />
<br />
Linear methods of Estimation<br />
The spatial Model can be used for estimation of a variable, using Kriging, the well-known method<br />
named after Dr Krige. In fact there are various kriging methods depending of how many variables are<br />
involved in the data & Model, how the mean of data is considered, <strong>to</strong> name a few: Ordinary Kriging<br />
(OK), Simple Kriging (SK), and Cokriging.<br />
Kriging can be applied on different supports – Point, Block, Polygon – and provides various<br />
numerical results at each target location:<br />
the Kriged Estimate, the most likely value of the variable on the Point, Block or Polygon<br />
the Standard Deviation of estimation, a measure of the local uncertainty attached <strong>to</strong> the estimate<br />
other auxiliary results – Slope Of Regression, Lagrange parameter, etc. –<br />
Kriging is designed <strong>to</strong> be the Best Linear Unbiased Estima<strong>to</strong>r - the difference between the true yet<br />
unknown values and the predicted values is equal <strong>to</strong> 0. “on average” – while simultaneaously<br />
providing the lowest variance of estimation.<br />
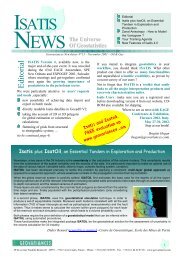
However, like any other linear interpola<strong>to</strong>r, Kriging is a smoothing process which does not reproduce<br />
the entire variability of the original phenomenon.<br />
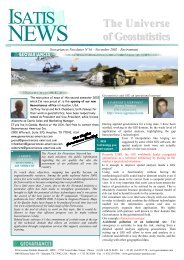
Distribution Modelling<br />
The experimental distribution – his<strong>to</strong>gram - of a variable can be modelled by mathematical functions,<br />
such as the Anamorphosis function. This Model of distribution can be used <strong>to</strong> switch between the Raw<br />
variable and its Gaussian counterpart, which is required by most geostatistical methods – e.g<br />
simulations, non-linear geostatistics – The Anamorphosis function has also the advantage of being<br />
able <strong>to</strong> take in<strong>to</strong> accout support effect & information effect. A first application is <strong>to</strong> predict the<br />
recovery of resources in relationship with the size of Selective <strong>Mining</strong> Units.<br />
Mean Grade<br />
2000<br />
1000<br />
0<br />
Experimental<br />
Point model<br />
5m x 5m block<br />
10m x 10m block<br />
20m x 20m block<br />
Total Tonnage<br />
100<br />
90<br />
80<br />
70<br />
60<br />
50<br />
40<br />
30<br />
20<br />
10<br />
20m x 20m block<br />
10m x 10m block<br />
5m x 5m block<br />
point model<br />
experimental<br />
0 500 1000 1500<br />
Cu<strong>to</strong>ff grade<br />
0<br />
0 500 1000 1500<br />
Cu<strong>to</strong>ff grade<br />
Figure 2. Selectivity Analysis through Tonnage & Mean Grade vs Cu<strong>to</strong>ff Grade<br />
<br />
Non-Linear methods of Estimation<br />
Since Kriging is a linear interpola<strong>to</strong>r which cannot be applied <strong>to</strong> solve non-linear problems – e.g.<br />
estimation of <strong>to</strong>nnage & grade above a given cu<strong>to</strong>ff, <strong>to</strong> assess Recoverable Resources - another family<br />
of estimation methods has been introduced <strong>to</strong> solve this problem. These non-linear methods are:<br />
Multiple Indica<strong>to</strong>r Kriging (MIK), Median Indica<strong>to</strong>r Kriging, Disjunctive Kriging (DK), Uniform<br />
Conditioning (UC), Lognormal Kriging & Service Variables.<br />
Geostatistical simulations can also be used <strong>to</strong> tackle this very problem.
<strong>Introduction</strong> <strong>to</strong> <strong>Mining</strong> <strong>Geostatistics</strong>, RAMBERT F. 3<br />
<br />
Simulations<br />
for continuous variables<br />
When one needs <strong>to</strong> assess the uncertainty attached <strong>to</strong> the prediction of a variable, or when realistic<br />
scenarii are required for post-processing algorithms – e.g simulation of production – the spatial Model<br />
can be used for simulation purpose rather than estimation.<br />
Unlike Kriging, Geostatistical Simulations are designed <strong>to</strong> generate a series of equiprobable realistic<br />
outcomes, each of these alternate models honoring the input data, the spatial Model as well as the<br />
data’s distribution Model.<br />
There are different Simulation algorithms that can be applied <strong>to</strong> continuous variables – e.g grades –<br />
such as: Sequential Gaussian Simulations (SGS) & Turning Bands (TB).<br />
Figure 3. Kriging estimates cannot reproduce the original variability of the data<br />
for categorical variables – facies –<br />
Other Geostatistical Simulation methods can be applied <strong>to</strong> categorical data – e.g. facies – in order <strong>to</strong><br />
generated a series of alternate geological models for instance. The main facies simulation methods are:<br />
Sequential Indica<strong>to</strong>r Simulations (SIS), Truncated Gaussian Simulations (TGS), Pluri Gaussian<br />
Simulations (PGS), Boolean Simulations and Object-based Simulations.<br />
<br />
Other geostatistical methods<br />
Although not so much applied in <strong>Mining</strong>, let us recall that other branches in geostatistics offer <strong>to</strong>ols <strong>to</strong><br />
improve the estimation or simulations of a variable by integrating auxiliary datasets - e.g seismic<br />
campaigns, remote sensing images, etc. – or <strong>to</strong> take in<strong>to</strong> account Drifts for non-stationary phenomena.<br />
Let’s just mention a few: Collocated Cokriging (CCK) & External Drift Kriging (EDK), Kriging with<br />
non-stationary models, Fac<strong>to</strong>rial Kriging.<br />
<strong>Mining</strong> Applications<br />
Here is a non-exhaustive list of common applications of geostatistics in the <strong>Mining</strong> Industry, and although<br />
presented from Exploration through Production, it is clearly not a “workflow” but merely a collection of<br />
usual applications - some tasks such as ESDA and spatial Modelling are obviously involved at all stages -<br />
At the Exploration / Pre-feasibility stage
<strong>Introduction</strong> <strong>to</strong> <strong>Mining</strong> <strong>Geostatistics</strong>, RAMBERT F. 4<br />
<br />
<br />
<br />
<br />
<br />
In the early stage of exploration ESDA is a major task: it helps finding potential outliers, defining<br />
the groups of correlated variables, analysing statistics per domain, etc.<br />
variography itself helps in better understanding the geometrical configuration of the<br />
mineralization, which can be used as a guide for designing optimal drilling patterns.<br />
Kriging is used <strong>to</strong> build a first Block Model and estimate in-situ resources, as well as the Global<br />
Recoverable Resources of the prospect.<br />
Testing sampling strategies helps assessing the impact of sampling patterns on the reduction of<br />
uncertainty in the Resource Estimates.<br />
Facies Simulations – e.g. PluriGaussian – can be used for building a geological frame consistent<br />
with drillhole facies observations and the Geologist’s conceptual model of the Orebody.<br />
Simulated facies could be used in the definition of domains, which in turn could be used <strong>to</strong> control<br />
the resource estimation process.<br />
<br />
At the Feasibility stage<br />
ESDA & spatial Modelling, based on new input data<br />
Evaluation of the impact of Selective <strong>Mining</strong> Unit (SMU) dimensions on the Reserves<br />
Non-linear methods (MIK, DK, UC) are used <strong>to</strong> evaluate Reserves more precisely, based on a<br />
given SMU size and economic grade cut-off.<br />
Geostatistical conditional Simulations may be used <strong>to</strong> assess the uncertainty associated with the<br />
Reserves Evaluation. The simulations provide a range of potential reserves for the orebody’s<br />
Tonnage, Metal Quantity and Recovered Grade.<br />
The estimation of local Confidence Intervals can be used for the Classification of Resources in<strong>to</strong><br />
Measured, Indicated & Inferred catergories.<br />
<br />
In Production<br />
ESDA & spatial Modelling, based on new input data<br />
Grade Control is improved by optimizing the pattern of production sampling<br />
As the development goes on, SMU or S<strong>to</strong>pe grades are re-evaluated with the local production<br />
sampling information. This updated grade model is used for short-term, medium-term or even<br />
long-term mine planning, <strong>to</strong> minimize the grade variability at the plant – e.g directly at mill head,<br />
or by s<strong>to</strong>ckpiling –<br />
The actual grades sampled at the plant can also be compared with the grades predicted in the<br />
Resource Model for a reconciliation exercise.<br />
Conclusion<br />
<strong>Geostatistics</strong>, which originated in the <strong>Mining</strong> industry with the works of Dr Krige followed by the<br />
mathematical framework setup by Pr Matheron, is definitely widely used for Mineral Resource Evaluation<br />
and Production. It offers a wide range of analysis and s<strong>to</strong>chastic modelling <strong>to</strong>ols which have been<br />
developed over the years <strong>to</strong> solve practical problems, and it is now commonly used in combination with<br />
deterministic methods which are found in Geomodellers.<br />
References<br />
Armstrong M. & Matheron G. (1987). Geostatistical Case Studies. Reidel, Dordrecht<br />
Isaaks EH & Srivastava RM. (1989). Applied <strong>Geostatistics</strong>. Oxford University Press, Oxford<br />
Chiles JP & Delfiner P. (1999). <strong>Geostatistics</strong>, Modeling Spatial Uncertainty. Wiley Interscience, New York