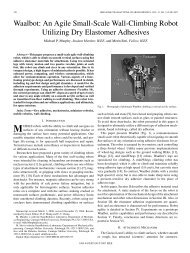
View - NanoRobotics Lab - Carnegie Mellon University
View - NanoRobotics Lab - Carnegie Mellon University
View - NanoRobotics Lab - Carnegie Mellon University

Create successful ePaper yourself
Turn your PDF publications into a flip-book with our unique Google optimized e-Paper software.
A 6 mm diameter very smooth glass hemisphere (ISP Optics, QU-HS-6) attached to a<br />
load cell (Transducer Techniques, GSO-25) was moved vertically by a motorized stage<br />
(Newport, MFA-CC) with 100 nm resolution. The hemisphere was contacted to and<br />
retracted from the fiber array sample with a pre-specified preload force and a very slow<br />
speed (1 μm/s) to minimize any viscoelastic effects. The maximum tensile force during<br />
the glass hemisphere and fiber array separation (pull-off force) gave the adhesion, and the<br />
hysteresis area between the loading and unloading curves gave the dissipated energy<br />
between the loading and unloading of the fiber array. Dividing this dissipated energy by<br />
the maximum circular contact area during loading gave W 10 . During the force<br />
measurements, an inverted microscope (Nikon Eclipse TE200) is used to measure the real<br />
circular maximum contact area between the hemisphere and the fiber array.<br />
Adhesion and overall work of adhesion of 15x15 mm 2 area and 1 mm thick ST-<br />
1060 polyurethane fiber array samples and a 1 mm thick flat and smooth ST-1060 surface<br />
were measured on the glass hemisphere using the above setup. Here, the flat<br />
polyurethane surface was used as a control substrate to show the relative enhancement of<br />
P and W by structuring the same material as a cylindrical microfiber with flat spatulate<br />
tips. Since ST-1060 is also etched slightly during the final XeF 2 dry etching step in Fig<br />
1(d), flat sample was also exposed to XeF 2 for about 30 minutes to have the same surface<br />
roughness with the flat spatulate tip surface.<br />
Using the above setup, the fiber array and the glass hemisphere interface adhesion<br />
and overall work of adhesion are measured as shown in Fig. 3. Plots show the error bars<br />
measured from the force-distance data at two different locations on the fiber array for<br />
preloads up to 25 mN. Adhesion values saturate as preload increases, and the array of<br />
6