TM16 - Stream Flow Meter Manual - Waterra-In-Situ
TM16 - Stream Flow Meter Manual - Waterra-In-Situ
TM16 - Stream Flow Meter Manual - Waterra-In-Situ
- No tags were found...

You also want an ePaper? Increase the reach of your titles
YUMPU automatically turns print PDFs into web optimized ePapers that Google loves.
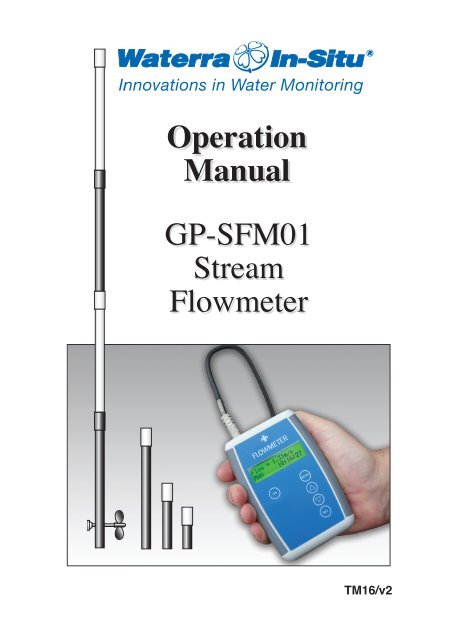
Operation<br />
<strong>Manual</strong><br />
GP-SFM01<br />
<strong>Stream</strong><br />
<strong>Flow</strong>meter<br />
<strong>TM16</strong>/v2
Be Aware – Be Safe<br />
Geopacks <strong>Flow</strong>meter<br />
Fieldwork Safety when working in streams or rivers<br />
There are a number of things to consider when carrying out work in streams or rivers.<br />
1. CHECK THE WEATHER FORECAST before you go out on fieldwork. <strong>In</strong> heavy<br />
rain rivers can rise quickly and what was a gentle trickle can become a torrent in a<br />
short space of time. Fast moving water which is higher than knee-deep can easily<br />
take you off your feet, especially if working on an uneven, or rocky river bed.<br />
2. WEAR THE RIGHT CLOTHING for the day. If you get wet (see 4 below too) then<br />
you will get cold. Cold is unpleasant and uncomfortable at best and a life<br />
threatening at worst (hypothermia). Always make sure you take enough clothing<br />
even in summer. You’ll be surprised how quickly you can get cold if you are wet,<br />
even on a summers day.<br />
3. NEVER WORK ALONE and always let someone else know WHERE you are<br />
working and your EXPECTED TIME OF RETURN.<br />
4. Moving water is powerful, and the banks of rivers may be undercut. CHECK THE<br />
STABILITY OF THE BANKS before you start working on the channel so you<br />
don’t fall in before you’ve even started!<br />
5. River beds can be very rough, or have a bed-load of boulders which can easily move<br />
underfoot. CHECK THE CHANNEL IS SAFE before stepping in to it. I remember<br />
nearly taking my eye out when I walked into the branch of a tree. Water can appear<br />
deceptively shallow at times. Check how deep it is before stepping into the channel.<br />
1
1.0 Key Components<br />
USB Cable<br />
Impeller Stick<br />
Handbook<br />
Protective Case<br />
for flowmeter<br />
Impeller Unit<br />
Electronic<br />
flowmeter<br />
Riser Rods<br />
1.1<br />
Impeller Stick<br />
The impeller stick is used for measuring water velocity and consists of:<br />
<br />
<br />
<br />
<br />
<br />
An IMPELLER and coupled SENSOR in which a<br />
switch opens and closes as the impeller is rotated by the<br />
flow of water<br />
Four 250 mm long tube sections which slot together to<br />
make a 1m stick<br />
Three “riser rods” which when slotted singly or in<br />
combination, allow the impeller to be elevated above<br />
the stream bed at fixed heights – 250mm, 125 mm and<br />
75 mm or combinations of these up to a maximum of<br />
450mm.<br />
A 1m long cable which connects to a flowmeter<br />
A USB cable which connects the flowmeter unit to a<br />
laptop or PC to allow data transfer. Data is stored as a<br />
CSV(comma-separated-values) file which can be used<br />
without modification in Excel, Word etc.<br />
2
1.2 Geopacks Advanced <strong>Flow</strong>meter Setup<br />
Before using the flowmeter you need to:<br />
Assemble the stream flow impeller (see page 2)<br />
<br />
<br />
<br />
<strong>In</strong>sert the jack plug from the flow impeller into the<br />
socket.<br />
Set up the meter with the date, time and the units which<br />
you wish to use for measuring (metres/sec or mph).<br />
Although not always necessary this action adds the date<br />
and time to your data file so you can track it later.<br />
<strong>In</strong>itiate motion of the sensor in the water<br />
ON<br />
Switch the instrument - the ON button also brings the flowmeter out of<br />
sleep mode (see page 7) Ge<br />
op<br />
ac<br />
ks<br />
or<br />
1. Remove the plastic tag from the battery compartment. The unit will display…<br />
de<br />
r<br />
co<br />
<strong>Flow</strong>meter 3<br />
de<br />
Geopacks 2011<br />
1.3 How to set up the flowmeter<br />
2. To start the meter press the MENU key. This will allow you to set the date<br />
and/or time for data logging purposes<br />
3. The meter will show a menu as follows<br />
Use the or arrow keys to<br />
scroll through the menu options<br />
Set Time<br />
Set Date<br />
Set Units<br />
Set Logging<br />
Finish<br />
4. The meter defaults to metres/sec as the units of measurement so if data logging is not<br />
required then press the<br />
arrow will display “FINISH”<br />
and pressing the<br />
SEL<br />
button will start the meter running.<br />
3
Setting the TIME<br />
5. Press the or arrow keys until Set Time is displayed then press<br />
SEL<br />
The display will now show 00:00:00 and should be set as a 24hour clock<br />
With the cursor under the tens of hours digit use the or keys to obtain the<br />
correct tens of hours and then confirm with<br />
The cursor will then move to the hours column. Repeat for units of hours, tens and units<br />
of minutes then press SEL Set Time and scroll to FINISH.<br />
Impe ler Stick<br />
L<br />
You do not need to set seconds, these will be automatically set to zero when you exit the<br />
menu system using the FINISH option.<br />
Setting the DATE<br />
6. Press the or arrow keys until Set Date is displayed then press<br />
SEL<br />
The display will now show Year 2000<br />
With the cursor under the tens of years digit use the or keys to obtain the<br />
correct tens of years and then confirm with<br />
SEL<br />
confirm.<br />
will also move the cursor to the desired location. Repeat for units of years and<br />
SEL<br />
When the year has been set the display will show Month Jan<br />
Use the or keys to select the required month and confirm with<br />
SEL<br />
The display will now show Day 01<br />
With the cursor under the tens of days digit use the or keys to obtain the<br />
correct tens of days and then confirm with<br />
SEL<br />
The cursor will then move to the days units column.<br />
4
Setting the RECORDING UNITS<br />
7. The meter defaults to metres per second (m/s) on power up.<br />
Press the or arrow keys until Set Units is displayed then press<br />
SEL<br />
The display will now show<br />
Units are<br />
m/s<br />
Use the or key to toggle between m/s and mph and confirm with<br />
SEL<br />
Setting up LOGGING<br />
To set up LOGGING press the or arrow keys until Set Logging is<br />
displayed then press<br />
SEL<br />
The display will now show <strong>Manual</strong> Log<br />
The meter will show a menu as follows<br />
Use the or arrow keys to<br />
scroll through the menu options<br />
<strong>Manual</strong> Log<br />
Auto Log<br />
Logging Off<br />
New Data<br />
Clear Data<br />
How these options work:<br />
a. <strong>Manual</strong> Log – the flowmeter will store the reading whenever the SEL button is<br />
pressed during normal operation. The reading is stored in a file called <strong>Flow</strong>data.csv<br />
which is accessible via the USB connection to a laptop or PC.<br />
To set up <strong>Manual</strong> Logging press the or arrow keys until <strong>Manual</strong><br />
Log is selected then press<br />
SEL<br />
The display will now show<br />
Set Logging<br />
5
. Auto Log – the flowmeter will store the reading at a programmed interval set by the<br />
user. The reading is stored in a file called <strong>Flow</strong>data.csv which is accessible via the<br />
USB connection to a laptop or PC. Note - removing the batteries without the meter<br />
being connected to a USB device will wipe any recorded data.<br />
To set up Auto Logging press the or arrow keys until Auto Log is<br />
selected then press<br />
SEL<br />
The display will now show<br />
Log <strong>In</strong>terval<br />
00 mins<br />
The cursor will be under the tens-of-units digit. Use the or buttons to<br />
select the required tens of minutes. Confirm with<br />
The display will now show<br />
Set Logging<br />
c. New Data – The logged data is stored as a “comma separated values file”. New Data<br />
simply starts a new line in the data file by inserting a Carriage Return (CR LF) to start<br />
a new line in the file for the new data.<br />
SEL<br />
To set up New Data press the or arrow keys until New Data is selected<br />
then press<br />
SEL<br />
The display will now show<br />
Set Logging<br />
d. Clear Data – Clear Data deletes ALL the data from the <strong>Flow</strong>data.csv file and sets the<br />
logging ‘file pointer’ back to zero. Be careful using this option.<br />
To Clear Data press the or arrow keys until Clear Data is selected then<br />
press<br />
SEL<br />
The display will now show Set Logging<br />
e. Logging Off – turns off all logging.<br />
To set Logging Off press the or arrow keys until Logging Off is<br />
selected then press<br />
SEL<br />
The display will now show Set Logging<br />
6
Finish setting up the <strong>Flow</strong>meter<br />
To complete the setup process and start the meter running select Finish using the<br />
or<br />
arrow keys until Finish is selected then press<br />
The display will now show… <strong>Flow</strong> = x.xx m/s<br />
MAN 10:34:01<br />
…or something similar<br />
The units displayed (m/s or mph) will reflect those selected. The logging mode will show<br />
MAN or AUTO, or remain blank if no logging is selected.<br />
Sleep Mode<br />
If the <strong>Flow</strong>meter detects no input for a period of 2 minutes the display will go blank and<br />
the meter will go to sleep to conserve power.<br />
Pressing the<br />
ON<br />
Ge<br />
button will restore operation. All settings and data are retained.<br />
USB Operation op<br />
To retrieve the<br />
ac<br />
logged data from the <strong>Flow</strong>meter plug the mini USB cable (supplied) into<br />
the <strong>Flow</strong>meter<br />
ks<br />
and a suitable PC or Laptop.<br />
or<br />
The meter will<br />
de<br />
display…<br />
r<br />
USB Detected<br />
co<br />
Connect<br />
de<br />
To connect to the computer press the<br />
SEL<br />
button. To disconnect remove the cable.<br />
The <strong>Flow</strong>meter appears on the computer as a very small flash drive named <strong>Flow</strong>meter.<br />
The drive contains a read-only file named <strong>Flow</strong>data.csv which contains the data for<br />
export to Excel (or any other application capable of using CSV files). If you are saving<br />
data from multiple meters onto a single PC then consider renaming each <strong>Flow</strong>meter.CSV<br />
file once it is downloaded to the PC before downloading the file from the new meter.<br />
Each meter will use the same file name for its CSV file so be careful not to overwrite one<br />
file with another. No attempt should be made to write to, delete, or format the<br />
flowmeter from a PC or all functions could be lost.<br />
The <strong>Flow</strong>meter can store just over 100 readings. After this the data needs to be<br />
downloaded and the CLEAR DATA option used to ready the meter for new logging.<br />
During logging an asterisk flashes on the display next to the MAN or AUTO<br />
indicators to show that data has been recorded. If there is no more space for data<br />
then the asterisk will NOT flash indicating no available space.<br />
Battery Condition<br />
The battery is tested at the point of waking up. A flashing “B” on the display indicates a<br />
low battery. Data is retained even when the battery is too low to operate the meter but it’s<br />
not stored for ever. When connected to a PC via the USB the power to the meter comes<br />
from the PC so it can be a convenient way to change the battery without loss of setup<br />
information.<br />
SEL<br />
7
2.0 Operating <strong>In</strong>structions<br />
2.1 Impeller Stick with the <strong>Flow</strong>meter<br />
Slot the rods of the IMPELLER unit<br />
together and point the impeller up into<br />
the flow of moving water at the required<br />
depth (Figure 1a).<br />
Use one or more of the three “riser” rods<br />
to elevate the impeller off the stream bed<br />
if necessary (figure 1b).<br />
Figure 1a Impeller Stick in the flow<br />
Figure 1b Using Riser Rods<br />
When the impeller is turning at the correct depth<br />
(which will depend on the purpose of your<br />
measurements), press the “SEL” button.<br />
The <strong>Flow</strong>meter will either record the velocity of the water<br />
SEL<br />
SEL<br />
at that point in time if set to MANUAL or start the timed<br />
recordings if set to AUTO LOG. To end an AUTO LOG<br />
session press<br />
and FINISH<br />
8
When <strong>Manual</strong> logging, a symbol will appear in the display when the button is pressed to<br />
acknowledge that data has been written to the data file. When Auto Logging, the same symbol<br />
will flash on briefly at every logging interval to show that readings are being taken.<br />
To ensure that it is clear which record is which if you are logging it to a data file (see above) it<br />
may be convenient to select “New Data” each time you move on to a new recording location.<br />
That will ensure that when you download the data you have each location (no matter how many<br />
readings) on one line when viewed in the data file.<br />
To set “New Data” press the MENU button (“Finish” will display) then press to get to<br />
Set Logging. Use the button to select “New Data” then SEL to confirm.<br />
<strong>In</strong> order to have a clear record of which readings are taken at which location, river depth etc we<br />
recommend using the field observation chart included in the Appendix. See Section 4 on page 12<br />
for further fieldwork information.<br />
9
3.0 <strong>Stream</strong> <strong>Flow</strong> Velocity<br />
3.1 Theoretical Background<br />
A moving fluid exhibits certain important features. The flow velocity of a fluid depends upon the<br />
cross-sectional area of the flow, the roughness of the surfaces it is passing over (friction) and<br />
upon the quantity of fluid, which passes through that area in unit time. This is known as the<br />
DISCHARGE and illustrates the ‘Principle of the Continuity of MASS’.<br />
Figure 2: River Cross-sections and <strong>Flow</strong> Velocity<br />
<strong>In</strong> the river channel depicted in Figure 2 the volume of water, which passes through section Y 1 in<br />
a second, is the DISCHARGE (Q) and will be given by:<br />
and similarly at section Y 2<br />
Q = a . b. V 1<br />
Q = c . d. V 2<br />
<strong>In</strong> these equations, a and c are the widths and b and d are the depths of the channel at the two<br />
sections, and V 1 and V 2 are the flow velocities. Since the same DISCHARGE (Q) passes through<br />
both of the sections then flow velocity relates to the difference between a . b and c . d (the crosssectional<br />
area) ; i.e. if the channel becomes either narrower or shallower then the flow velocity<br />
increases and vice versa.<br />
This principle explains many of the variations in the river channel morphology and in flow<br />
velocity. It is therefore important that this principle be understood by anyone undertaking<br />
serious fieldwork measurements in rivers. This could be demonstrated by measuring channel<br />
cross-sectional area discharge at a number of different sections along a short stretch of river.<br />
10
3.2 Describing <strong>Flow</strong>s<br />
To understand the flow characteristics within streams of moving water it is sometimes helpful to<br />
consider the flow in the form of STREAM LINES or VECTOR LINES.<br />
Figure 3 shows how <strong>Stream</strong> Lines depict possible paths of a single fluid particle.<br />
Figure 3<br />
<strong>Stream</strong> Lines in a flow around a meander<br />
Vector Lines represent both the flow direction and velocity. The longer and broader the line the<br />
greater the flow velocity. Vector lines convey useful information about the stream flow<br />
characteristics.<br />
Figure 4<br />
Vector Lines in a flow around meander<br />
<strong>In</strong> this diagram the short thin arrows represent the slower areas of the stream and the long, thick<br />
lines the regions of faster flow.<br />
11
3.3 Sediment Transport<br />
The amount of sediment and maximum particle size that can be transported by moving water is<br />
related to the flow velocity. Therefore, measurements of velocity obtained using the flowmeter<br />
can be used to determine the maximum size of sediment particles, which may be transported by<br />
the flow (Figure 5).<br />
Figure 5<br />
Erosion Velocities for Water<br />
Line 1<br />
Line 2<br />
The chart, which is referred to as the “Hjulstrom Curve”, has been derived from a mass of<br />
accumulated observed data, shows that for a given flow velocity there are a range of behavioural<br />
possibilities for sediment particles lying on the bed, or entrained within the flow, of a stream. For<br />
example, at a measured flow velocity of 100 cm/s (1 m/s) silt and sand (through not compacted<br />
clay) will be eroded from the stream bed and transported downstream (see Line 1). At the same<br />
velocity, all sediment particles finer than 1mm, which were already in motion, will continue in<br />
motion. Where the stream velocity falls below 10 cm/s (0.1 m/s), due to, say, a widening of the<br />
channel, sediment particles greater than 1mm diameter will be deposited (see Line 2).<br />
Thus, a stream flowmeter can be a valuable observation tool when used in sediment<br />
transportation studies. Observed flow velocities can be traced on the graph and the corresponding<br />
maximum particle size which can be transported at the velocity (the competence of the river), can<br />
be determined.<br />
12
4.0 Studying <strong>Stream</strong>s – Some fieldwork suggestions<br />
4.1 Recording <strong>Stream</strong> Velocity<br />
Equipment Needed:<br />
Geopacks stream flowmeter<br />
Measuring tape<br />
Ranging pole<br />
Clipboard and pen<br />
Field observation chart<br />
Watch<br />
Working in groups of two or three, students make rapid progress provided they work efficiently,<br />
know their objectives and have thoroughly prepared the ground. For example, one student works<br />
in, or above the stream with the meter while a second student uses a watch to note the time (and<br />
date) of the velocity recording. A third member of the group records the data, such as notes on<br />
the site, distance from the bank from which the measurements are being taken, also the depth of<br />
reading, recording time, and possibly, as a backup-plan to be on the safe side, the velocity.<br />
Measurements of the distance from the banks and the position of the meter in the stream are vital.<br />
For systematic collection of stream velocity data, the position of the meter readings should<br />
always be recorded with reference to one bank – DISTANCE OUT. For example, in larger<br />
channels, where stretching a tape across is impractical, this may be determined by attaching a<br />
tape to the waist or belt of the student working in the stream with the meter. By standing on the<br />
bank, and holding the tape out horizontally across the channel one person can determine the<br />
position of the meter from the bank.<br />
Figure 6 – Measuring “Distance Out” using tape attached to student’s belt<br />
<strong>In</strong> smaller channels it maybe more convenient to stretch the tape measure across the channel<br />
horizontally from the bank to bank. The ends of the tape can be attached to ranging poles on the<br />
bank or secured with heavy stones at each end.<br />
13
Figure 7 Measuring “Distance Out” using tape secured at each end<br />
Depth of measurement (DISTANCE DOWN) can easily be measured if the flowmeter tubes are<br />
simply calibrated beforehand using tape or water-resistant paint or ink, or more accurately, by<br />
taping a meter ruler to them. <strong>In</strong> estimating water depth please note that each section of the<br />
flowmeter stem is 250 mm long. Total water depth from surface to bed (sometimes called the<br />
WET READING) can be measured with the impeller stick if less than 1M. It is useful to have an<br />
elastic band or some other device on the impeller stick which can be moved up and down the<br />
stem to the water level. This allows a reasonably accurate estimate of depth to be made visually.<br />
Alternatively, if calculating the position of 0.6 of the depth (see section 4.3) for mean water<br />
column velocity measurement, the band can be moved to the appropriate position along the stem.<br />
14
4.2 Plotting the Channel Cross-Section<br />
This is essential for meaningful stream velocity recording. A plan or “map” of the stream crosssection<br />
at each point where measurements are to be made forms the basis for recording<br />
observations.<br />
One method of measuring and plotting the channel form is<br />
by stretching a tape measure across the channel as<br />
described above. Depths can be measured vertically down<br />
from the tautly stretched tape to the stream bed.<br />
Distance Dry Wet<br />
from Bank Reading Reading<br />
Total<br />
0m 0 cm 0cm 0cm<br />
0.25m 14 cm 3cm 17cm<br />
0.50m 14 cm 15cm 29cm<br />
0.75m 14 cm 22cm 36cm<br />
1.00m 14 cm 31cm 45cm<br />
1.25m 14 cm 35cm 49cm<br />
1.50m 14 cm 38cm 52cm<br />
1.75m<br />
Measurements of channel widths and depths are then<br />
recorded using data sheet provided. At regular<br />
intervals along the tape, two measurements should<br />
be noted. Firstly, the distance from the tape to the<br />
ground or water surface known as the DRY<br />
READING. Secondly, the WET READING should<br />
be recorded. This is the depth of the water at each<br />
point.<br />
This depth can be measured using the calibrated stem of the flowmeter, but more accurately by<br />
using a meter rule. The greater the number of measurements taken at each cross-section, the more<br />
accurate the representation of the channel, however, the closer the readings are together the<br />
longer it will take. <strong>In</strong> small channels, which are less than say 2 metres wide, a horizontal<br />
interval of 10cms would be workable. However, in a larger channel, maybe 5 or 6 metres across<br />
an interval of 20 or 25cms would give sufficient accuracy.<br />
Figure 8 – Measuring & Plotting the Channel Cross-Section<br />
15
4.3 Calculating <strong>Stream</strong> Discharge<br />
<strong>In</strong> section 3.1 it was demonstrated (Figure 2) that:<br />
DISCHARGE (Q) = Cross-Sectional Area x <strong>Flow</strong> Velocity<br />
So, if the cross section area of a channel was 1 m 2 and the rate of flow was measured at 1 m/s,<br />
then the Discharge Q would be 1 m 3 /s (1 cumec). If, after heavy rain the channel area increased<br />
to 2 m 2 and the flow velocity to 1.5 m/s then the discharge (Q) would be 3 m 3 /s or 3 cumec.<br />
Discharge is an important variable, unfortunately, it’s not always easy to measure.<br />
Figure 9a Semi-Circular Channel<br />
Figure 9b Rectangular Channel<br />
Calculating discharge in the case of either the semi-circular channel (Figure 9a) or the<br />
rectangular channel (Figure 9b) is relatively simple.<br />
<strong>In</strong> the semi-circular channel, if we take:<br />
Radius of Channel (r) = 1 m<br />
Cross-sectional area (Δ) = 2 2 = 1.57m 2<br />
Mean Velocity (V) = 1 m/s<br />
Discharge (Q) = Δ x V = 1.57 m 3 /s<br />
Similarly, in the rectangular channel, if the:<br />
Depth (d) = 1 m<br />
Width (w) = 1.5 m<br />
Cross-sectional area (Δ) = 1.5m 2<br />
Mean Velocity (V) = 1 m/s<br />
Discharge (Q) = Δ x V = 1.57 m 3 /s<br />
<strong>In</strong> a real-life situation, however, the channel geometry will be far from regular. However, there<br />
is a “work around” which allows fairly accurate estimates to be made of these channel variables<br />
with a minimum of calculation. Try this…<br />
Measured<br />
Width<br />
= as measured (in metres)<br />
Wet Readings<br />
= as measured (use metres – convert from cms if necessary)<br />
Velocity<br />
= as measured (metres per second)<br />
Calculated<br />
Mean Depth<br />
= the mean average of all wet readings taken (in metres)<br />
Cross Sectional Area = Width * Mean Depth (metres 2 )<br />
Wetted Perimeter = Width + (2 * Mean Depth)<br />
Hydraulic Radius = Cross Sectional Area / Wetted Perimeter (metres)<br />
Discharge<br />
= Cross Sectional Area * Velocity (metres 3 per second)<br />
16
Unfortunately, there remains the problem of measuring the flow velocity in the channel. Because<br />
of friction with the bed and banks (the WETTED PERIMETER) and because of internal<br />
turbulence, stream velocity varies from point to point. Large numbers of observations under<br />
controlled conditions suggest that in water depths of less than 0.6m, a reliable average velocity<br />
can be recorded at a point, which is 0.6 of the depth of the water below the surface. At this<br />
depth the faster surface flow is averaged out against the slower bed flow and this figure is an<br />
acceptable EMPIRICAL GUIDELINE (i.e. one derived from observation and experiment under a<br />
variety of circumstances).<br />
A quick way of finding 0.6 of the depth requires a special piece of equipment – a rubber band!<br />
Follow this simple procedure:<br />
Step 1<br />
Step 2<br />
Step 3<br />
Step 4<br />
Step 5<br />
Step 6<br />
Step 7<br />
Figure 11<br />
rest impeller base on stream bed.<br />
mark the water surface level with finger and thumb.<br />
removestick from the water keeping water surface mark.<br />
visually estimate (or measure) 0.4 of the distance down the stick<br />
between the water surface mark and the base.<br />
place a mark (e.g. rubber band) at this point.<br />
submerge the impeller stick to this point on the stem.<br />
the impeller will be approximately at the 0.6 of the depth from the surface<br />
down.<br />
Finding 0.6 of the depth<br />
But the problems aren’t over yet! <strong>In</strong> the semi-circular and rectangular channel sections shown in<br />
Figures 9a and 9b, an impeller placed in the centre of the channel at 0.6 of the depth, would give<br />
a reasonable average flow velocity. <strong>In</strong> the real-life section shown in figure 10b, the channel<br />
17
geometry is much less regular. Where should the mean velocity be measured The most likely<br />
choice would probably be in the vicinity of the label letter “A”<br />
Thus, if the flow velocity (V) at this point was recorded as being 1 m/s and with a crosssectional<br />
area of 1.45 m 2 then the DISCHARGE (Q) would be 1.45 m 3 / s<br />
To do the job properly however, it would be necessary to make a series of average flow velocity<br />
measurements, and this would require the channel cross-section to be subdivided into a series of<br />
columns like those in Figure 12.<br />
Figure 12 Constructing Water Columns in a <strong>Stream</strong> Cross-Section<br />
Figure 12 shows a stream cross-section which is 2 m wide. The section has been subdivided into<br />
columns (WATER COLUMNS) 0.25 m wide. According to the geometry of the channel, each<br />
column consists of a triangle and/or a rectangle. The area of each column has been calculated<br />
using the techniques described earlier and using the scale provided on the diagram. At an<br />
appropriate point within each column, the flow velocity would be measured with an impeller. A<br />
set of hypothetical velocities and the area measurements are displayed in Table 1, along with the<br />
calculations necessary to determine DISCHARGE (Q).<br />
Table 1<br />
Table of Measurements and Calculations for the Cross-Section<br />
Col.1 Col.2 Col.3 Col.4 Col.5 Col.6 Col.7 Col.8 Cols 1-8<br />
Area 1 0.00 0.07 0.12 0.22 0.23 0.19 0.13 0.00 0.96<br />
Area 2 0.07 0.06 0.03 0.00 0.00 0.02 0.02 0.11 0.31<br />
Area 1+2 0.07 0.13 0.15 0.22 0.23 0.21 0.15 0.11 1.27 Cross-Section area (M 2 )<br />
V 0.05 0.60 0.90 1.10 1.00 0.50 0.40 0.10 0.58 Mean Velocity (M/S)<br />
Q 0.00 0.08 0.14 0.24 0.23 0.10 0.06 0.01 0.86 Discharge (M/S 3 )<br />
<strong>In</strong> the Table, Area 1 refers to rectangles and Area 2 to triangles<br />
18
From the table:<br />
The total cross-sectional area has been calculated as 1.27 m 2<br />
The mean flow velocity through the section is<br />
0.58 m/s<br />
The total discharge (Q) through the section is 0.86 m 3 /s<br />
These procedures ensure that the best possible results are obtained from fieldwork. Once the hard<br />
work of surveying the channel section has been done, the profile can be used repeatedly under<br />
varying circumstances (e.g. before and after heavy rain) though adjustments for changes in depth<br />
and in-channel geometry due to erosion and deposition must be made. The exact position of the<br />
cross-section(s) must be fixed by inserting discrete stakes into the river banks.<br />
4.4 Plotting <strong>Flow</strong> Patterns within a <strong>Stream</strong><br />
Using the cross-section channel profile(s) constructed for discharge measurements (or survey<br />
some new sections), it is possible to collect data to illustrate the internal flow characteristics of<br />
channelled flow. There are a number of techniques, most common being the construction of<br />
ISOVELS or CHOROPLETHS. Isovels are lines joining points of equal velocity and<br />
Choropleths involve shaded areas of like and unlike velocity.<br />
Figure 13<br />
Showing internal flow patterns – Isovels (above) & Choropleths (below)<br />
Key: dark shades = high velocity; light shades = low velocity<br />
The isovels and choropleths represent lines and areas of equal velocity respectively. The highest<br />
velocity occurs usually in the centre of the channel near to the surface, while it is often lower<br />
nearer the bed and banks (Figure 13). However, the pattern displayed by the isovels and<br />
choropleths also reflects the shape of the channel i.e. its width, depth and symmetry (Figure 13).<br />
The spacing of the isovels and choropleths represents the velocity gradient.<br />
Both methods can be effective in showing internal flow patterns. The degree of refinement<br />
depends on the number of readings which are taken – the more the better. Three values must be<br />
collected at each point – distance out from one or other bank; depth; and velocity at that point.<br />
19
The stream cross-section must be surveyed as meticulously as for the calculation of discharge<br />
and readings are collected systematically in a transect across the stream channel. <strong>In</strong>stead of<br />
taking just one velocity reading 0.6 of the depth, a number of readings are taken at regular points<br />
within the water column.<br />
Figure 14<br />
Data collection grid for Isovel and Choropleth Construction<br />
<strong>In</strong> Figure 14, the “+” signs indicate the midpoint of each “cell” in the grid. Typically a grid<br />
would consist of cells 0.25 m wide and 0.125 m deep. The size is determined by the size and<br />
scale of the channel and degree of accuracy required.<br />
Table 2<br />
<strong>Stream</strong> Velocity Data collected in Cells<br />
<strong>Stream</strong> Velocity in m/s<br />
Depth Col.1 Col.2 Col.3 Col.4 Col.5 Col.6 Col.7 Col.8<br />
to 0.125 0.00 0.06 0.12 0.11 0.07 0.05 0.05 0.00<br />
to 0.25 0.00 0.09 0.17 0.10 0.10 0.05 0.06<br />
to 0.375 0.05 0.11 0.16 0.10 0.10 0.10 0.04<br />
to 0.5 0.00 0.09 0.12 0.09 0.08 0.04<br />
to 0.625 0.06 0.07 0.06 0.06<br />
Cells are 0.25 wide and 1.25m deep<br />
The data shown in this grid are ideally suited to constructing choropleths. For a representative<br />
and refined Isovel construction, at least twice as many velocity readings would be required<br />
(typically in a grid with 0.1 by 0.1 m cells).<br />
Geopacks publishes a computer software package called “River Channel Analysis” which not<br />
only plots choropleths from fieldwork data but also draws channel cross-sections and calculates<br />
discharge among a wide range of other functions. For details see Appendix III.<br />
20
5.0 Calibration<br />
Before shipment the impeller unit has been carefully calibrated under laboratory conditions. The<br />
formulae and graphs from what we call the Calibration Data which was essential for users of the<br />
earlier <strong>Flow</strong>meters. The latest <strong>Flow</strong>meter has the relevant calibration data built into electronics so<br />
that direct velocity data is generated in m/s or mph as selected.<br />
5.1 Pre –shipment Impeller Stick Calibration<br />
The impeller sticks have been calibrated in a flume where flow velocities can be strictly<br />
controlled by combined variations in discharge, gradient and weir height adjustments. <strong>Flow</strong> rate<br />
was monitored by a miniature Nixon electronic flowmeter and an Ott flowmeter. The formula<br />
required to convert counts per minute (C) recorded by the <strong>Flow</strong>meter to water velocity (V) in m/s<br />
is:<br />
Water Velocity (V) m/s = (0.000854C) + 0.05<br />
Alternative units can be calculated using the following conversion factors:<br />
m/s to kph x 3.60<br />
m/s to mph x 2.24<br />
m/s to ft/s x 3.28<br />
Values in this manual are given in metres per second (m/s).<br />
The chart below (Figure 15) shows the relationship between revolutions of the impellor and<br />
calculated velocity displayed on the meter. This is for information only.<br />
Figure 15<br />
Calibration Chart showing the relationship between revolutions of the impellor<br />
and Water Velocity<br />
21
Appendix I<br />
CARE OF YOUR FLOWMETER<br />
Check your equipment before you start work.<br />
BEFORE leaving for fieldwork check your equipment as follows:<br />
Switch on the meter by plugging the impeller jack-plug into the socket then use the ON<br />
switch to activate the meter.<br />
If nothing is displayed, check the batteries are correctly fitted. Batteries are accessed in<br />
the flowmeter by carefully removing the sliding panel on the back of the unit (take care<br />
not to lose the cover). Fit new batteries if necessary: always carry spares (Two by “AA”–<br />
average life several months depending on how often the meter is used). The battery is<br />
tested at the point of waking up. A flashing “B” on the display indicates a low battery, if<br />
you are out in the field and the “B” starts flashing then simply remove the batteries and<br />
put them straight back in again which will reset the charge chip and give several hours<br />
extra life. However removing the batteries will wipe any saved data unless the meter is<br />
connected to a USB device whilst the batteries are removed.<br />
Although your flowmeter has been designed for use by fieldwork parties under a wide range of<br />
conditions and is reasonably robust, it can be damaged by rough treatment or immersion in water.<br />
Should the meter be immersed in water, REMOVE the batteries IMMEDIATELY; the flow<br />
meter can be left open to dry in a warm room, do not attempt to open the meter compartment.<br />
Just remove the batteries, leave the battery panel off and leave it to dry slowly. <strong>In</strong> case of a<br />
serious dunking then, after removing the batteries, wipe dry with a towel and cover the meter<br />
entirely with dry rice and leave for 24 hours. The rice will absorb any moisture, discard the rice<br />
and replace the batteries.<br />
Should the flowmeter (impeller stick and/or meter) be damaged or otherwise malfunction we can<br />
repair/replace damaged parts at a very reasonable cost and will also provide repairs under<br />
guarantee where appropriate.<br />
Please telephone Geopacks on 0843 2160 456 and speak to customer services or email us on<br />
service@geopacks.com before returning the meter to the address below:<br />
GEOPACKS<br />
Unit 4A, Hatherleigh <strong>In</strong>dustrial Estate<br />
Holsworthy Road<br />
Hatherleigh<br />
Devon, EX20 3LP<br />
We can also customise your <strong>Flow</strong>meter for any special requirements.<br />
After each field session we recommend that the flowstick and impeller are rinsed in clean water<br />
and allowed to dry before being stored back in the carry case. Also, the batteries should be<br />
removed if the equipment is not being used for any length of time.<br />
YOUR FLOWMETER IS GUARANTEED AGAINST DEFECTS IN MATERIALS AND<br />
WORKMANSHIP FOR 12 MONTHS FROM THE DATE OF PURCHASE.<br />
22
Appendix II<br />
Field Observation Sheet<br />
Keep a log of your readings by river depth and distance from bank. Use this sheet to keep a track<br />
of the different sets of data that your meter will log so that you can use it in conjunction with the<br />
.csv file when back in the classroom.<br />
Enclosed – 1 laminated sheet – please photocopy as required.<br />
23
Appendix III<br />
Resources<br />
Geopacks manufacture and distribute a wide range of products associated with the flowmeter<br />
discussed in this manual. We have measuring tapes, stop watches, ranging poles, a wide range of<br />
other survey equipment as well as the more specialized items described below.<br />
Of particular interest are the following products – but be sure to ask for our full Geopacks<br />
catalogue. If you don’t already have a copy, our address and telephone number given in<br />
Appendix I.<br />
DVDs:<br />
“Studying Rivers, a Practical Approach” – a 60 minute compilation for teachers and students.<br />
Practical guidance in using the flowmeter to test simple hypotheses moving on to develop skills<br />
in plotting internal flow characteristics and undertake full scale discharge measurements. Based<br />
on fieldwork in South Wales but incorporating background material from other locations<br />
especially the Colorado Plateau area of the American South West.<br />
DVD Format; Geopacks order code ZDVD11<br />
“Studying Sediment in Motion, a Practical Approach” – 45 minutes of instruction and<br />
demonstration on how to measure sediment transportation in streams and in moving air using<br />
flowmeter/anemometers. Filmed on location in South Wales, the video aims at students in the 13<br />
to 18-age range of the UK education system (KS3 through GCSE to A level) through a series of<br />
staged experiments. Laboratory follow-up to fieldwork is especially emphasised in this<br />
compilation.<br />
DVD Format; Geopacks order code ZDVD10<br />
Computer Software:<br />
“Geopacks River Form & Channel Analysis” by Rick Cope. The Essential software tool for<br />
guiding, processing, presenting the fruits of your river based field studies. “Channel Analysis”<br />
has been written for Windows by Rick Cope, a geography teacher well known for his expertise in<br />
field studies. This is available in single user, 2 – 10 users, or 11+ users – see the Geopacks<br />
Software section on www.geopacks.com for further details.<br />
Some illustrations from “Channel Analysis” showing some of the opportunities it offers appear<br />
on the following pages.<br />
24
Using “Geopacks River Form & Channel Analysis”<br />
When depth data is gathered at regular intervals across the<br />
channel it is entered into a spreadsheet which works along<br />
the lines of a simplified version of Excel.<br />
Location is Distance from the starting bank in metres<br />
Dry is the distance from the tape to the surface of the<br />
water in cms<br />
Wet is the depth of the water in cms at that point<br />
Having entered this information,<br />
the cross-profile of the channel,<br />
the water as measured with the<br />
which is used to construct<br />
simply add the velocity of<br />
Geopacks <strong>Flow</strong>meter.<br />
Channel Analysis will then display the completed Cross Section together with calculated<br />
Channel Variables.<br />
25
When on fieldwork most people make use of technology, such as digital cameras, or the camera<br />
facility on a mobile phone, to record events or locations. It is possible to combine these images<br />
with the cross-section and velocity data to give a more complete record of the location in its<br />
geographical setting.<br />
It is often desirable to be able to compare changes in size, shape and capacity of the channel at<br />
different locations. Channel Analysis does this in the form of a “Multi Profile” display which<br />
allows the user to view up to 12 cross sections at a time (in 3 panels of 4 profiles). As with the<br />
single profile, any photo which is associated with that location is imported with the data (see<br />
photo icon).<br />
26
From this data it is possible to draw conclusions about the changes which may take place from<br />
one part of a river to another. These patterns, for any of the “channel variables”, can be<br />
displayed in the form of tables and associated charts.<br />
If a pattern appears to exist then it is useful to see whether it is by chance or if there is a<br />
statistically significant relationship between the variables. To do this geographers often use a<br />
technique called “correlation”. Channel Analysis does this with the press of a button and will<br />
display a “correlation matrix” covering all variables, and scatter-graphs if two variables require<br />
closer scrutiny.<br />
For more details about Channel Analysis (and other related fieldwork software packages) contact<br />
Geopacks on 0843 2160 456 or visit the website on www.geopacks.com<br />
27