Sample quiz 1 in PDF format. - Texas Tech University
Sample quiz 1 in PDF format. - Texas Tech University
Sample quiz 1 in PDF format. - Texas Tech University
- No tags were found...

You also want an ePaper? Increase the reach of your titles
YUMPU automatically turns print PDFs into web optimized ePapers that Google loves.
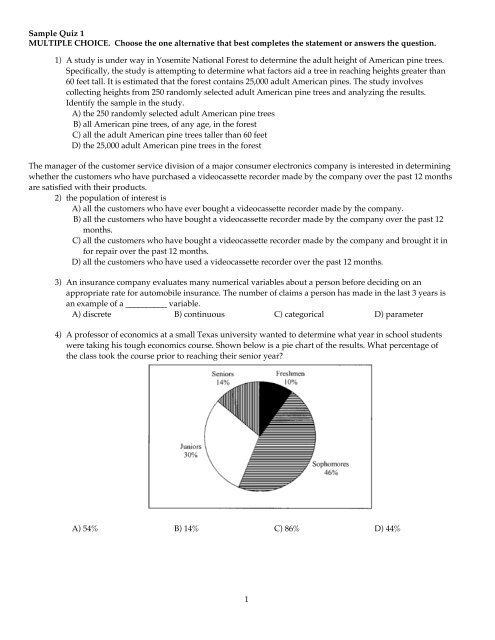
<strong>Sample</strong> Quiz 1<br />
MULTIPLE CHOICE. Choose the one alternative that best completes the statement or answers the question.<br />
1) A study is under way <strong>in</strong> Yosemite National Forest to determ<strong>in</strong>e the adult height of American p<strong>in</strong>e trees.<br />
Specifically, the study is attempt<strong>in</strong>g to determ<strong>in</strong>e what factors aid a tree <strong>in</strong> reach<strong>in</strong>g heights greater than<br />
60 feet tall. It is estimated that the forest conta<strong>in</strong>s 25,000 adult American p<strong>in</strong>es. The study <strong>in</strong>volves<br />
collect<strong>in</strong>g heights from 250 randomly selected adult American p<strong>in</strong>e trees and analyz<strong>in</strong>g the results.<br />
Identify the sample <strong>in</strong> the study.<br />
A) the 250 randomly selected adult American p<strong>in</strong>e trees<br />
B) all American p<strong>in</strong>e trees, of any age, <strong>in</strong> the forest<br />
C) all the adult American p<strong>in</strong>e trees taller than 60 feet<br />
D) the 25,000 adult American p<strong>in</strong>e trees <strong>in</strong> the forest<br />
The manager of the customer service division of a major consumer electronics company is <strong>in</strong>terested <strong>in</strong> determ<strong>in</strong><strong>in</strong>g<br />
whether the customers who have purchased a videocassette recorder made by the company over the past 12 months<br />
are satisfied with their products.<br />
2) the population of <strong>in</strong>terest is<br />
A) all the customers who have ever bought a videocassette recorder made by the company.<br />
B) all the customers who have bought a videocassette recorder made by the company over the past 12<br />
months.<br />
C) all the customers who have bought a videocassette recorder made by the company and brought it <strong>in</strong><br />
for repair over the past 12 months.<br />
D) all the customers who have used a videocassette recorder over the past 12 months.<br />
3) An <strong>in</strong>surance company evaluates many numerical variables about a person before decid<strong>in</strong>g on an<br />
appropriate rate for automobile <strong>in</strong>surance. The number of claims a person has made <strong>in</strong> the last 3 years is<br />
an example of a __________ variable.<br />
A) discrete B) cont<strong>in</strong>uous C) categorical D) parameter<br />
4) A professor of economics at a small <strong>Texas</strong> university wanted to determ<strong>in</strong>e what year <strong>in</strong> school students<br />
were tak<strong>in</strong>g his tough economics course. Shown below is a pie chart of the results. What percentage of<br />
the class took the course prior to reach<strong>in</strong>g their senior year<br />
A) 54% B) 14% C) 86% D) 44%<br />
1
5) Which of the follow<strong>in</strong>g is a cont<strong>in</strong>uous quantitative variable<br />
A) the color of a student's eyes<br />
B) the number of gallons of milk sold at the local grocery store yesterday<br />
C) the number of employees of an <strong>in</strong>surance company<br />
D) the amount of milk produced by a cow <strong>in</strong> one 24-hour period<br />
6) When study<strong>in</strong>g the simultaneous responses to two categorical questions, we should set up a<br />
A) cumulative percentage distribution table. B) histogram.<br />
C) cont<strong>in</strong>gency table. D) frequency distribution table.<br />
TABLE 2-4<br />
A survey was conducted to determ<strong>in</strong>e how people rated the quality of programm<strong>in</strong>g available on television.<br />
Respondents were asked to rate the overall quality from 0 (no quality at all) to 100 (extremely good quality). The<br />
stem-and-leaf display of the data is shown below.<br />
Stem Leaves<br />
3 24<br />
4 03478999<br />
5 0112345<br />
6 12566<br />
7 01<br />
8<br />
9 2<br />
7) Referr<strong>in</strong>g to Table 2-4, what percentage of the respondents rated overall television quality with a rat<strong>in</strong>g<br />
of 50 or below<br />
A) 0.11 B) 0.44 C) 0.40 D) 0.56<br />
TABLE 2-10<br />
The histogram below represents scores achieved by 200 job applicants on a personality profile.<br />
8) Referr<strong>in</strong>g to the histogram from Table 2-10, __________ percent of the job applicants scored below 50.<br />
A) 80% B) 60% C) 20% D) 50% E) 30%<br />
9) Referr<strong>in</strong>g to the histogram from Table 2-10, 90% of the job applicants scored above __________.<br />
A) 10 B) 90 C) 50 D) 30<br />
2
Answer Key<br />
Testname: SAMPLE_QUIZ1.TST<br />
MULTIPLE CHOICE. Choose the one alternative that best completes the statement or answers the question.<br />
1) A<br />
2) B<br />
3) A<br />
4) C<br />
5) D<br />
6) C<br />
7) B<br />
8) A<br />
9) A<br />
1