(ATBD) SMAP Level 1 Radar Data Products - NASA
(ATBD) SMAP Level 1 Radar Data Products - NASA
(ATBD) SMAP Level 1 Radar Data Products - NASA

You also want an ePaper? Increase the reach of your titles
YUMPU automatically turns print PDFs into web optimized ePapers that Google loves.
19<br />
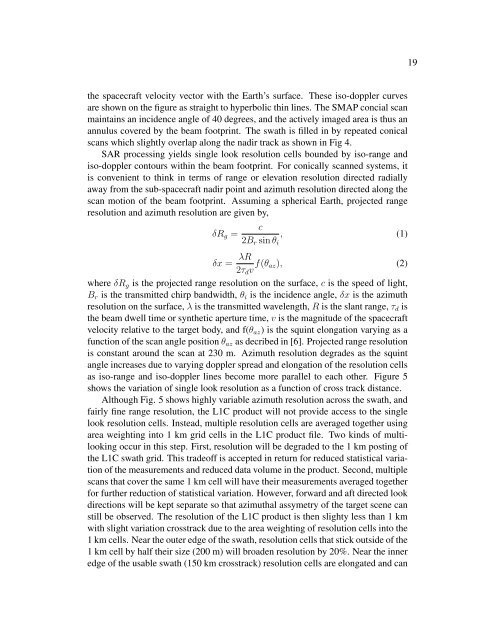
the spacecraft velocity vector with the Earth’s surface. These iso-doppler curves<br />
are shown on the figure as straight to hyperbolic thin lines. The <strong>SMAP</strong> concial scan<br />
maintains an incidence angle of 40 degrees, and the actively imaged area is thus an<br />
annulus covered by the beam footprint. The swath is filled in by repeated conical<br />
scans which slightly overlap along the nadir track as shown in Fig 4.<br />
SAR processing yields single look resolution cells bounded by iso-range and<br />
iso-doppler contours within the beam footprint. For conically scanned systems, it<br />
is convenient to think in terms of range or elevation resolution directed radially<br />
away from the sub-spacecraft nadir point and azimuth resolution directed along the<br />
scan motion of the beam footprint. Assuming a spherical Earth, projected range<br />
resolution and azimuth resolution are given by,<br />
δR g =<br />
c<br />
2B r sin θ i<br />
, (1)<br />
δx = λR<br />
2τ d v f(θ az), (2)<br />
where δR g is the projected range resolution on the surface, c is the speed of light,<br />
B r is the transmitted chirp bandwidth, θ i is the incidence angle, δx is the azimuth<br />
resolution on the surface, λ is the transmitted wavelength, R is the slant range, τ d is<br />
the beam dwell time or synthetic aperture time, v is the magnitude of the spacecraft<br />
velocity relative to the target body, and f(θ az ) is the squint elongation varying as a<br />
function of the scan angle position θ az as decribed in [6]. Projected range resolution<br />
is constant around the scan at 230 m. Azimuth resolution degrades as the squint<br />
angle increases due to varying doppler spread and elongation of the resolution cells<br />
as iso-range and iso-doppler lines become more parallel to each other. Figure 5<br />
shows the variation of single look resolution as a function of cross track distance.<br />
Although Fig. 5 shows highly variable azimuth resolution across the swath, and<br />
fairly fine range resolution, the L1C product will not provide access to the single<br />
look resolution cells. Instead, multiple resolution cells are averaged together using<br />
area weighting into 1 km grid cells in the L1C product file. Two kinds of multilooking<br />
occur in this step. First, resolution will be degraded to the 1 km posting of<br />
the L1C swath grid. This tradeoff is accepted in return for reduced statistical variation<br />
of the measurements and reduced data volume in the product. Second, multiple<br />
scans that cover the same 1 km cell will have their measurements averaged together<br />
for further reduction of statistical variation. However, forward and aft directed look<br />
directions will be kept separate so that azimuthal assymetry of the target scene can<br />
still be observed. The resolution of the L1C product is then slighty less than 1 km<br />
with slight variation crosstrack due to the area weighting of resolution cells into the<br />
1 km cells. Near the outer edge of the swath, resolution cells that stick outside of the<br />
1 km cell by half their size (200 m) will broaden resolution by 20%. Near the inner<br />
edge of the usable swath (150 km crosstrack) resolution cells are elongated and can