(ATBD) SMAP Level 1 Radar Data Products - NASA
(ATBD) SMAP Level 1 Radar Data Products - NASA
(ATBD) SMAP Level 1 Radar Data Products - NASA

You also want an ePaper? Increase the reach of your titles
YUMPU automatically turns print PDFs into web optimized ePapers that Google loves.
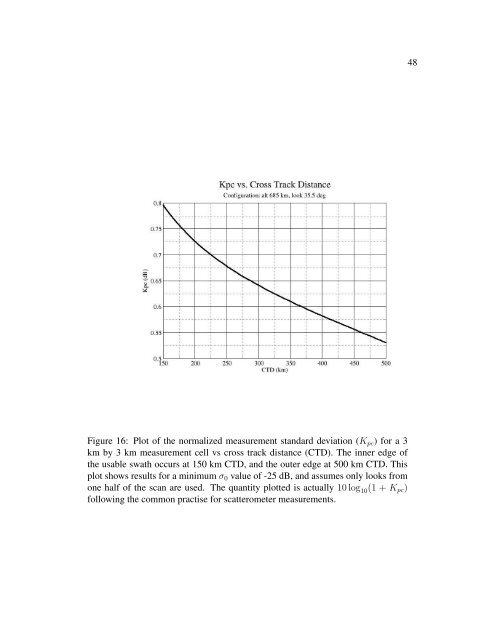
Figure 16: Plot of the normalized measurement standard deviation (K pc ) for a 3<br />
km by 3 km measurement cell vs cross track distance (CTD). The inner edge of<br />
the usable swath occurs at 150 km CTD, and the outer edge at 500 km CTD. This<br />
plot shows results for a minimum σ 0 value of -25 dB, and assumes only looks from<br />
one half of the scan are used. The quantity plotted is actually 10 log 10 (1 + K pc )<br />
following the common practise for scatterometer measurements.<br />
48