(ATBD) SMAP Level 1 Radar Data Products - NASA
(ATBD) SMAP Level 1 Radar Data Products - NASA
(ATBD) SMAP Level 1 Radar Data Products - NASA

Create successful ePaper yourself
Turn your PDF publications into a flip-book with our unique Google optimized e-Paper software.
51<br />
as the loop back measurement performed every PRI, and pre-launch temperature<br />
dependence models along with temperature measurement telemetry to remove gain<br />
and loss variations. Due to limited testing time and resources, it is not possible to<br />
guarantee that these models and corrections will work within requirements over the<br />
lifetime of the mission. It is expected that seasonal and longer term temperature<br />
variations, and component aging and degradation, will introduce long-term trends<br />
and biases into the σ 0 results. To reduce these effects below their error allocation,<br />
data will be collected over known stable target areas and then used to correct for<br />
long-term variability. The baseline reference target is part of the Amazon rain forest<br />
which has been used successfully by several past missions at both L-band and<br />
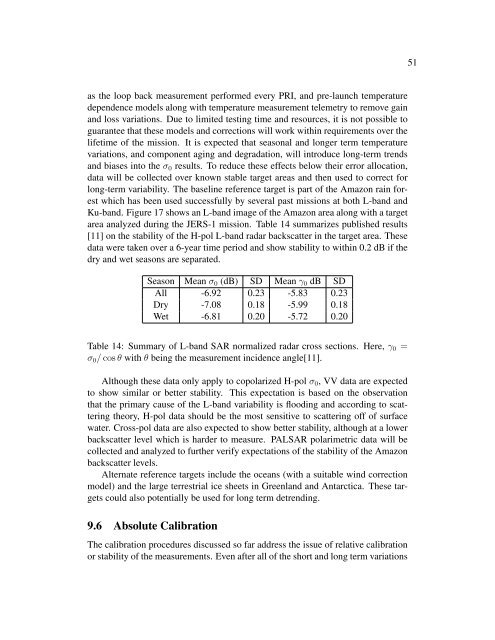
Ku-band. Figure 17 shows an L-band image of the Amazon area along with a target<br />
area analyzed during the JERS-1 mission. Table 14 summarizes published results<br />
[11] on the stability of the H-pol L-band radar backscatter in the target area. These<br />
data were taken over a 6-year time period and show stability to within 0.2 dB if the<br />
dry and wet seasons are separated.<br />
Season Mean σ 0 (dB) SD Mean γ 0 dB SD<br />
All -6.92 0.23 -5.83 0.23<br />
Dry -7.08 0.18 -5.99 0.18<br />
Wet -6.81 0.20 -5.72 0.20<br />
Table 14: Summary of L-band SAR normalized radar cross sections. Here, γ 0 =<br />
σ 0 / cos θ with θ being the measurement incidence angle[11].<br />
Although these data only apply to copolarized H-pol σ 0 , VV data are expected<br />
to show similar or better stability. This expectation is based on the observation<br />
that the primary cause of the L-band variability is flooding and according to scattering<br />
theory, H-pol data should be the most sensitive to scattering off of surface<br />
water. Cross-pol data are also expected to show better stability, although at a lower<br />
backscatter level which is harder to measure. PALSAR polarimetric data will be<br />
collected and analyzed to further verify expectations of the stability of the Amazon<br />
backscatter levels.<br />
Alternate reference targets include the oceans (with a suitable wind correction<br />
model) and the large terrestrial ice sheets in Greenland and Antarctica. These targets<br />
could also potentially be used for long term detrending.<br />
9.6 Absolute Calibration<br />
The calibration procedures discussed so far address the issue of relative calibration<br />
or stability of the measurements. Even after all of the short and long term variations