Worksheet for Exploration 31.5 - comPADRE
Worksheet for Exploration 31.5 - comPADRE
Worksheet for Exploration 31.5 - comPADRE

Create successful ePaper yourself
Turn your PDF publications into a flip-book with our unique Google optimized e-Paper software.
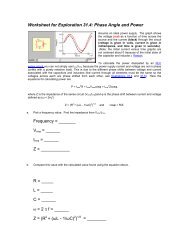
<strong>Worksheet</strong> <strong>for</strong> <strong>Exploration</strong> <strong>31.5</strong>: RL Circuits and Phasors<br />
Assume an ideal power supply. The graph shows the voltage as a<br />
function of time across the source (red), the resistor (blue), and the<br />
inductor (green) (voltage is given in volts and time is given in<br />
seconds). Restart.<br />
To analyze the currents and voltages in this circuit, notice that you<br />
cannot simply use V = I X along with the peak current values. You<br />
must account <strong>for</strong> the phase differences between the voltages and the<br />
currents. One way to account <strong>for</strong> the phase differences is to describe<br />
the voltage, current and reactance with phasors. Next to the circuit is<br />
an animation that shows the phasor representation of the circuit<br />
elements (this allows us to show the phase difference) where the<br />
inductor voltage (green) is π/2 ahead of the resistor voltage (blue).<br />
The magnitude of each vector is the peak voltage across the element.<br />
a. Since there is no phase shift between the resistor current and the voltage across the resistor, what<br />
would a phasor <strong>for</strong> the current look like in the phasor diagram<br />
b. Why is the phasor <strong>for</strong> the inductor π/2 ahead of the resistor voltage (i.e., the current through the<br />
circuit) (Hint: Does the inductor current lead or lag the voltage (see Illustration 31.4))<br />
c. How does the length of the inductor's phasor change as you change the frequency<br />
d. Why does the length change as a function of frequency
Notice that the phasors rotate at an angular speed of ω = 2 π f. The projection of any given voltage phasor<br />
on the y axis is the voltage across the circuit element at that time.<br />
e. Pause the animation and explain how you can tell that the phasor diagram matches the voltages across<br />
the different circuit elements shown in the graph. In other words, verify that the y component of the<br />
vector in the phasor animation matches the value of the voltage shown on the graph.<br />
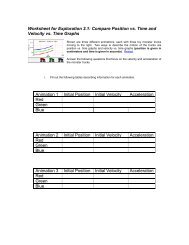
Frequency = _________<br />
Time<br />
y-component of vectors Voltage<br />
Source inductor resistor source inductor resistor<br />
From the vectors on the phasor diagram, we can develop a connection between the peak (or rms) voltage<br />
and the peak (or rms) current, where V 0 = I 0 Z and the phase difference between the voltage and current is<br />
given by φ. On the phasor diagram, V 0 (the source voltage-red) is the vector sum of the two voltage<br />
vectors (resistor-blue, and inductor-green) and φ is the angle between V 0 and the current (in the same<br />
direction as the resistor voltage phasor on the diagram). <strong>Exploration</strong> 31.6 develops the use of phasors <strong>for</strong><br />
RLC circuits.