Sustainable End-of-Life Options for Plastics in New Zealand
Sustainable End-of-Life Options for Plastics in New Zealand
Sustainable End-of-Life Options for Plastics in New Zealand

Create successful ePaper yourself
Turn your PDF publications into a flip-book with our unique Google optimized e-Paper software.
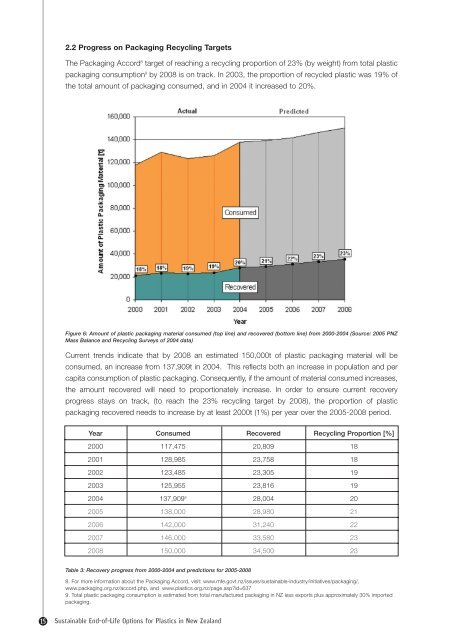
2.2 Progress on Packag<strong>in</strong>g Recycl<strong>in</strong>g Targets<br />
The Packag<strong>in</strong>g Accord 8 target <strong>of</strong> reach<strong>in</strong>g a recycl<strong>in</strong>g proportion <strong>of</strong> 23% (by weight) from total plastic<br />
packag<strong>in</strong>g consumption 9 by 2008 is on track. In 2003, the proportion <strong>of</strong> recycled plastic was 19% <strong>of</strong><br />
the total amount <strong>of</strong> packag<strong>in</strong>g consumed, and <strong>in</strong> 2004 it <strong>in</strong>creased to 20%.<br />
Figure 6: Amount <strong>of</strong> plastic packag<strong>in</strong>g material consumed (top l<strong>in</strong>e) and recovered (bottom l<strong>in</strong>e) from 2000-2004 (Source: 2005 PNZ<br />
Mass Balance and Recycl<strong>in</strong>g Surveys <strong>of</strong> 2004 data)<br />
Current trends <strong>in</strong>dicate that by 2008 an estimated 150,000t <strong>of</strong> plastic packag<strong>in</strong>g material will be<br />
consumed, an <strong>in</strong>crease from 137,909t <strong>in</strong> 2004. This reflects both an <strong>in</strong>crease <strong>in</strong> population and per<br />
capita consumption <strong>of</strong> plastic packag<strong>in</strong>g. Consequently, if the amount <strong>of</strong> material consumed <strong>in</strong>creases,<br />
the amount recovered will need to proportionately <strong>in</strong>crease. In order to ensure current recovery<br />
progress stays on track, (to reach the 23% recycl<strong>in</strong>g target by 2008), the proportion <strong>of</strong> plastic<br />
packag<strong>in</strong>g recovered needs to <strong>in</strong>crease by at least 2000t (1%) per year over the 2005-2008 period.<br />
Year Consumed Recovered Recycl<strong>in</strong>g Proportion [%]<br />
2000 117,475 20,809 18<br />
2001 128,985 23,758 18<br />
2002 123,485 23,305 19<br />
2003 125,955 23,816 19<br />
2004 137,909 9 28,004 20<br />
2005 138,000 28,980 21<br />
2006 142,000 31,240 22<br />
2007 146,000 33,580 23<br />
2008 150,000 34,500 23<br />
Table 3: Recovery progress from 2000-2004 and predictions <strong>for</strong> 2005-2008<br />
8. For more <strong>in</strong><strong>for</strong>mation about the Packag<strong>in</strong>g Accord, visit: www.mfe.govt.nz/issues/susta<strong>in</strong>able-<strong>in</strong>dustry/<strong>in</strong>itiatives/packag<strong>in</strong>g/,<br />
www.packag<strong>in</strong>g.org.nz/accord.php, and www.plastics.org.nz/page.aspid=637<br />
9. Total plastic packag<strong>in</strong>g consumption is estimated from total manufactured packag<strong>in</strong>g <strong>in</strong> NZ less exports plus approximately 30% imported<br />
packag<strong>in</strong>g.<br />
15 <strong>Susta<strong>in</strong>able</strong> <strong>End</strong>-<strong>of</strong>-<strong>Life</strong> <strong>Options</strong> <strong>for</strong> <strong>Plastics</strong> <strong>in</strong> <strong>New</strong> <strong>Zealand</strong>