Opposition material - City Clerk - City of Jonesboro
Opposition material - City Clerk - City of Jonesboro
Opposition material - City Clerk - City of Jonesboro

Create successful ePaper yourself
Turn your PDF publications into a flip-book with our unique Google optimized e-Paper software.
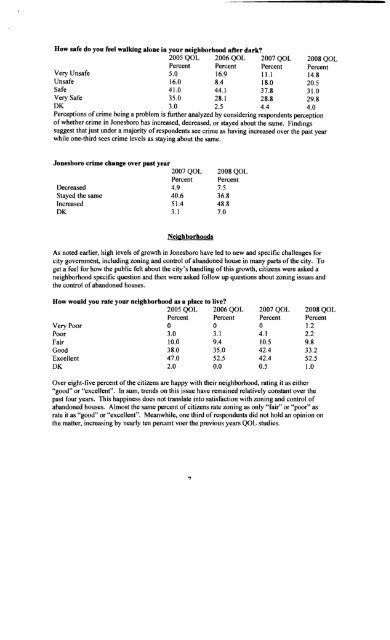
How safe do you feel walking alone in your neigbborbood after dark<br />
2005 QOL 2006 QOL 2007 QOL 2008 QOL<br />
Percent Percent Percent Percent<br />
Very Unsafe 5.0 16.9 11.1 14.8<br />
Unsafe 16.0 8.4 18.0 20.5<br />
Safe 41.0 44.1 37.8 31.0<br />
Very Safe 35.0 28.1 28.8 29.8<br />
DK 3.0 2.5 4.4 4.0<br />
Perceptions <strong>of</strong> crime being a problem is further analyzed by considering respondents perception<br />
<strong>of</strong> whether crime in <strong>Jonesboro</strong> has increased, decreased, or stayed about the same. Findings<br />
suggest that just under a majority <strong>of</strong> respondents see crime as having increased over the past year<br />
while one-third sees crime levels as staying about the same.<br />
<strong>Jonesboro</strong> crime cbange over past year<br />
2007 QOL 2008 QOL<br />
Percent Percent<br />
Decreased 4.9 7.5<br />
Stayed the same 40.6 36.8<br />
Increased 51.4 48.8<br />
DK 3.1 7.0<br />
Neigb borboods<br />
As noted earlier, high levels <strong>of</strong> growth in <strong>Jonesboro</strong> have led to new and specific challenges for<br />
city government, including zoning and control <strong>of</strong> abandoned house in many parts <strong>of</strong> the city. To<br />
get a feel for how the public felt about the city's handling <strong>of</strong> this growth, citizens were asked a<br />
neighborhood specific question and then were asked follow up questions about zoning issues and<br />
the control <strong>of</strong>abandoned houses.<br />
How would you rate your neighborhood as a place to live<br />
2005 QOL 2006 QOL 2007 QOL 2008QOL<br />
Percent Percent Percent Percent<br />
Very Poor o 0 o 1.2<br />
Poor 3.0 3.1 4.1 2.2<br />
Fair 10.0 9.4 10.5 9.8<br />
Good 38.0 35.0 42.4 33.2<br />
Excellent 47.0 52.5 42.4 52.5<br />
DK 2.0 0.0 0.5 1.0<br />
Over eight-five percent <strong>of</strong> the citizens are happy with their neighborhood, rating it as either<br />
"good" or "excellent". In sum, trends on this issue have remained relatively constant over the<br />
past four years. This happiness does not translate into satisfaction with zoning and control <strong>of</strong><br />
abandoned houses. Almost the same percent <strong>of</strong>citizens rate zoning as only "fair" or "poor" as<br />
rate it as "good" or "excellent". Meanwhile, one third <strong>of</strong> respondents did not hold an opinion on<br />
the matter, increasing by nearly ten percent voer the previous years QOL studies.<br />
'7