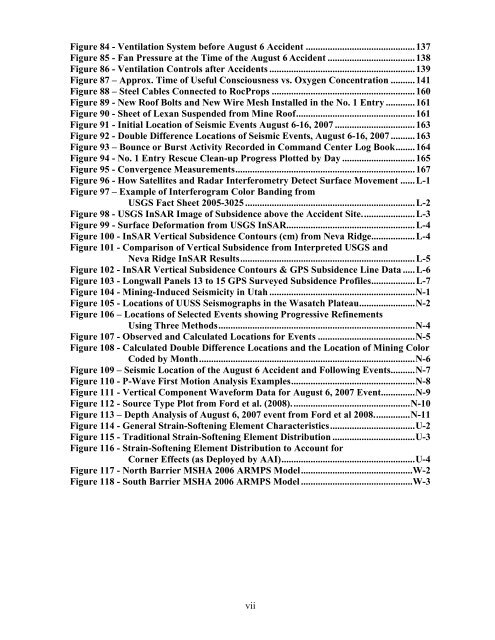
- Page 1: CAI-2007-15-17, 19-24 UNITED STATES
- Page 4 and 5: TABLE OF CONTENTS EXECUTIVE SUMMARY
- Page 6 and 7: Appendix C - Safety Zone Map ......
- Page 10 and 11: Figure 1 - Map of Accident Sites
- Page 12 and 13: pillars near the pillar line and th
- Page 14 and 15: submit written reports of these acc
- Page 16 and 17: Power’s 50% ownership of the Cran
- Page 18 and 19: Table 1 shows recent Non-Fatal Days
- Page 20 and 21: stoppings from the accident site ou
- Page 22 and 23: Peacock told Hardee that an overcas
- Page 24 and 25: At 4:41 a.m., Grosely called the mi
- Page 26 and 27: irrespirable atmosphere behind the
- Page 28 and 29: Rescue Efforts in South Barrier Sec
- Page 30 and 31: etween crosscut 119 and 120 until R
- Page 32 and 33: Figure 7- Damaged Roof Bolts and To
- Page 34 and 35: Figure 10 - No. 1 Entry Packed with
- Page 36 and 37: machine cutter motors required repa
- Page 38 and 39: Figure 13 - 20-foot Deep Void over
- Page 40 and 41: The night shift crew members were t
- Page 42 and 43: Figure 15 - Clean-up Area Following
- Page 44 and 45: Borehole No. 1 was drilled using a
- Page 46 and 47: Figure 20 - Surface Location of Bor
- Page 48 and 49: Table 3 - Analysis Results of Air S
- Page 50 and 51: This was the projected mine locatio
- Page 52 and 53: epresentatives of the mine operator
- Page 54 and 55: DISCUSSION The Crandall Canyon Mine
- Page 56 and 57: displacements is very consistent wi
- Page 58 and 59:
Figure 23 - General Stratigraphic C
- Page 60 and 61:
grids. In mid-2005, the mine adopte
- Page 62 and 63:
corresponding pillar damage at seam
- Page 64 and 65:
Borehole Observations Conditions de
- Page 66 and 67:
Figure 31 - Surface Deformation fro
- Page 68 and 69:
Twelve seismic events were recorded
- Page 70 and 71:
Summary - Nature and Extent of Fail
- Page 72 and 73:
the seam and leaving roof coal in t
- Page 74 and 75:
In the Main West entries, some infl
- Page 76 and 77:
North Barrier Section Development I
- Page 78 and 79:
Larger stumps were left unmined in
- Page 80 and 81:
South Barrier on the BLM coal lease
- Page 82 and 83:
the Main West No. 1 entry at crossc
- Page 84 and 85:
us.” Although Peacock characteriz
- Page 86 and 87:
empirically derived and should not
- Page 88 and 89:
ARMPS StF’s, depth of cover, and
- Page 90 and 91:
Figure 44 - 1st North Mains Left Pa
- Page 92 and 93:
Figure 46 - South Mains ARMPS Calcu
- Page 94 and 95:
Figure 47 - Methods of Incorporatin
- Page 96 and 97:
Summary. ARMPS stability factors fo
- Page 98 and 99:
Figure 49 - Element Safety Factors
- Page 100 and 101:
Figure 51 - Element Safety Factor D
- Page 102 and 103:
Like all numerical methods, BEM res
- Page 104 and 105:
Figure 53 - LaModel Grid Boundaries
- Page 106 and 107:
Similarly, a sudden change in stres
- Page 108 and 109:
The magnitude and distribution of i
- Page 110 and 111:
was completed, this effect was nega
- Page 112 and 113:
B 8 ft mined height 80 ft Wide Remn
- Page 114 and 115:
2.0 without bottom mining with bott
- Page 116 and 117:
A 2.0 B C 1.8 1.6 1.4 1.2 1.0 0.8 0
- Page 118 and 119:
Critique of Mine Design The enginee
- Page 120 and 121:
methods. The design widths shown he
- Page 122 and 123:
Also, the 130-foot dimension is app
- Page 124 and 125:
program, LamPre, offers a utility t
- Page 126 and 127:
very little feedback from the field
- Page 128 and 129:
AAI’s LaModel model was calibrate
- Page 130 and 131:
After the initial calibration proce
- Page 132 and 133:
oad area (Figure 75). In this figur
- Page 134 and 135:
South Barrier Design. After the Mar
- Page 136 and 137:
Minimum PStF in the North Barrier s
- Page 138 and 139:
AAI recognized that the North Barri
- Page 140 and 141:
Roof Control Plan Section 30 CFR 75
- Page 142 and 143:
control plan. The entries and cross
- Page 144 and 145:
A 55-foot barrier between the South
- Page 146 and 147:
section, miners recognized that gro
- Page 148 and 149:
The main fan installation consisted
- Page 150 and 151:
Originally, the South Barrier secti
- Page 152 and 153:
Three sources of the oxygen deficie
- Page 154 and 155:
Table 13 - Handheld Gas Detector Co
- Page 156 and 157:
drill rod and bit were left in the
- Page 158 and 159:
It was feasible to acquire a specia
- Page 160 and 161:
The call lasted five minutes. Allre
- Page 162 and 163:
each hole. The microphone was not r
- Page 164 and 165:
parameters, and mine emergency scen
- Page 166 and 167:
Advance rate in the No. 1 entry bet
- Page 168 and 169:
GRI furnished a map to MSHA during
- Page 170 and 171:
During most of the rescue work in t
- Page 172 and 173:
Seismic Activity Recorded by UUSS d
- Page 174 and 175:
Pillar Bounce and Burst Activity du
- Page 176 and 177:
indicative of an impending burst we
- Page 178 and 179:
day. When the accident occurred, th
- Page 180 and 181:
4. Root Cause: GRI included incorre
- Page 182 and 183:
The mine designs recommended by AAI
- Page 184 and 185:
ENFORCEMENT ACTIONS An order was is
- Page 186 and 187:
Type of Issuance: 104 (d) (2) Order
- Page 188 and 189:
Mine Safety and Health Administrati
- Page 190 and 191:
B-2
- Page 192 and 193:
B-4
- Page 195:
Appendix C - Safety Zone Map
- Page 199 and 200:
Appendix E - AAI May 5, 2000, Repor
- Page 201 and 202:
E-3
- Page 203 and 204:
E-5
- Page 205 and 206:
Appendix F - AAI July 20, 2006, Dra
- Page 207 and 208:
F-3
- Page 209 and 210:
F-5
- Page 211 and 212:
F-7
- Page 213 and 214:
F-9
- Page 215 and 216:
F-11
- Page 217 and 218:
F-13
- Page 219 and 220:
F-15
- Page 221 and 222:
F-17
- Page 223 and 224:
F-19
- Page 225 and 226:
F-21
- Page 227 and 228:
F-23
- Page 229 and 230:
F-25
- Page 231 and 232:
F-27
- Page 233 and 234:
F-29
- Page 235:
F-31
- Page 238 and 239:
G-2
- Page 240 and 241:
G-4
- Page 242 and 243:
G-6
- Page 244 and 245:
G-8
- Page 246 and 247:
G-10
- Page 248 and 249:
G-12
- Page 250 and 251:
G-14
- Page 252 and 253:
G-16
- Page 254 and 255:
G-18
- Page 256 and 257:
G-20
- Page 258 and 259:
G-22
- Page 260 and 261:
G-24
- Page 262 and 263:
G-26
- Page 264 and 265:
G-28
- Page 266 and 267:
G-30
- Page 268 and 269:
G-32
- Page 270 and 271:
H-2
- Page 272 and 273:
H-4
- Page 274 and 275:
H-6
- Page 276 and 277:
I-2
- Page 278 and 279:
I-4
- Page 280 and 281:
I-6
- Page 282 and 283:
I-8
- Page 284 and 285:
I-10
- Page 286 and 287:
J-2
- Page 288 and 289:
J-4
- Page 291 and 292:
Appendix K - Massive Pillar Collaps
- Page 293 and 294:
Appendix L - Subsidence Data Inform
- Page 295 and 296:
Figure 98 - USGS InSAR Image of Sub
- Page 297 and 298:
The contours on the USGS results we
- Page 299 and 300:
InSAR provides a more reliable char
- Page 301:
Appendix M - Neva Ridge Technologie
- Page 304 and 305:
1 Introduction 1.1 Data Description
- Page 306 and 307:
Each color cycle means 10 cm of dis
- Page 308 and 309:
Vertical Contours ∆=5 cm 5 10 25
- Page 311 and 312:
Appendix N - Seismic Analysis Unive
- Page 313 and 314:
provide similar results on average
- Page 315:
Figure 107 - Observed and Calculate
- Page 319 and 320:
Figure 108 shows all of the calcula
- Page 321 and 322:
Figure 111 shows the seismograph st
- Page 323 and 324:
Figure 113 - Depth Analysis of Augu
- Page 325 and 326:
Appendix O - Images of March 10, 20
- Page 327 and 328:
O-3
- Page 329 and 330:
O-5
- Page 331 and 332:
O-7
- Page 333 and 334:
O-9
- Page 335 and 336:
O-11
- Page 337:
Appendix P- ARMPS Method Using Barr
- Page 341 and 342:
FINITE ELEMENT ANALYSIS OF BARRIER
- Page 343 and 344:
INTRODUCTION This report discusses
- Page 345 and 346:
Generally, excavation takes place i
- Page 347 and 348:
Mine Geometry The overall region us
- Page 349 and 350:
Premining Stress The premining stre
- Page 351 and 352:
(2) An alternative form of (1) that
- Page 353 and 354:
There is a possibility that compute
- Page 355 and 356:
Figure 5. Element safety factor dis
- Page 357 and 358:
through a pillar. This variation is
- Page 359 and 360:
Figure 8a shows displacements in th
- Page 361 and 362:
Element Safety Factor Distributions
- Page 363 and 364:
Figure 10. A half-mesh view of elem
- Page 365 and 366:
Figure 12. Distribution of element
- Page 367 and 368:
Figure 14. Element safety distribut
- Page 369 and 370:
Figure 17 shows the distribution of
- Page 371 and 372:
Figure 18. Post-excavation pillar s
- Page 373 and 374:
would be of even more concern at gr
- Page 375 and 376:
A potentially important inelastic e
- Page 377 and 378:
A multi-stage mining sequence was f
- Page 379:
Pariseau, W. G. (1981) Inexpensive
- Page 383:
Appendix S - Back-Analysis of the C
- Page 386 and 387:
Executive Summary On August 6 th ,
- Page 388 and 389:
Page 3.5.2.2 Joint Slip ...........
- Page 390 and 391:
1. Objective The objective of this
- Page 392 and 393:
• The Rock Mass Stiffness • The
- Page 394 and 395:
types of field measurements are qui
- Page 396 and 397:
ARMPS Stability Factor 2 1.5 1 0.5
- Page 398 and 399:
or past, failure. Back-analysis is
- Page 400 and 401:
umps. Since LaModel does not have a
- Page 402 and 403:
appropriate values in the post-fail
- Page 404 and 405:
3. The LaModel Analysis 3.1 Approac
- Page 406 and 407:
Figure 3.2 Rib and pillar failure i
- Page 408 and 409:
Five and 6 ft wide elements were al
- Page 410 and 411:
3.4.2 Determining the Gob Stiffness
- Page 412 and 413:
strength formula, this implies that
- Page 414 and 415:
The model results illustrated in Fi
- Page 416 and 417:
1600 1600 2000 1600 1600 A. Pillar
- Page 418 and 419:
1600 1600 2000 1600 A. 3.8% Stronge
- Page 420 and 421:
changes are necessary to replicate
- Page 422 and 423:
1600 1600 2000 1600 A. Step 5 - Sou
- Page 424 and 425:
1600 1600 2000 1600 A. Step 6 - 2 P
- Page 426 and 427:
further improved. Obviously, there
- Page 428 and 429:
in to crosscut 146 in the bleeder a
- Page 430 and 431:
1600 1600 2000 1600 1600 A. Step 9
- Page 432 and 433:
36% of insitu load. With these two
- Page 434 and 435:
References Barron, K., 1992, “A R
- Page 437:
Appendix T - Abutment Load Transfer
- Page 440 and 441:
AAI used departs somewhat from that
- Page 442 and 443:
I H H H H H H G F F F F H H H H H H
- Page 445 and 446:
Appendix W - MSHA Main West 2006 AR
- Page 447:
Figure 118 - South Barrier MSHA 200
- Page 450 and 451:
The ventilation plan amendment to r
- Page 452 and 453:
X-4
- Page 454 and 455:
X-6
- Page 456 and 457:
X-8
- Page 458 and 459:
Azimuth - A surveying term that ref
- Page 460 and 461:
Coda Magnitude - The coda magnitude
- Page 462 and 463:
Formation - Any assemblage of rocks
- Page 464 and 465:
Methane - A potentially explosive g
- Page 466 and 467:
Identified coal resources are class
- Page 468 and 469:
Slabbing - A method of mining pilla
- Page 471 and 472:
Appendix Z - References 1 USBM dict


