Mine Safety and Health Administration (MSHA) - Report of ...
Mine Safety and Health Administration (MSHA) - Report of ...
Mine Safety and Health Administration (MSHA) - Report of ...

You also want an ePaper? Increase the reach of your titles
YUMPU automatically turns print PDFs into web optimized ePapers that Google loves.
CAI-2007-15-17, 19-24<br />
UNITED STATES<br />
DEPARTMENT OF LABOR<br />
MINE SAFETY AND HEALTH ADMINISTRATION<br />
COAL MINE SAFETY AND HEALTH<br />
REPORT OF INVESTIGATION<br />
Underground Coal <strong>Mine</strong><br />
Fatal Underground Coal Burst Accidents<br />
August 6 <strong>and</strong> 16, 2007<br />
Cr<strong>and</strong>all Canyon <strong>Mine</strong><br />
Genwal Resources Inc<br />
Huntington, Emery County, Utah<br />
ID No. 42-01715<br />
Accident Investigators<br />
Richard A. Gates<br />
District Manager, District 11, Birmingham, AL<br />
Michael Gauna<br />
Mining Engineer, Ro<strong>of</strong> Control Division, Technical Support, Triadelphia, WV<br />
Thomas A. Morley<br />
Mining Engineer, Ventilation Division, Technical Support, Triadelphia, WV<br />
Joseph R. O’Donnell Jr.<br />
Supervisory Coal <strong>Mine</strong> Inspector, District 11, Bessemer, AL<br />
Gary E. Smith<br />
Supervisory Coal <strong>Mine</strong> Inspector, District 2, New Stanton, PA<br />
Timothy R. Watkins<br />
Assistant District Manager, District 6, Pikeville, KY<br />
Chris A. Weaver<br />
Supervisory Coal <strong>Mine</strong> Inspector, District 3, Bridgeport, WV<br />
Joseph C. Zelanko<br />
Supervisory Mining Engineer, Ro<strong>of</strong> Control Division, Technical Support, Pittsburgh, PA<br />
Originating Office<br />
<strong>Mine</strong> <strong>Safety</strong> <strong>and</strong> <strong>Health</strong> <strong>Administration</strong><br />
Office <strong>of</strong> the Administrator, Coal <strong>Mine</strong> <strong>Safety</strong> <strong>and</strong> <strong>Health</strong><br />
1100 Wilson Boulevard, Arlington, Virginia, 22209<br />
Kevin G. Stricklin, Administrator
PREFACE<br />
This investigation was conducted by the <strong>Mine</strong> <strong>Safety</strong> <strong>and</strong> <strong>Health</strong> <strong>Administration</strong> (<strong>MSHA</strong>) under the<br />
authority <strong>of</strong> The Federal <strong>Mine</strong> <strong>Safety</strong> <strong>and</strong> <strong>Health</strong> Act <strong>of</strong> 1977 (<strong>Mine</strong> Act). The <strong>Mine</strong> Act requires<br />
that authorized representatives <strong>of</strong> the Secretary <strong>of</strong> Labor make investigations in coal <strong>and</strong> other mines<br />
for the purpose <strong>of</strong> obtaining, utilizing, <strong>and</strong> disseminating information relating to the causes <strong>of</strong><br />
accidents. The objective <strong>of</strong> <strong>MSHA</strong>’s accident investigations is to determine the root cause(s) <strong>of</strong> the<br />
accident <strong>and</strong> to utilize <strong>and</strong> share this information with the mining community <strong>and</strong> others for the<br />
purpose <strong>of</strong> preventing similar occurrences. <strong>MSHA</strong>’s accident investigations include determinations<br />
<strong>of</strong> whether violations <strong>of</strong> the <strong>Mine</strong> Act or implementing regulations contributed to the accident. In<br />
addition to providing critical, potentially life-saving information, the findings <strong>of</strong> these investigations<br />
provide a basis for formulating <strong>and</strong> evaluating <strong>MSHA</strong> health <strong>and</strong> safety st<strong>and</strong>ards <strong>and</strong> policies.<br />
In addition to the traditional accident investigation, the Secretary <strong>of</strong> Labor also appointed an<br />
independent review team. The independent review will consist <strong>of</strong> a thorough examination <strong>of</strong> written<br />
mine plans (including the mine’s approved ro<strong>of</strong> control plan), inspection records, <strong>and</strong> other<br />
documents relevant to the Cr<strong>and</strong>all Canyon <strong>Mine</strong> <strong>and</strong> interviews <strong>of</strong> <strong>MSHA</strong> employees with personal<br />
knowledge <strong>of</strong> <strong>MSHA</strong>’s inspection responsibilities <strong>and</strong> enforcement procedures at the mine. This<br />
review will provide a comparison <strong>of</strong> <strong>MSHA</strong>’s actions at the Cr<strong>and</strong>all Canyon <strong>Mine</strong> with the<br />
requirements <strong>of</strong> the <strong>Mine</strong> Act (as amended by the <strong>Mine</strong> Improvement <strong>and</strong> New Emergency Response<br />
Act <strong>of</strong> 2006), its st<strong>and</strong>ards <strong>and</strong> regulations, <strong>and</strong> <strong>MSHA</strong> policies <strong>and</strong> procedures. The findings <strong>of</strong> the<br />
independent review will result in the development <strong>of</strong> recommendations to improve <strong>MSHA</strong>’s<br />
enforcement program <strong>and</strong> the agency’s oversight <strong>of</strong> rescue <strong>and</strong> recovery programs in the aftermath<br />
<strong>of</strong> mine accidents. Copies <strong>of</strong> this review will be made available to the families <strong>of</strong> the miners<br />
involved in the Cr<strong>and</strong>all Canyon <strong>Mine</strong> accident, Congress, <strong>and</strong> the public.<br />
The tragic accidents at the Cr<strong>and</strong>all Canyon <strong>Mine</strong> in August 2007 occurred when overstressed coal<br />
pillars suddenly failed, violently expelling coal from the pillars into the mine openings. Locally<br />
referred to in Utah as a “bounce,” terminology for this type <strong>of</strong> event differs regionally, <strong>and</strong> is also<br />
known as an outburst, bump, or burst. Bounces <strong>and</strong> bumps are broader terms that can include any<br />
dull, hollow, or thumping sound produced by movement or fracturing <strong>of</strong> strata as a result <strong>of</strong> mining<br />
operations. In many cases, vibrations in the strata resulting from such movement can be felt by<br />
miners <strong>and</strong> detected by seismographic instruments. Bounces resulting from intentional caving,<br />
where strata in active workings remain intact, are common in deep coal mines <strong>and</strong> do not pose a<br />
threat to miners. However, coal or rock bursts, also known as outbursts 1* , are those bounces<br />
specifically characterized by the sudden <strong>and</strong> violent failure <strong>of</strong> overstressed rock or coal resulting in<br />
the instantaneous release <strong>of</strong> large amounts <strong>of</strong> accumulated energy with the ejection <strong>of</strong> material.<br />
When such events occur in active workings, they pose a serious hazard to miners. Federal mine<br />
safety st<strong>and</strong>ards, therefore, require that the ro<strong>of</strong>, face, <strong>and</strong> ribs be controlled to protect persons from<br />
hazards related to bursts through proper ground support <strong>and</strong> pillar dimensions. Also, coal or rock<br />
outbursts that cause withdrawal <strong>of</strong> miners or which disrupt regular mining activity for more than one<br />
hour are defined as accidents (even if no miners are injured) <strong>and</strong> must be immediately reported to<br />
<strong>MSHA</strong>, as required by relevant portions <strong>of</strong> 30 CFR 50. Definitions for these <strong>and</strong> other terms are<br />
provided in Appendix Y. Any references to product manufacturers, distributors, or service providers<br />
are intended for factual documentation <strong>and</strong> do not imply endorsement by <strong>MSHA</strong>.<br />
* References identified by superscript numbers are listed in Appendix Z.<br />
i
TABLE OF CONTENTS<br />
EXECUTIVE SUMMARY..................................................................................................... 1<br />
GENERAL INFORMATION ................................................................................................ 5<br />
DESCRIPTION OF THE ACCIDENT................................................................................. 8<br />
August 6 Accident Description....................................................................................... 8<br />
Underground Rescue Efforts ....................................................................................... 14<br />
Attempts to Explore South Barrier Section <strong>and</strong> Main West Sealed Area........... 14<br />
Rescue Efforts in South Barrier Section Nos. 3 <strong>and</strong> 4 Entries.............................. 16<br />
Rescue Efforts in South Barrier Section No. 1 Entry ............................................ 18<br />
Preparation for Rescue Effort in No. 1 Entry....................................................... 18<br />
Material Clean-Up from the No. 1 Entry .............................................................. 21<br />
August 16 Accident Description................................................................................... 26<br />
Surface Rescue Efforts.................................................................................................. 33<br />
Attempt to Locate <strong>Mine</strong>rs - Boreholes .................................................................... 33<br />
Description <strong>of</strong> Boreholes........................................................................................ 37<br />
Attempt to Locate <strong>Mine</strong>rs - <strong>MSHA</strong>’s Seismic System ........................................... 41<br />
Suspension <strong>of</strong> Rescue Efforts ....................................................................................... 41<br />
<strong>Mine</strong> Closure .......................................................................................................... 42<br />
INVESTIGATION OF THE ACCIDENT.......................................................................... 43<br />
DISCUSSION ........................................................................................................................ 44<br />
August 6 Accident Discussion ...................................................................................... 44<br />
Background for Ground Control Analysis ............................................................. 47<br />
General <strong>Mine</strong> Geology ........................................................................................... 47<br />
Mining Horizon <strong>and</strong> Mining Width ...................................................................... 48<br />
Primary <strong>and</strong> Supplemental Ro<strong>of</strong> Support ............................................................. 49<br />
Accidents Related to Ground Control Failures..................................................... 50<br />
Room <strong>and</strong> Pillar Retreat Coal Mining Overview .................................................. 51<br />
Nature <strong>and</strong> Extent <strong>of</strong> Failure ................................................................................... 51<br />
Underground Observations.................................................................................... 52<br />
Borehole Observations ........................................................................................... 54<br />
Surface Subsidence Determined from GPS Surveys ............................................ 54<br />
Surface Subsidence Determined from InSAR Analyses....................................... 55<br />
Seismology .............................................................................................................. 57<br />
Time <strong>of</strong> the Accident .............................................................................................. 59<br />
Summary - Nature <strong>and</strong> Extent <strong>of</strong> Failure............................................................. 60<br />
Main West Ground Control History ....................................................................... 61<br />
Main West Development ........................................................................................ 61<br />
Longwall Panel Extraction.................................................................................... 62<br />
North Barrier Section Development...................................................................... 66<br />
North Barrier Section Pillar Recovery .................................................................. 67<br />
March 10, 2007, Coal Outburst ............................................................................. 69<br />
South Barrier Section Development...................................................................... 71<br />
South Barrier Section Pillar Recovery .................................................................. 72<br />
Summary – Main West Ground Control History .................................................. 74<br />
Analysis <strong>of</strong> Collapse .................................................................................................. 74<br />
<strong>Safety</strong>/Stability Factors .......................................................................................... 75<br />
Analysis <strong>of</strong> Retreat Mining Pillar Stability (ARMPS) .......................................... 76<br />
Finite Element Analysis......................................................................................... 86<br />
ii
Boundary Element Analysis .................................................................................. 91<br />
Boundary Element Analyses <strong>of</strong> GRI Mining ........................................................ 96<br />
Summary - Analyses <strong>of</strong> Collapse ......................................................................... 107<br />
Critique <strong>of</strong> <strong>Mine</strong> Design ......................................................................................... 108<br />
Previous Ground Control Studies at Cr<strong>and</strong>all Canyon <strong>Mine</strong> ............................ 108<br />
Barrier Pillar Design............................................................................................ 109<br />
Agapito Associates, Inc. Analyses ....................................................................... 113<br />
Ro<strong>of</strong> Control Plan ................................................................................................ 130<br />
Summary – Critique <strong>of</strong> <strong>Mine</strong> Design................................................................... 136<br />
<strong>Mine</strong> Ventilation...................................................................................................... 136<br />
<strong>Mine</strong> Ventilation System ...................................................................................... 136<br />
Post-Accident <strong>Mine</strong> Ventilation........................................................................... 138<br />
Ventilation in Area <strong>of</strong> Entrapment...................................................................... 140<br />
Air Quality in South Barrier Section Pillar Recovery Area ............................... 140<br />
Attempt to Locate <strong>Mine</strong>rs with Boreholes............................................................ 145<br />
Boreholes Drilled Prior to August 16.................................................................. 145<br />
Boreholes Drilled After August 16 ...................................................................... 146<br />
<strong>MSHA</strong>’s Seismic Location Systems ....................................................................... 148<br />
Emergency Response Plan...................................................................................... 149<br />
Notification........................................................................................................... 149<br />
Self-Rescuers ........................................................................................................ 150<br />
Post-Accident Logistics ........................................................................................ 150<br />
Lifelines ................................................................................................................ 151<br />
Post-Accident Communication ............................................................................ 151<br />
Post-Accident Tracking........................................................................................ 152<br />
Local Coordination .............................................................................................. 152<br />
Training ................................................................................................................ 152<br />
Post-Accident Breathable Air .............................................................................. 152<br />
Additional Provisions........................................................................................... 153<br />
Family Liaisons ....................................................................................................... 153<br />
<strong>Mine</strong> Emergency Evacuation <strong>and</strong> Firefighting Program <strong>of</strong> Instruction............ 153<br />
Procedures for Evacuation .................................................................................. 154<br />
Atmospheric Monitoring System (AMS) Fire Detection .................................... 154<br />
Training Plan........................................................................................................... 155<br />
August 16 Accident Discussion .................................................................................. 155<br />
Ground Control during Rescue Efforts ................................................................ 157<br />
Selection <strong>of</strong> Entry for Rescue Work .................................................................... 157<br />
Work Procedures under Operator’s Recovery Plan ........................................... 158<br />
Pillar Burst Support System................................................................................. 159<br />
Seismic Activity Recorded by UUSS during Rescue Efforts............................... 162<br />
Pillar Bounce <strong>and</strong> Burst Activity during Rescue in No. 1 Entry ........................ 164<br />
Ground Condition Monitoring .............................................................................. 165<br />
Ventilation on August 16 ........................................................................................ 167<br />
Post-Accident Tracking .......................................................................................... 168<br />
Local Coordination ................................................................................................. 168<br />
ROOT CAUSE ANALYSIS ............................................................................................... 169<br />
CONCLUSION.................................................................................................................... 171<br />
ENFORCEMENT ACTIONS............................................................................................ 174<br />
Appendix A - Persons Participating in the Investigation ................................................ A-1<br />
Appendix B - Victim Data Sheets ...................................................................................... B-1<br />
iii
Appendix C - <strong>Safety</strong> Zone Map ......................................................................................... C-1<br />
Appendix D - <strong>Mine</strong> Development History Map................................................................ D-1<br />
Appendix E - AAI May 5, 2000, <strong>Report</strong>.............................................................................E-1<br />
Appendix F - AAI July 20, 2006, Draft <strong>Report</strong> .................................................................F-1<br />
Appendix G - AAI August 9, 2006, <strong>Report</strong> ....................................................................... G-1<br />
Appendix H - AAI December 8, 2006, <strong>Report</strong>.................................................................. H-1<br />
Appendix I - AAI April 18, 2007, <strong>Report</strong>............................................................................I-1<br />
Appendix J - Ro<strong>of</strong> Control Plan for Recovering South Barrier Section......................... J-1<br />
Appendix K - Massive Pillar Collapse............................................................................... K-1<br />
Appendix L - Subsidence Data............................................................................................L-1<br />
Appendix M - Neva Ridge Technologies <strong>Report</strong> ............................................................. M-1<br />
Appendix N - Seismic Analysis .......................................................................................... N-1<br />
Appendix O - Images <strong>of</strong> March 10, 2007, Coal Outburst Accident................................ O-1<br />
Appendix P - ARMPS Method Using Barrier Width Modified Based on<br />
Bearing Capacity..........................................................................................P-1<br />
Appendix Q - Finite Element Analysis <strong>of</strong> Barrier Pillar Mining<br />
at Cr<strong>and</strong>all Canyon <strong>Mine</strong>........................................................................... Q-1<br />
Appendix R - Description <strong>of</strong> BEM Numerical Models .................................................... R-1<br />
Appendix S - Back-Analysis <strong>of</strong> the Cr<strong>and</strong>all Canyon <strong>Mine</strong> Using the<br />
LaModel Program........................................................................................S-1<br />
Appendix T - Abutment Load Transfer.............................................................................T-1<br />
Appendix U - Coal Properties Input ................................................................................. U-1<br />
Appendix V - Rock Mass Properties ................................................................................. V-1<br />
Appendix W - <strong>MSHA</strong> Main West 2006 ARMPS............................................................. W-1<br />
Appendix X - <strong>Mine</strong> Ventilation Plan ................................................................................. X-1<br />
Appendix Y - Glossary <strong>of</strong> Mining Terms as used in this <strong>Report</strong>.................................... Y-1<br />
Appendix Z - References ....................................................................................................Z-1<br />
TABLES<br />
Table 1 - Accident Incidence Rates.......................................................................................8<br />
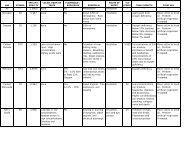
Table 2 - Summary <strong>of</strong> Borehole Size, Depth, Drill Rate, Location, Voids, <strong>and</strong> O 2<br />
Concentration ...............................................................................................36<br />
Table 3 - Analysis Results <strong>of</strong> Air Samples Taken at Boreholes .......................................38<br />
Table 4 - NIOSH Pillar Design Considerations.................................................................78<br />
Table 5 - Pillar Stability Factors for Continuous Haulage Panel Back-Analysis...........80<br />
Table 6 - Pillar Stability Factors for South Mains Back-Analysis for Areas<br />
with Side <strong>and</strong> Active Gobs...........................................................................82<br />
Table 7 - Pillar Stability Factors for North Barrier Section ............................................83<br />
Table 8 - Pillar Stability Factors for South Barrier Section ............................................84<br />
Table 9 - Barrier Pillar Design Formulas ........................................................................110<br />
Table 10 - Coal Properties Calculated by AAI................................................................114<br />
Table 11 - Effect Thresholds for Exposure to Reduced Oxygen....................................141<br />
Table 12 - Results <strong>of</strong> Air Sample Analysis.......................................................................143<br />
Table 13 - H<strong>and</strong>held Gas Detector Concentrations ........................................................144<br />
Table 14 - Cr<strong>and</strong>all Canyon Longwall Subsidence Parameters,<br />
Values, <strong>and</strong> Comparisons ..........................................................................L-8<br />
Table 15 - LaModel Confined Coal Strength ..................................................................U-1<br />
iv
FIGURES<br />
Figure 1 - Map <strong>of</strong> Accident Sites........................................................................................viii<br />
Figure 2 - Location <strong>of</strong> <strong>Mine</strong>rs during August 6 Accident.................................................10<br />
Figure 3 - South Barrier Section Rescue Area ..................................................................15<br />
Figure 4 - View <strong>of</strong> No. 3 Entry after August 7 Burst ........................................................17<br />
Figure 5 - Hardwood Posts Installed with Jackpots in No. 1 Entry ................................20<br />
Figure 6 - RocProps, Cables, <strong>and</strong> Chain-link Fencing Installed in the No. 1 Entry......20<br />
Figure 7- Damaged Ro<strong>of</strong> Bolts <strong>and</strong> Torn Mesh after August 6 Accident.......................22<br />
Figure 8 - Damaged Ro<strong>of</strong> Bolts in No. 1 Entry after August 6 Accident ........................22<br />
Figure 9 - Steel Channels Installed in No. 1 Entry to Support Deteriorated Ro<strong>of</strong> ........23<br />
Figure 10 - No. 1 Entry Packed with Coal Rubble Inby Crosscut 124............................24<br />
Figure 11 - Continuous Mining Machine in Loading Area Inby Crosscut 124..............24<br />
Figure 12 – Damage to Outby Portion <strong>of</strong> Pillar on Right Side <strong>of</strong> No. 1 Entry<br />
(Outby August 16 Accident Site) ................................................................27<br />
Figure 13 - 20-foot Deep Void over Pillar on Right Side <strong>of</strong> No. 1 Entry<br />
following August 16 Accident......................................................................28<br />
Figure 14 - August 16, 2007, Coal Burst Effects <strong>and</strong> Location <strong>of</strong> Injured <strong>Mine</strong>rs ........28<br />
Figure 15 – Clean-up Area Following the Fatal August 16, 2007, Accident...................32<br />
Figure 16 - Mountainous Terrain where Roads <strong>and</strong> Drill Pads were Constructed.......33<br />
Figure 17 - Heliportable Drill Rig ......................................................................................34<br />
Figure 18 - Drill Rig at Borehole No. 4...............................................................................35<br />
Figure 19 - Borehole Locations Intersecting Underground Workings ...........................35<br />
Figure 20 - Surface Location <strong>of</strong> Boreholes.........................................................................36<br />
Figure 21 - Arrangement for Lowering Robot into <strong>Mine</strong> Through a Borehole.............40<br />
Figure 22 - Robot Being Lowered Into Borehole ..............................................................40<br />
Figure 23 - General Stratigraphic Column for Cr<strong>and</strong>all Canyon <strong>Mine</strong>.........................48<br />
Figure 24 - Hour Glass Shape <strong>of</strong> Stressed Pillars .............................................................49<br />
Figure 25 - Example <strong>of</strong> a Pillar Recovery Cut Sequence..................................................51<br />
Figure 26 - Extent <strong>of</strong> Pillar Rib Damage Outby Crosscut 119.........................................52<br />
Figure 27 - Normal Main West Pillar Rib Conditions......................................................53<br />
Figure 28 - Main West Pillar Rib Condition showing Recent Sloughage<br />
from Abutment Stress..................................................................................53<br />
Figure 29 - Borehole Locations <strong>and</strong> Conditions Observed ..............................................54<br />
Figure 30 - Subsidence Pr<strong>of</strong>iles over Panels 13 to 15........................................................55<br />
Figure 31 - Surface Deformation from Neva Ridge InSAR Analyses<br />
(June to Sept. 2007)......................................................................................56<br />
Figure 32 – Double Difference Locations <strong>of</strong> Seismic Events, August 6-27, 2007 ...........58<br />
Figure 33 - Combined Data <strong>and</strong> Likely Extent <strong>of</strong> Collapse .............................................61<br />
Figure 34 – Initial Main West Barrier Pillars after Panel 13 Mining<br />
showing Overburden....................................................................................62<br />
Figure 35 - Abutment Stress due to Cantilevered Strata from Mining ..........................63<br />
Figure 36 – South Mains “Rooming Out” Pillar Recovery Sequence.............................65<br />
Figure 37 - North Barrier Section Mining showing Overburden....................................66<br />
Figure 38 – Stopping Damaged during March 2007 Coal Outburst Accident on<br />
North Barrier Section ..................................................................................70<br />
Figure 39 –Damage in No. 4 Entry after the March 2007 Coal Outburst<br />
Accident on North Barrier Section.............................................................70<br />
Figure 40 - South Barrier Section Mining showing Overburden ....................................71<br />
Figure 41 - South Barrier Section Pillar Recovery Cut Sequence...................................72<br />
v
Figure 42 - Illustration <strong>of</strong> ARMPS Input Related to Panel Geometry............................77<br />
Figure 43 - ARMPS Case History Data Base (Chase et al. 7 )............................................78<br />
Figure 44 - 1st North Mains Left Panel ARMPS Calculation Areas...............................80<br />
Figure 45 - ARMPS Stability Factors at Cr<strong>and</strong>all Canyon <strong>Mine</strong>....................................81<br />
Figure 46 - South Mains ARMPS Calculation Areas .......................................................82<br />
Figure 47 - Methods <strong>of</strong> Incorporating a Bleeder Pillar in ARMPS Analyses ................84<br />
Figure 48 - ARMPS Layout for Simplified Main West Analysis.....................................85<br />
Figure 49 - Element <strong>Safety</strong> Factors about a Barrier Pillar after Longwall Mining ......88<br />
Figure 50 - Element <strong>Safety</strong> Factor Distribution after North Barrier Section<br />
Development .................................................................................................89<br />
Figure 51 - Element <strong>Safety</strong> Factor Distribution after South Barrier Section<br />
Development .................................................................................................90<br />
Figure 52 - Illustration <strong>of</strong> Boundary Element Model Components.................................91<br />
Figure 53 - LaModel Grid Boundaries <strong>and</strong> Overburden Stress......................................94<br />
Figure 54 - Optimum Model Before <strong>and</strong> After South Barrier Section Mining..............95<br />
Figure 55 - Optimum Model after August 6 Failure.........................................................95<br />
Figure 56 - Distribution <strong>of</strong> Vertical Stress in the South Barrier Section........................97<br />
Figure 57 - Vertical Stress Increases due to Barrier Mining ...........................................98<br />
Figure 58 - Effect <strong>of</strong> Barrier Mining on Average Pillar Stress........................................98<br />
Figure 59 - Pillar <strong>Safety</strong> Factors for Pillar Recovery Outby Crosscut 139 ....................99<br />
Figure 60 - Cross-Section through South Barrier Section during Pillar Recovery .....100<br />
Figure 61 - Effect <strong>of</strong> Bottom Mining on Pillar Geometry...............................................101<br />
Figure 62 - Model Representation <strong>of</strong> Bottom Mining in the Remnant Barrier ...........102<br />
Figure 63 - Distribution <strong>of</strong> Vertical Stress in the South Barrier Section......................102<br />
Figure 64 - Differences in Vertical Stress due to Bottom Mining..................................103<br />
Figure 65 - Element <strong>Safety</strong> Factors ..................................................................................104<br />
Figure 66 – Pillar <strong>Safety</strong> Factors Modeled with a 120-foot Southern Barrier .............105<br />
Figure 67 – Pillar <strong>Safety</strong> Factors Modeled with a 140-foot Southern Barrier<br />
for Development Mining............................................................................106<br />
Figure 68 - Barrier Pillar Sizes from Empirical Methods..............................................111<br />
Figure 69 – Plan View <strong>of</strong> Pillars showing Coal Property Elements ..............................114<br />
Figure 70 - Simulation Process Flow Chart.....................................................................117<br />
Figure 71 - Modeled Yield Condition - Partial Retreat in 9th Left Panel ....................118<br />
Figure 72 - Modeled Vertical Stress – Retreat Completed in 9th Left Panel ...............119<br />
Figure 73 - Notes Made by AAI on March 16, 2007 .......................................................120<br />
Figure 74 - AAI Model Results <strong>of</strong> Vertical Stress in March 2007 Burst Area .............121<br />
Figure 75 - Element <strong>Safety</strong> Factors with Coal Properties Distributed<br />
as Indicated in AAI <strong>Report</strong> .......................................................................122<br />
Figure 76 - Element <strong>Safety</strong> Factors using Modified Coal Strength Property<br />
Distribution, Gob Properties, <strong>and</strong> Lamination Thickness .....................123<br />
Figure 77 - AAI Notation on Plot <strong>of</strong> Model Results ........................................................124<br />
Figure 78 – AAI Modeled Vertical Stress Results Comparing Effects <strong>of</strong><br />
Crosscut Spacing ........................................................................................125<br />
Figure 79 - ARMPS Analysis Geometries used by AAI .................................................126<br />
Figure 80 - Pillar Stability Factors from NIOSH ARMPS Database<br />
for Depths Over 1,500’...............................................................................127<br />
Figure 81 – Cr<strong>and</strong>all Canyon <strong>Mine</strong> ARMPS Stability Factors showing AAI South<br />
Barrier Calculations ..................................................................................129<br />
Figure 82 - Comparison <strong>of</strong> South Barrier Ro<strong>of</strong> Control <strong>and</strong> Ventilation Plans ..........134<br />
Figure 83 - Mark Up Map Provided to <strong>Mine</strong> Management on July 31, 2007 ..............135<br />
vi
Figure 84 - Ventilation System before August 6 Accident .............................................137<br />
Figure 85 - Fan Pressure at the Time <strong>of</strong> the August 6 Accident ....................................138<br />
Figure 86 - Ventilation Controls after Accidents ............................................................139<br />
Figure 87 – Approx. Time <strong>of</strong> Useful Consciousness vs. Oxygen Concentration ..........141<br />
Figure 88 – Steel Cables Connected to RocProps ...........................................................160<br />
Figure 89 - New Ro<strong>of</strong> Bolts <strong>and</strong> New Wire Mesh Installed in the No. 1 Entry ............161<br />
Figure 90 - Sheet <strong>of</strong> Lexan Suspended from <strong>Mine</strong> Ro<strong>of</strong>.................................................161<br />
Figure 91 - Initial Location <strong>of</strong> Seismic Events August 6-16, 2007 .................................163<br />
Figure 92 - Double Difference Locations <strong>of</strong> Seismic Events, August 6-16, 2007 ..........163<br />
Figure 93 – Bounce or Burst Activity Recorded in Comm<strong>and</strong> Center Log Book........164<br />
Figure 94 - No. 1 Entry Rescue Clean-up Progress Plotted by Day ..............................165<br />
Figure 95 - Convergence Measurements..........................................................................167<br />
Figure 96 - How Satellites <strong>and</strong> Radar Interferometry Detect Surface Movement ......L-1<br />
Figure 97 – Example <strong>of</strong> Interferogram Color B<strong>and</strong>ing from<br />
USGS Fact Sheet 2005-3025 ......................................................................L-2<br />
Figure 98 - USGS InSAR Image <strong>of</strong> Subsidence above the Accident Site......................L-3<br />
Figure 99 - Surface Deformation from USGS InSAR.....................................................L-4<br />
Figure 100 - InSAR Vertical Subsidence Contours (cm) from Neva Ridge..................L-4<br />
Figure 101 - Comparison <strong>of</strong> Vertical Subsidence from Interpreted USGS <strong>and</strong><br />
Neva Ridge InSAR Results........................................................................L-5<br />
Figure 102 - InSAR Vertical Subsidence Contours & GPS Subsidence Line Data .....L-6<br />
Figure 103 - Longwall Panels 13 to 15 GPS Surveyed Subsidence Pr<strong>of</strong>iles..................L-7<br />
Figure 104 - Mining-Induced Seismicity in Utah ............................................................N-1<br />
Figure 105 - Locations <strong>of</strong> UUSS Seismographs in the Wasatch Plateau.......................N-2<br />
Figure 106 – Locations <strong>of</strong> Selected Events showing Progressive Refinements<br />
Using Three Methods.................................................................................N-4<br />
Figure 107 - Observed <strong>and</strong> Calculated Locations for Events ........................................N-5<br />
Figure 108 - Calculated Double Difference Locations <strong>and</strong> the Location <strong>of</strong> Mining Color<br />
Coded by Month.........................................................................................N-6<br />
Figure 109 – Seismic Location <strong>of</strong> the August 6 Accident <strong>and</strong> Following Events..........N-7<br />
Figure 110 - P-Wave First Motion Analysis Examples...................................................N-8<br />
Figure 111 - Vertical Component Waveform Data for August 6, 2007 Event..............N-9<br />
Figure 112 - Source Type Plot from Ford et al. (2008).................................................N-10<br />
Figure 113 – Depth Analysis <strong>of</strong> August 6, 2007 event from Ford et al 2008...............N-11<br />
Figure 114 - General Strain-S<strong>of</strong>tening Element Characteristics...................................U-2<br />
Figure 115 - Traditional Strain-S<strong>of</strong>tening Element Distribution ..................................U-3<br />
Figure 116 - Strain-S<strong>of</strong>tening Element Distribution to Account for<br />
Corner Effects (as Deployed by AAI).......................................................U-4<br />
Figure 117 - North Barrier <strong>MSHA</strong> 2006 ARMPS Model..............................................W-2<br />
Figure 118 - South Barrier <strong>MSHA</strong> 2006 ARMPS Model ..............................................W-3<br />
vii
Figure 1 - Map <strong>of</strong> Accident Sites
EXECUTIVE SUMMARY<br />
The August 6 <strong>and</strong> 16 Accidents<br />
The Cr<strong>and</strong>all Canyon <strong>Mine</strong>, in Emery County, Utah, was operated by Genwal Resources Inc<br />
(GRI), whose parent company was acquired by a subsidiary <strong>of</strong> Murray Energy Corporation in<br />
August 2006. On August 6, 2007, at 2:48 a.m., a catastrophic coal outburst accident occurred<br />
during pillar recovery in the South Barrier section, while the section crew was mining the barrier<br />
near crosscut 139. The outburst initiated near the section pillar line (the general area where the<br />
miners were working) <strong>and</strong> propagated toward the mine portal.<br />
Within seconds, overstressed pillars failed throughout the South Barrier section over a distance <strong>of</strong><br />
approximately ½ mile. Coal was expelled into the mine openings on the section, likely causing<br />
fatal injuries to Kerry Allred, Don Erickson, Jose Luis Hern<strong>and</strong>ez, Juan Carlos Payan, Br<strong>and</strong>on<br />
Phillips, <strong>and</strong> Manuel Sanchez. The barrier pillars to the north <strong>and</strong> south <strong>of</strong> the South Barrier<br />
section also failed, inundating the section with lethally oxygen-deficient air from the adjacent<br />
sealed area(s), which may have contributed to the death <strong>of</strong> the miners. The resulting magnitude<br />
3.9 seismic event shook the mine <strong>of</strong>fice three miles away <strong>and</strong> destroyed telephone communication<br />
to the section.<br />
Federal <strong>and</strong> local authorities responded to the accident. <strong>MSHA</strong> issued an order pursuant to section<br />
103(k) <strong>of</strong> the <strong>Mine</strong> Act that required GRI to obtain <strong>MSHA</strong> approval for all plans to recover or<br />
restore operations to the affected area. <strong>Mine</strong> rescue teams were organized, a comm<strong>and</strong> center was<br />
established, <strong>and</strong> a rescue effort was initiated. After unsuccessful attempts to reach the miners by<br />
crawling over the debris, GRI developed a rescue plan, approved by <strong>MSHA</strong>, to access the<br />
entrapped miners by loading burst debris from the South Barrier section No. 1 entry using a<br />
continuous mining machine. These efforts began on August 8 at crosscut 120.<br />
On August 16, 2007, at 6:38 p.m., a coal outburst occurred from the pillar between the No. 1 <strong>and</strong><br />
No. 2 entries, adjacent to rescue workers as they were completing the installation <strong>of</strong> ground<br />
support behind the continuous mining machine. Coal ejected from the pillar dislodged st<strong>and</strong>ing<br />
ro<strong>of</strong> supports, steel cables, chain-link fence, <strong>and</strong> a steel ro<strong>of</strong> support channel, which struck the<br />
rescue workers <strong>and</strong> filled the entry with approximately four feet <strong>of</strong> debris. Ventilation controls<br />
were damaged <strong>and</strong> heavy dust filled the clean-up area, reducing visibility <strong>and</strong> impairing breathing.<br />
Also, air from inby the clean-up area containing approximately 16% oxygen migrated over the<br />
injured rescue workers. Nearby rescue workers immediately started digging out the injured miners<br />
<strong>and</strong> repairing ventilation controls. Two mine employees, Dale Black <strong>and</strong> Br<strong>and</strong>on Kimber, <strong>and</strong><br />
one <strong>MSHA</strong> inspector, Gary Jensen, received fatal injuries. Six additional rescue workers,<br />
including an <strong>MSHA</strong> inspector, were also injured.<br />
Underground rescue efforts were suspended while a group <strong>of</strong> independent ground control experts<br />
reevaluated conditions <strong>and</strong> rescue methods, although surface drilling continued. In total, seven<br />
boreholes were drilled from the surface to the mine workings. Each successive borehole provided<br />
information as to conditions in the affected area <strong>and</strong> helped to determine the location <strong>of</strong> the next<br />
hole. None <strong>of</strong> the boreholes identified the location <strong>of</strong> the entrapped miners. Ultimately, it was<br />
learned that the area where the miners were believed to have last been working sustained extensive<br />
pillar damage <strong>and</strong> had levels <strong>of</strong> oxygen that would not have sustained life.<br />
Explanation <strong>of</strong> the August 6 Collapse<br />
The August 6 collapse was not a “natural” earthquake, but rather was caused by a flawed mine<br />
design. Ultimately, it is most likely the stress level exceeded the strength <strong>of</strong> a pillar or group <strong>of</strong><br />
1
pillars near the pillar line <strong>and</strong> that local failure initiated a rapid <strong>and</strong> widespread collapse that<br />
propagated outby through the large area <strong>of</strong> similar sized pillars.<br />
Three separate methods <strong>of</strong> analysis employed as part <strong>of</strong> <strong>MSHA</strong>’s investigation confirmed that the<br />
mining plan was destined to fail. Results <strong>of</strong> the first method, Analysis <strong>of</strong> Retreat Mining Pillar<br />
Stability (ARMPS), were well below NIOSH recommendations. The second method, a finite<br />
element analysis <strong>of</strong> the mining plan, indicated a decidedly unsafe, unstable situation in the making<br />
even without pillar recovery. Similarly, the third method, boundary element analysis,<br />
demonstrated that the area was primed for a massive pillar collapse. Seismic analyses <strong>and</strong><br />
subsidence information employed in the investigation provided clarification that the collapse was<br />
most likely initiated by the mining activity. Information provided by the University <strong>of</strong> Utah<br />
Seismograph Stations (UUSS) <strong>and</strong> from satellite radar images also helped in defining the nature<br />
<strong>and</strong> extent <strong>of</strong> the collapse.<br />
The extensive pillar failure <strong>and</strong> subsequent inundation <strong>of</strong> the section by oxygen-deficient air<br />
occurred because <strong>of</strong> inadequacies in the mine design, faulty pillar recovery methods, <strong>and</strong> failure to<br />
adequately revise mining plans following coal burst accidents.<br />
GRI’s mine design was inadequate <strong>and</strong> incorporated flawed design recommendations from<br />
contractor Agapito Associates, Inc. (AAI). Although AAI had many years <strong>of</strong> experience at this<br />
mine <strong>and</strong> was familiar with the mine conditions, they conducted engineering analyses that were<br />
flawed. These design issues <strong>and</strong> faulty pillar recovery methods resulted in pillar dimensions that<br />
were not compatible with effective ground control to prevent coal bursts under the deep<br />
overburden <strong>and</strong> high abutment loading that existed in the South Barrier section.<br />
AAI’s analysis using the engineering model known as “ARMPS” was inappropriately applied.<br />
They used an area for back-analysis that experienced poor ground conditions <strong>and</strong> did not consider<br />
the barrier pillar stability factors in any <strong>of</strong> their analyses. The mine-specific ARMPS design<br />
threshold proved to be invalid, as evidenced by March 7 <strong>and</strong> 10, 2007, coal outburst accidents <strong>and</strong><br />
other pillar failures. Despite these failures, AAI recommended a pillar design for the South<br />
Barrier section that had a lower calculated pillar stability factor than recommended by the National<br />
Institute for Occupational <strong>Safety</strong> <strong>and</strong> <strong>Health</strong> (NIOSH) criteria, lower than established by their<br />
mine specific criteria, <strong>and</strong> lower than the failed pillars in the North Barrier section. AAI<br />
performed the ARMPS analysis for the South Barrier section, but did not include these results in<br />
their reports that were presented to <strong>MSHA</strong> in support <strong>of</strong> GRI’s plan submittal.<br />
AAI’s analysis using the engineering model known as “Lamodel” was flawed. They used an area<br />
for back-analysis that was inaccessible <strong>and</strong> could not be verified for known ground conditions,<br />
which resulted in an unreliable calibration <strong>and</strong> the selection <strong>of</strong> inappropriate model parameters.<br />
These model parameters overestimated pillar strength <strong>and</strong> underestimated load. AAI modeled<br />
pillars with cores that would never fail regardless <strong>of</strong> the applied load, which was not consistent<br />
with realistic mining conditions. They did not consider the indestructible nature <strong>of</strong> the modeled<br />
pillars in their interpretation <strong>of</strong> the results. Modeled abutment stresses from the adjacent longwall<br />
panels were underestimated <strong>and</strong> inconsistent with observed ground behavior <strong>and</strong> previous studies<br />
at this <strong>and</strong> nearby mines.<br />
AAI managers did not review input <strong>and</strong> output files for accuracy <strong>and</strong> completeness. They also did<br />
not review vertical stress <strong>and</strong> total displacement output at full scale, which would have shown<br />
unrealistic results <strong>and</strong> indicated that corrections were needed to the model. Following the<br />
March 10 coal outburst accident, AAI modified the model, but failed to correct the significant<br />
2
model flaws. They did not make further corrections to the model when this analysis result still did<br />
not accurately depict known failures that AAI <strong>and</strong> GRI observed in the North Barrier section.<br />
The mine designs recommended by AAI <strong>and</strong> implemented by GRI did not provide adequate<br />
ground stability to maintain the ventilation system. The designs did not consider the effects <strong>of</strong><br />
barrier pillar <strong>and</strong> remnant barrier pillar instability on separation <strong>of</strong> the working section from the<br />
adjacent sealed areas. Failure <strong>of</strong> the barrier pillars or remnant barrier pillars resulted in inundation<br />
<strong>of</strong> the section by lethally oxygen-deficient air. AAI <strong>and</strong> GRI also did not consider the effects <strong>of</strong><br />
ground stability on ventilation controls in the bleeder system. GRI allowed frequent destruction <strong>of</strong><br />
ventilation controls by ground movement <strong>and</strong> by air blasts from caving. GRI mined cuts from the<br />
barrier pillar in the South Barrier section between crosscuts 139 <strong>and</strong> 142 intended to be left<br />
unmined to protect the bleeder system.<br />
GRI’s mining practices, including bottom mining <strong>and</strong> additional barrier slabbing between<br />
crosscuts 139 <strong>and</strong> 142, reduced the strength <strong>of</strong> the barrier <strong>and</strong> increased stress levels in the vicinity<br />
<strong>of</strong> the miners. As pillars were recovered in the South Barrier section, bottom coal (a layer <strong>of</strong> coal<br />
left in the mine floor after initial mining) was mined from cuts made into the production pillars<br />
<strong>and</strong> barrier. The effect <strong>of</strong> this activity was to reduce the strength <strong>of</strong> the remnant barrier behind the<br />
retreating pillar line. Bottom mining was not addressed in AAI’s model to evaluate the mine<br />
design or in GRI’s approved ro<strong>of</strong> control plan. Similarly, barrier mining was conducted in<br />
violation <strong>of</strong> the approved ro<strong>of</strong> control plan. A portion <strong>of</strong> the barrier immediately inby the last<br />
known location <strong>of</strong> the miners was mined even though it was required by the ro<strong>of</strong> control plan to be<br />
left unmined. Barriers are solid blocks <strong>of</strong> coal left between two mines or sections <strong>of</strong> a mine to<br />
provide protection. Although neither <strong>of</strong> these actions is a fundamental cause <strong>of</strong> the August 6<br />
collapse, they increased the amount <strong>of</strong> load transferred to pillars at the working face <strong>and</strong> reduced<br />
the strength <strong>of</strong> the barrier adjacent to it.<br />
The mine operator did not report three coal outbursts that occurred prior to August 6 to <strong>MSHA</strong> or<br />
properly revise its mining plan following these coal bursts. Between late 2006 <strong>and</strong> February 2007,<br />
the 448-foot wide barrier north <strong>of</strong> Main West was developed by driving four entries parallel to the<br />
existing Main West entries. Smaller barriers remained on either side <strong>of</strong> the new section entries (53<br />
feet wide on the south side <strong>and</strong> 135 feet wide on the north side). The 135-foot wide barrier that<br />
separated the North Barrier section from the adjacent longwall panel gob was insufficient to<br />
isolate the workings from substantial abutment loading. Despite the high stress levels associated<br />
with deep cover (up to 2,240 feet <strong>of</strong> overburden) <strong>and</strong> longwall abutment stress, the section<br />
remained stable during development. However, as pillar recovery operations retreated under a<br />
steadily increasing depth <strong>of</strong> overburden, conditions worsened. On March 7, 2007, a non-injury<br />
coal outburst accident occurred that knocked miners down, damaged a ventilation control, <strong>and</strong><br />
caused a delay in mining. These worsening conditions culminated in a March 10, 2007, outburst<br />
accident <strong>of</strong> sufficient magnitude to cause the mining section to be ab<strong>and</strong>oned.<br />
Between March <strong>and</strong> July 2007, four entries were developed in the barrier south <strong>of</strong> Main West.<br />
Once again, the section was developed without incident but conditions worsened during pillar<br />
recovery. On August 3, 2007, another non-injury coal outburst accident occurred as the night shift<br />
crew was mining. Coal was thrown into the entries dislodging timbers <strong>and</strong> burying the continuous<br />
mining machine cable. The continuous mining machine operator was struck by coal.<br />
GRI did not notify <strong>MSHA</strong> <strong>of</strong> these three coal outburst accidents within 15 minutes as required by<br />
30 CFR 50.10. GRI’s failure denied <strong>MSHA</strong> the opportunity to investigate these accidents <strong>and</strong><br />
ensure that corrective actions were taken before mining resumed in the affected area. GRI did not<br />
3
submit written reports <strong>of</strong> these accidents to <strong>MSHA</strong> or plot coal bursts on a mine map available for<br />
inspection by <strong>MSHA</strong> <strong>and</strong> miners as required.<br />
These reporting failures were particularly critical because they deprived <strong>MSHA</strong> <strong>of</strong> the information<br />
it needed to properly assess <strong>and</strong> approve GRI’s mining plans. Under Federal regulations, a mine<br />
operator is required to develop <strong>and</strong> submit to <strong>MSHA</strong> a “ro<strong>of</strong> control plan” suitable to the<br />
prevailing geological conditions <strong>and</strong> the mining system to be used at the mine. <strong>MSHA</strong> has an<br />
opportunity to review <strong>and</strong> approve or disapprove the plan. <strong>MSHA</strong> had specifically separated the<br />
operator’s proposed mining plans into four separate plans, addressing different stages <strong>of</strong> the<br />
mining process, <strong>and</strong> had asked the mine operator to communicate any problems encountered so<br />
that <strong>MSHA</strong> could evaluate the safety <strong>of</strong> the plans as mining progressed. <strong>MSHA</strong> was only to<br />
approve the “retreat mining” phases <strong>of</strong> the project if favorable conditions were observed during<br />
development <strong>of</strong> the sections. However, the operator failed to make <strong>MSHA</strong> aware <strong>of</strong> the extent <strong>of</strong><br />
the violent conditions encountered during mining <strong>and</strong> did not make <strong>MSHA</strong> aware <strong>of</strong> the severity<br />
<strong>of</strong> the March 10 coal outburst. <strong>MSHA</strong> approved the operator’s plans to conduct retreat mining in<br />
the South Barrier, where the fatal accident ultimately occurred, without the benefit <strong>of</strong> this critical<br />
information.<br />
Additionally, GRI continued pillar recovery without adequately revising their mining methods<br />
when conditions <strong>and</strong> accident history indicated that their ro<strong>of</strong> control plan was not suitable for<br />
controlling coal bursts. GRI investigations <strong>of</strong> non-injury coal burst accidents did not result in<br />
adequate changes <strong>of</strong> pillar recovery methods to prevent similar occurrences before continued<br />
mining. GRI did not consult with AAI or propose revisions to their ro<strong>of</strong> control plan following<br />
the August 3, 2007, coal outburst accident in the South Barrier section, even though pillar<br />
conditions were similar to the failed area in the North Barrier section.<br />
Explanation <strong>of</strong> the August 16 Accident<br />
The August 16 accident occurred because rescue <strong>of</strong> the entrapped miners required removal <strong>of</strong><br />
compacted coal debris from an entry affected by the August 6 accident. Entry clean-up reduced<br />
confining pressure on the failed pillars <strong>and</strong> increased the potential for additional bursts. Methods<br />
for installing ground control systems required rescue workers to travel near areas with high burst<br />
potential. Methods were not available to determine the maximum coal burst intensity that the<br />
ground support system would be subjected to. On August 16, the coal burst intensity exceeded the<br />
capacity <strong>of</strong> the support system. No alternatives to these methods were available to rescue the<br />
entrapped miners. As a result, only suspension <strong>of</strong> underground rescue efforts could have<br />
prevented this accident.<br />
Prior to the August 16 accident, underground rescue efforts were only likely to have been<br />
suspended had definitive information been available to indicate that the entrapped miners could<br />
not have survived the accident. Information was not sufficient to fully evaluate conditions on the<br />
section prior to this accident. Sufficient resources, including drilling resources, should have been<br />
deployed. The rescue attempt imposed greater risks on rescue workers than would be accepted for<br />
normal mining. However, the prospect <strong>of</strong> saving the entrapped miners’ lives warranted the heroic<br />
efforts <strong>of</strong> the rescue workers. The greater risks imposed on the rescue workers underscore the<br />
high degree <strong>of</strong> care that must be taken by mine operators to prevent catastrophic pillar failures.<br />
4
GENERAL INFORMATION<br />
The Cr<strong>and</strong>all Canyon <strong>Mine</strong>, located near Huntington in Emery County, Utah, was opened into<br />
the Hiawatha bituminous coal seam through five drift openings. At the time <strong>of</strong> the accident, the<br />
mine operated with one working section (South Barrier section) <strong>and</strong> one spare section (3 rd North<br />
section). The miners, including 63 underground <strong>and</strong> 4 surface employees, were not represented<br />
by a labor organization. Coal was loaded from a continuous mining machine onto shuttle cars<br />
<strong>and</strong> transported to the section loading point, where it was dumped onto a belt <strong>and</strong> conveyed to<br />
the surface. Personnel <strong>and</strong> materials were transported via diesel-powered, rubber-tired, mobile<br />
equipment. An atmospheric monitoring system (AMS) was used for fire detection <strong>and</strong><br />
monitoring other mine systems, including: electrical power, conveyor belt status, tonnage mined,<br />
air quality, <strong>and</strong> fan operation. An AMS operator was stationed on the surface to monitor <strong>and</strong><br />
respond to AMS signals <strong>and</strong> alarms. Two-way voice communication was provided by pager<br />
phones installed throughout the underground mine <strong>and</strong> hardwired to various locations on the<br />
surface. A Personal Emergency Device (PED) system was used at the mine to send one-way text<br />
messages from the surface to selected miners who wore PED receiver units integrated with their<br />
cap lamp battery. To comply with the post-accident tracking requirements <strong>of</strong> the MINER Act,<br />
GRI established five zones from the portal to the South Barrier section for tracking the location<br />
<strong>of</strong> underground personnel (see Appendix C). As miners passed from one zone to another, they<br />
reported their location over the pager phone system to the AMS operator who tracked their<br />
movements.<br />
Coal was mined seven days per week during two 12-hour shifts. Day shift production crews<br />
worked from 7:00 a.m. to 7:00 p.m. <strong>and</strong> night shift production crews worked from 6:00 p.m. to<br />
6:00 a.m. Maintenance personnel worked 5:00 a.m. to 5:00 p.m. during day shift <strong>and</strong> 5:00 p.m.<br />
to 5:00 a.m. during night shift. One set <strong>of</strong> day <strong>and</strong> night shift crews worked Monday through<br />
Thursday <strong>and</strong> another set worked Friday through Monday. Everyone worked on Monday, which<br />
was referred to as a “double-up day.” Preshift examinations were conducted on established<br />
8-hour intervals beginning at 3:00 a.m., 11:00 a.m., <strong>and</strong> 7:00 p.m.<br />
The coal resources within the Cr<strong>and</strong>all Canyon <strong>Mine</strong> mining permit boundary are owned by<br />
either the Federal Government or the State <strong>of</strong> Utah <strong>and</strong> are leased for mining to GRI. The U.S.<br />
Department <strong>of</strong> the Interior through the Bureau <strong>of</strong> L<strong>and</strong> Management (BLM) manages the Federal<br />
coal <strong>and</strong> the Utah School <strong>and</strong> Institutional Trust L<strong>and</strong>s <strong>Administration</strong> manages the State coal.<br />
Mining plans for the Federal leases must be approved by BLM <strong>and</strong> must comply with a Resource<br />
Recovery Protection Plan (R2P2) to ensure diligent extraction <strong>of</strong> all minable coal. The R2P2 is<br />
approved by BLM, within the mining capabilities <strong>of</strong> the operator, to achieve maximum economic<br />
recovery <strong>of</strong> the Federal coal. BLM inspectors monitor compliance with the approved R2P2<br />
through underground inspections. Since the mine is entirely within the Manti-LaSal National<br />
Forest, the R2P2 also addresses the impacts <strong>of</strong> mining on surface l<strong>and</strong>s <strong>and</strong> water resources that<br />
are managed by the United States Forest Service.<br />
The reserve was first opened between 1939 <strong>and</strong> 1955, when a small area at the portal was mined<br />
<strong>and</strong> then ab<strong>and</strong>oned. Genwal Coal Company Inc rehabilitated the old mine workings <strong>and</strong><br />
resumed production in 1983 (see Appendix D). Room <strong>and</strong> pillar mining was utilized <strong>and</strong><br />
included pillar recovery (<strong>of</strong>ten referred to as retreat mining) from panels.<br />
The mine was acquired by Nevada Power in 1989. In 1990, 50% interest was purchased by the<br />
Intermountain Power Agency (IPA), a political subdivision <strong>of</strong> the State <strong>of</strong> Utah. In 1995,<br />
Andalex Resources Inc (ARI), a Delaware corporation operating in Utah, acquired Nevada<br />
5
Power’s 50% ownership <strong>of</strong> the Cr<strong>and</strong>all Canyon <strong>Mine</strong>. The other 50% ownership was retained<br />
by IPA. ARI operated the mine through its subsidiary Genwal Resources Inc (GRI). Also in<br />
1995, GRI contracted Agapito Associates, Inc. (AAI), a mining consultant group based in Gr<strong>and</strong><br />
Junction, Colorado, to conduct technical studies for longwall mining the remaining reserves.<br />
<strong>Report</strong>s for these studies were finalized in November <strong>and</strong> December, 1995. The Main West<br />
entries, inby crosscut 107, were mined in 1995 with the intention <strong>of</strong> developing north-south<br />
oriented longwall panels from them. However, AAI’s fracture orientation report (Fracture<br />
Orientation Study <strong>and</strong> Implications on Longwall Panel Orientation) recommended an east-west<br />
orientation for longwall panels, so the longwall entries were not developed from the Main West.<br />
AAI continued to provide consulting services to GRI, including a study to refine their ground<br />
control model for the Cr<strong>and</strong>all Canyon <strong>Mine</strong> in 1997. In June 1999, a longwall district north <strong>of</strong><br />
Main West was completed <strong>and</strong> sealed, leaving a 448-foot wide barrier north <strong>of</strong> Main West<br />
(North Barrier).<br />
A longwall district south <strong>of</strong> Main West was mined from 1999 to 2003. The Main West entries<br />
were separated from these longwall panels by a 438-foot wide minimum dimension barrier<br />
(South Barrier). During this period, the Main West entries provided a return air course for the<br />
longwall bleeder system through a connection at the western end <strong>of</strong> these entries. This longwall<br />
district was sealed in April 2003, <strong>and</strong> longwall production moved to the eastern portion <strong>of</strong> the<br />
mine. The Main West was sealed inby crosscut 118 in November 2004 due, in part, to<br />
deterioration <strong>of</strong> ro<strong>of</strong> <strong>and</strong> coal pillars caused by abutment loads from the adjacent longwall<br />
districts. GRI had planned to mine the Main West Barriers inby crosscut 118 by accessing them<br />
through Main West. The need to seal the Main West prompted GRI to propose revised mining<br />
projections to BLM. Also in 2003, GRI opened the adjacent South Cr<strong>and</strong>all Canyon <strong>Mine</strong> <strong>and</strong><br />
the two operations shared surface facilities.<br />
The last longwall panel at the Cr<strong>and</strong>all Canyon <strong>Mine</strong> was completed in October 2005. Mining<br />
was then limited to pillar recovery in the South Mains. Rooms were developed into barrier<br />
pillars adjacent to the South Mains, just ahead <strong>of</strong> the northward retreating pillar line. With this<br />
approach, barrier pillars outby the section loading point remained intact.<br />
John T. Boyd Company, mining <strong>and</strong> geological consultants, conducted a coal reserve estimate<br />
for ARI in December 2005 that identified recoverable reserves in the Main West as areas outby<br />
the crosscut 118 seals. The map <strong>of</strong> the reserve estimate illustrated that both barriers would be<br />
recovered east <strong>of</strong> crosscut 118 by mining a series <strong>of</strong> 3-4 rooms north <strong>and</strong> south from the original<br />
5-entry Main West, similar to the method used to recover the South Mains. In January 2006,<br />
Rothschild Inc. prepared a “Confidential Information Memor<strong>and</strong>um” for ARI to assist potential<br />
transaction parties. This document included a map entitled “Cr<strong>and</strong>all Canyon <strong>Mine</strong> Recoverable<br />
Reserves As Of January 1, 2006” that also showed no projected mining in the Main West<br />
barriers west <strong>of</strong> crosscut 118.<br />
Early in 2006, GRI devised a plan to develop <strong>and</strong> recover the Main West North <strong>and</strong> South<br />
Barriers inby crosscut 118. In April 2006, GRI contacted AAI to evaluate ground control <strong>and</strong><br />
pillar stability associated with this plan. AAI provided a draft report to GRI (see Appendix F),<br />
which concluded that GRI’s plan should be “a workable design <strong>and</strong> limit geotechnical risk to an<br />
acceptable level.”<br />
On August 9, 2006, UtahAmerican Energy Inc. (UEI), a Utah corporation, acquired ARI,<br />
including its wholly owned subsidiary GRI. UEI was wholly owned by Murray Energy<br />
Corporation, an Ohio corporation. Murray Energy Corporation’s stock was wholly owned by<br />
6
Robert E. Murray. AAI continued to work for GRI, <strong>and</strong> provided further analyses confirming<br />
the viability <strong>of</strong> GRI’s plan to recover the Main West barriers (see Appendix G). Coal production<br />
ceased at the South Cr<strong>and</strong>all Canyon <strong>Mine</strong> at the end <strong>of</strong> August.<br />
During the last quarter <strong>of</strong> 2006, pillar recovery in the South Mains was completed <strong>and</strong> mining <strong>of</strong><br />
the North Barrier section was initiated. Four entries were developed through the Main West<br />
North Barrier beneath overburden ranging from 1,500 to 2,240 feet. AAI visited the section on<br />
December 1, 2006, <strong>and</strong> reported that “There was no indication <strong>of</strong> problematic pillar yielding or<br />
ro<strong>of</strong> problems that might indicate higher-than-predicted abutment loads” (see Appendix H).<br />
Pillar recovery began in February 2007. The two southern pillars were extracted <strong>and</strong> the<br />
northernmost pillar was left intact to establish a bleeder system.<br />
On March 10, 2007, a non-injury coal outburst accident occurred on the North Barrier section<br />
that severely damaged pillars <strong>and</strong> ventilation controls <strong>and</strong> caused GRI to ab<strong>and</strong>on the section.<br />
Mining equipment was moved to the South Barrier section while coal was produced on a spare<br />
section in the 3 rd North Mains. The North Barrier section was sealed on March 27, 2007, inby<br />
crosscut 118, <strong>and</strong> GRI commissioned AAI to refine the pillar design for the South Barrier<br />
section. In this area, AAI recommended that GRI develop larger pillar dimensions, slab the<br />
barrier south <strong>of</strong> the No. 1 entry, <strong>and</strong> avoid skipping pillars during recovery under the deepest<br />
overburden (see Appendix I).<br />
Four entries were developed through the length <strong>of</strong> the Main West South Barrier with entry<br />
centerlines spaced 80 feet apart <strong>and</strong> crosscut centerlines every 130 feet (80 x 130-foot centers)<br />
beneath overburden ranging from 1,300 to 2,160 feet. A 55-foot wide barrier separated the<br />
section from room notches mined <strong>of</strong>f the No. 1 entry <strong>of</strong> the Main West, <strong>and</strong> a 121-foot wide<br />
barrier separated it from the sealed longwall Panel 13 to the south. The average mining height<br />
was approximately 8 feet. During development up to 5 feet <strong>of</strong> bottom coal was left in the<br />
western portion <strong>of</strong> the section.<br />
Pillar recovery <strong>of</strong> the South Barrier section began on July 15, 2007, <strong>and</strong> continued until the<br />
August 6, 2007, accident. The approved ro<strong>of</strong> control plan permitted mining up to 40 feet deep<br />
cuts into the barrier pillar south <strong>of</strong> the No. 1 entry during pillar recovery, except in the area<br />
between crosscuts 139 <strong>and</strong> 142 (see Appendix J). This area was to remain unmined to protect<br />
the bleeder entry where the section had been narrowed to three entries. Additional production<br />
was gained during pillar recovery by ramping down into the bottom coal during cuts from the<br />
pillars. <strong>Safety</strong> precautions for this type <strong>of</strong> mining were not addressed in the approved ro<strong>of</strong><br />
control plan.<br />
Officials for parties controlling the mine operation at the time <strong>of</strong> the accidents included:<br />
Robert E. Murray .............................President, Murray Energy Corporation<br />
P. Bruce Hill............................... President <strong>and</strong> CEO <strong>of</strong> UEI, ARI, <strong>and</strong> GRI<br />
Robert D. Moore ........................................Treasurer <strong>of</strong> UEI, ARI, <strong>and</strong> GRI<br />
Michael O. McKown .................................Secretary <strong>of</strong> UEI, ARI, <strong>and</strong> GRI<br />
Laine Adair ................................... General Manager <strong>of</strong> UEI, ARI, <strong>and</strong> GRI<br />
James Poulson..................................<strong>Safety</strong> Manager <strong>of</strong> UEI, ARI, <strong>and</strong> GRI<br />
Gary Peacock ...................................................<strong>Mine</strong> Superintendent <strong>of</strong> GRI<br />
Bodee Allred .............................................................<strong>Safety</strong> Director <strong>of</strong> GRI<br />
7
Table 1 shows recent Non-Fatal Days Lost (NFDL) accident incidence rates for the mine prior to<br />
the fatal accidents, <strong>and</strong> the comparable national rates for mines <strong>of</strong> similar type <strong>and</strong> classification.<br />
A fatal accident (powered haulage) occurred at the Cr<strong>and</strong>all Canyon <strong>Mine</strong> in 1997.<br />
Table 1 - Accident Incidence Rates<br />
Calendar<br />
Year<br />
NFDL Incidence Rate<br />
National/Cr<strong>and</strong>all<br />
Total Incident Rate<br />
National/Cr<strong>and</strong>all<br />
2005 5.16/2.46 7.34/4.92<br />
2006 4.83/2.50 6.99/2.50<br />
2007 4.60/3.47* 6.35/3.47*<br />
*2007 values for Cr<strong>and</strong>all Canyon <strong>Mine</strong> are for January-June.<br />
<strong>MSHA</strong> completed its last quarterly regular health <strong>and</strong> safety inspection <strong>of</strong> Cr<strong>and</strong>all Canyon <strong>Mine</strong><br />
on July 2, 2007. <strong>MSHA</strong> started a new inspection on July 5, 2007, which was ongoing at the time<br />
<strong>of</strong> the accidents.<br />
DESCRIPTION OF THE ACCIDENT<br />
August 6 Accident Description<br />
Night shift mechanics Jameson Ward <strong>and</strong> Tim Harper started their shifts at 5:00 p.m. on<br />
August 5, 2007. Ward entered the mine at 5:10 p.m. <strong>and</strong> drove to the South Barrier section.<br />
Harper gathered supplies from the warehouse before entering the mine to set up a new scoop<br />
charging station at the junction <strong>of</strong> Main West <strong>and</strong> the 3 rd North entries. When Ward arrived on<br />
the section, he parked his pick-up truck in the No. 1 entry, near the section charging station, <strong>and</strong><br />
walked to the continuous mining machine in the No. 1 entry to see if they were having any<br />
maintenance problems. The day shift production crew was mining the barrier pillar between<br />
crosscuts 140 <strong>and</strong> 141. After 20 minutes, Ward returned to the section charging station <strong>and</strong><br />
started repairing a scoop.<br />
The night shift production crew entered the mine at 6:00 p.m. <strong>and</strong> traveled to the South Barrier<br />
section. Crew members included: Benny Allred (section foreman), Kerry Allred (shuttle car<br />
operator), Br<strong>and</strong>on Phillips (utility man), Jose Luis Hern<strong>and</strong>ez (shuttle car operator), Manuel<br />
Sanchez (continuous mining machine operator), Don Erickson (shuttle car operator/step-up<br />
foreman), <strong>and</strong> Juan Carlos Payan (mobile ro<strong>of</strong> support operator). They arrived on the section at<br />
6:25 p.m. <strong>and</strong> relieved the day shift crew, which had mined a total <strong>of</strong> four cuts from the barrier<br />
pillar. Larry Powell (maintenance foreman) also arrived on the section at this time <strong>and</strong> helped<br />
Ward repair the scoop at the section charging station. Mining resumed in the barrier pillar after<br />
shift change.<br />
At 7:44 p.m., a magnitude 2.2 seismic event originated near the section. Erickson was<br />
conducting the preshift examination near the charging station when he <strong>and</strong> Powell heard a noise<br />
that sounded like a large cave inby the pillar line. Erickson went to the face to investigate. He<br />
did not report any hazards during the preshift examination.<br />
Gale Anderson (shift foreman), Benny Allred, <strong>and</strong> Powell were scheduled to attend training the<br />
next morning <strong>and</strong> planned to leave work early. Anderson traveled to the section <strong>and</strong> met with<br />
Erickson about his duties as responsible person <strong>and</strong> section foreman in their absence. They<br />
reviewed mining plans <strong>and</strong> work assignments. Mining in the barrier pillar was approaching<br />
8
crosscut 139. At this point, breaker posts would need to be set <strong>and</strong> the conveyor belt <strong>and</strong> power<br />
center would need to be moved outby before pillar recovery between the Nos. 1 <strong>and</strong> 3 entries<br />
could resume. Shortly after 9:00 p.m., Benny Allred gave his notebook <strong>and</strong> PED light to<br />
Erickson. Erickson gave his preshift report to Benny Allred to record in the examination book.<br />
Benny Allred asked Ward to help Erickson that night, if needed. Anderson, Benny Allred, <strong>and</strong><br />
Powell left the section. Before leaving the mine, Anderson <strong>and</strong> Benny Allred met with outby<br />
mine examiners Brent Hardee, Tim Curtis, <strong>and</strong> Brian Pritt. Anderson provided them with a list<br />
<strong>of</strong> tasks <strong>and</strong> Benny Allred asked them to retrieve his Self-Contained Self-Rescuer (SCSR) from<br />
the section.<br />
At approximately 11:30 p.m., Ward finished repairing the scoop <strong>and</strong> started helping Phillips<br />
move the first aid trailer <strong>and</strong> rock dusting machine outby. Curtis drove to the section <strong>and</strong><br />
retrieved Benny Allred’s SCSR before helping Hardee <strong>and</strong> Pritt clean out an area for storing<br />
conveyor belt structure at Main West crosscut 18. At 11:43 p.m., Richard Maxwell (material<br />
man) arrived at the mine <strong>and</strong> started making repairs to his diesel-powered supply tractor.<br />
Maxwell drove the tractor into the mine at 1:33 a.m., August 6, 2007, to check supplies on the<br />
section.<br />
By 2:00 a.m., Ward <strong>and</strong> other section crew members had started setting breaker posts inby<br />
crosscut 139. Harper had finished work on the 3 rd North charging station, but his truck would<br />
not start <strong>and</strong> he called Ward for assistance. Ward checked with Erickson to see if he could leave<br />
the section to help Harper. Erickson agreed, but told Ward that he needed to finish setting the<br />
breaker posts before leaving.<br />
Hardee, Curtis, <strong>and</strong> Pritt completed cleaning the area at Main West crosscut 18 <strong>and</strong> drove their<br />
pick-up trucks outside, exiting the mine at 2:09 a.m. While on the surface, they unloaded<br />
material gathered from the work site. Pritt <strong>and</strong> Curtis reentered the Cr<strong>and</strong>all Canyon <strong>Mine</strong> in a<br />
pick-up truck at 2:21 a.m., as Hardee prepared to conduct preshift examinations in the South<br />
Cr<strong>and</strong>all Canyon <strong>Mine</strong>.<br />
At approximately 2:30 a.m., Maxwell arrived at crosscut 133 <strong>of</strong> the South Barrier section <strong>and</strong><br />
checked section supplies. No supplies were needed. He turned his tractor around <strong>and</strong> started<br />
driving back outby. At 2:36 a.m., Hardee entered the South Cr<strong>and</strong>all Canyon <strong>Mine</strong> to conduct<br />
examinations. By 2:45 a.m., Ward had finished setting breaker posts. He called Harper to tell<br />
him he was on his way <strong>and</strong> left the section.<br />
At 2:48 a.m., as the section crew continued mining the barrier pillar near crosscut 139, a<br />
catastrophic coal outburst accident initiated near the pillar line in the South Barrier section <strong>and</strong>,<br />
within seconds, pillar failures propagated outby to approximately crosscut 119. Coal was<br />
violently expelled into the entries where Kerry Allred, Don Erickson, Jose Luis Hern<strong>and</strong>ez,<br />
Juan Carlos Payan, Br<strong>and</strong>on Phillips, <strong>and</strong> Manuel Sanchez were working. All approaches to the<br />
section were blocked, entrapping the six miners. The barrier pillars to the north <strong>and</strong> south <strong>of</strong> the<br />
South Barrier section also failed, inundating the entrapped miners’ work area with lethally<br />
oxygen-deficient air from the adjacent sealed area(s).<br />
The resulting magnitude 3.9 mining-induced seismic event shook the mine <strong>of</strong>fice, located on the<br />
surface three miles from the section, where it was felt by Lel<strong>and</strong> Lobato <strong>and</strong> Mark Toomer,<br />
atmospheric monitoring system (AMS) operators. AMS alarms reported communication failure<br />
from sensors throughout the South Barrier section <strong>and</strong> the Nos. 6 <strong>and</strong> 7 conveyor belts stopped.<br />
Air displaced by the ground failure rushed outby in a dust cloud that destroyed or damaged<br />
9
stoppings from the accident site outby to crosscut 93 <strong>and</strong> the overcasts at crosscut 90 <strong>and</strong> 91.<br />
The resulting short circuit to the ventilation system reduced fan pressure by 1 inch water gauge<br />
(w.g.).<br />
Ward had just exited the South Barrier section entries <strong>and</strong> was driving through Main West<br />
crosscut 109 when he was struck by the air blast, causing his truck to slide sideways (refer to<br />
Figure 2 for location <strong>of</strong> miners). Realizing that ventilation was disrupted, he got out <strong>of</strong> his<br />
vehicle to assess the situation. After confirming that the nearest two stoppings were destroyed,<br />
he drove to a phone at Main West crosscut 103.<br />
Figure 2 - Location <strong>of</strong> <strong>Mine</strong>rs during August 6 Accident<br />
Maxwell was driving outby from the section at Main West crosscut 91 when his supply tractor<br />
was hit by the air blast. He was pelted in the open vehicle by dust <strong>and</strong> pieces <strong>of</strong> foam sealant<br />
from the destroyed ventilation controls. He continued driving outby to crosscut 85. After the<br />
dust cleared, he turned around <strong>and</strong> started driving inby.<br />
Harper was waiting for Ward at Main West crosscut 35 when he heard a large rumble, which<br />
roared past him, high up in the mine ro<strong>of</strong>. A large gust <strong>of</strong> air followed, blowing two nearby<br />
metal airlock doors open <strong>and</strong> closed. He was peppered with small rocks <strong>and</strong> his right eardrum<br />
was injured. Thinking that the event was a large ro<strong>of</strong> fall close to his location, Harper went to a<br />
nearby phone <strong>and</strong> called Lobato, who was trying to contact the section. Lobato told Harper that<br />
the section had lost power, Nos. 6 <strong>and</strong> 7 belts were down, the water gauge on the fan changed,<br />
<strong>and</strong> the building he was in outside shook hard.<br />
Pritt <strong>and</strong> Curtis were driving toward the mine entrance <strong>and</strong> did not feel the effects <strong>of</strong> the pillar<br />
failure. Hardee also did not feel the event from his location in the South Cr<strong>and</strong>all Canyon <strong>Mine</strong>.<br />
When Ward reached the phone at crosscut 103, he called Harper <strong>and</strong> they discussed their<br />
observations. Harper asked Ward to pick him up so they could travel to the section <strong>and</strong> find out<br />
10
what had happened. As Ward continued driving outby, Harper called Lobato <strong>and</strong> told him to<br />
contact Erickson <strong>and</strong> let him know that they were headed his way. Lobato sent a message to the<br />
PED light Erickson had been given, instructing him to call the AMS operator. As Ward reached<br />
crosscut 88, he passed Maxwell, who had stopped at a phone to call Lobato. Lobato told<br />
Maxwell that he thought an earthquake had occurred. Maxwell told Lobato to start calling the<br />
section. Lobato continued attempting to contact miners in the working section, without success.<br />
Maxwell drove inby crosscut 93, where he saw damaged stoppings <strong>and</strong> turned around <strong>and</strong> started<br />
driving outby.<br />
Pritt <strong>and</strong> Curtis were unaware <strong>of</strong> the collapse when they exited the mine at 2:53 a.m. Pritt<br />
dropped Curtis <strong>of</strong>f to start examining the No. 1 conveyor belt. Pritt drove his pick-up truck back<br />
into the mine to begin his preshift examination <strong>of</strong> the No. 2 conveyor belt. When he reached the<br />
Main West entries, at 3:01 a.m., Pritt received a PED message instructing him to call the AMS<br />
operator. He went to a nearby phone at Main West crosscut 4 <strong>and</strong> called Lobato, who briefed<br />
him on the situation. Pritt told Lobato to send a PED message to Erickson <strong>and</strong> let them know<br />
that he was on his way to the section. Pritt asked Lobato to contact Curtis <strong>and</strong> have him continue<br />
walking the belts inby until Pritt found out what was going on. Pritt also spoke to Harper, just<br />
before Ward arrived at crosscut 35. Ward picked up Harper <strong>and</strong> they sped toward the section, as<br />
Pritt started driving inby from crosscut 4. Lobato sent PED messages to Curtis, Hardee, <strong>and</strong><br />
Erickson.<br />
Ward <strong>and</strong> Harper encountered thick dust inby crosscut 96, where they saw destroyed stoppings.<br />
At approximately 3:12 a.m., they stopped just inby crosscut 113 where a large piece <strong>of</strong> coal<br />
blocked the roadway. Harper walked to a phone near crosscut 112 <strong>and</strong> called Lobato. Harper<br />
instructed him to call Gary Peacock (mine superintendent) <strong>and</strong> tell him that there was a cave-in,<br />
that all the stoppings were blown out inby crosscut 96, <strong>and</strong> that they were going to try to advance<br />
into the section. Meanwhile, Pritt met Maxwell near crosscut 88. Maxwell parked his supply<br />
tractor <strong>and</strong> got into Pritt's truck. They called Lobato <strong>and</strong> instructed him to notify Peacock that<br />
something had happened. Lobato telephoned Peacock at his home. Pritt <strong>and</strong> Maxwell continued<br />
driving toward the section as Ward <strong>and</strong> Harper explored inby crosscut 113.<br />
Pritt <strong>and</strong> Maxwell arrived near crosscut 112, called Lobato, <strong>and</strong> confirmed that the phone<br />
worked. Pritt tried to contact the section <strong>and</strong> received no response. Maxwell returned to his<br />
supply tractor to gather materials for reestablishing ventilation.<br />
While exploring inby crosscut 113, Ward <strong>and</strong> Harper heard loud, deep rumbling from continued<br />
movement <strong>of</strong> the surrounding strata <strong>and</strong> observed sloughing <strong>of</strong> the ribs <strong>and</strong> mine ro<strong>of</strong>. Debris in<br />
the travelway <strong>and</strong> poor visibility hindered their travel. They returned to the phone where they<br />
met Pritt. Pritt convinced Ward that they needed to wait for mine rescue apparatuses before<br />
attempting to advance inby. Pritt called Toomer <strong>and</strong> asked him to bring in as many mine rescue<br />
breathing apparatuses as he could find. During this call, the AMS operators relayed Pritt’s<br />
information to Peacock by telephone. Pritt also told Peacock that they lost communications with<br />
the section <strong>and</strong> that stoppings were down.<br />
Hardee finished his preshift examination <strong>of</strong> the South Cr<strong>and</strong>all Canyon <strong>Mine</strong> <strong>and</strong> drove to the<br />
foremen’s room, located inside the Cr<strong>and</strong>all Canyon <strong>Mine</strong>, at 3:22 a.m. As he prepared to record<br />
his examination results, Hardee overheard Pritt requesting breathing apparatuses. Hardee joined<br />
the conversation <strong>and</strong> volunteered to get the apparatuses. At 3:25 a.m., Hardee drove his pick-up<br />
truck to the mine <strong>of</strong>fice building <strong>and</strong> ran upstairs to the AMS <strong>of</strong>fice, where Lobato was on the<br />
phone with Peacock. Hardee briefly spoke with Peacock to tell him he was going into the mine.<br />
11
Peacock told Hardee that an overcast at crosscut 91 was damaged, <strong>and</strong> he wanted him to check<br />
that out before he went any farther inby. Curtis had completed the preshift examination <strong>of</strong> the<br />
No. 1 conveyor belt <strong>and</strong> called the AMS operator in response to several PED messages. Hardee<br />
answered, informed Curtis <strong>of</strong> the accident, <strong>and</strong> arranged to pick him up at Main West crosscut 4.<br />
Hardee located four mine rescue apparatuses (Dräger BG174 A, 4-hour units) <strong>and</strong> two Dräger<br />
30-minute fire-fighting units in the mine <strong>of</strong>fice building <strong>and</strong> loaded them into his pick-up truck,<br />
along with materials to repair ventilation controls. He entered the mine at 3:36 a.m. <strong>and</strong> drove to<br />
Main West crosscut 4, where he picked up Curtis, <strong>and</strong> then continued driving inby toward the<br />
section.<br />
Peacock started notifying other mine <strong>of</strong>ficials at 3:30 a.m. Peacock first called Bodee Allred <strong>and</strong><br />
told him to get the mine rescue team headed to the mine <strong>and</strong> to contact <strong>MSHA</strong>, in that order. At<br />
3:37 a.m., Allred called Jeff Palmer <strong>and</strong> Hubert Wilson (mine rescue team members) <strong>and</strong> told<br />
them to start calling other team members. Allred called the <strong>MSHA</strong> toll-free number for<br />
immediately reportable accidents at 3:43 a.m. He reported that there was a bounce, they had an<br />
unintentional cave while pillaring in the mine, <strong>and</strong> they lost ventilation. Allred also indicated<br />
that they could not see past crosscut 92 <strong>and</strong> they did not know if stoppings were knocked out. At<br />
3:51 a.m., the <strong>MSHA</strong> toll-free phone operator notified William Denning (<strong>MSHA</strong> District 9 staff<br />
assistant) in Denver, Colorado, who initiated <strong>MSHA</strong>’s response.<br />
The seismic event associated with the accident was detected by the University <strong>of</strong> Utah<br />
Seismograph Stations (UUSS) network. Several minutes later Dr. Walter Arabasz (Director <strong>of</strong><br />
UUSS) was paged by an automated system. The page indicated that a local magnitude 4.0 event<br />
had been detected. Protocol for events larger than 3.5 magnitude required some personnel to go<br />
to the network operations center <strong>and</strong> issue a press release. A check <strong>of</strong> the automated posting on<br />
the UUSS website indicated that the event was in central Utah. Dr. James Pechmann (University<br />
<strong>of</strong> Utah seismologist) was also paged by the system. Working from his home computer, Dr.<br />
Pechmann quickly reviewed the data. He then proceeded to the network operations center.<br />
At the network operations center, Dr. Arabasz met Dr. Pechmann <strong>and</strong> Relu Burlacu (seismic<br />
network manager). Notifications were made to parties on a prescribed list. UUSS decided to<br />
notify the Carbon <strong>and</strong> Emery County Sheriffs’ Offices because it was believed they might<br />
receive calls from the public. Dr. Arabasz told the Sheriffs’ Offices that, from the general<br />
character <strong>of</strong> the seismic event, it might be a mining-related event. Neither Sheriff’s Office had<br />
received any reports or information on the event. The notification phone call was made to the<br />
Emery County Sheriff’s Office at 3:47 a.m. Five minutes later, Toomer called the Emery County<br />
Sheriff's Office <strong>and</strong> reported, “We had a big cave in up here, <strong>and</strong> we're probably going to need<br />
an ambulance. We're not for sure, yet, because we haven't heard from anybody in the section.”<br />
An ambulance <strong>and</strong> an Emery County Sheriff's Officer were then dispatched to the mine.<br />
The Carbon County Sheriff’s Office called UUSS back at approximately 4:00 a.m. <strong>and</strong> reported<br />
that there had been a collapse at the Cr<strong>and</strong>all Canyon <strong>Mine</strong>. Dr. Arabasz called the Emery<br />
County Sheriff’s Office back to inquire if the mine operator had publicly confirmed a collapse.<br />
Based on this conversation, Dr. Arabasz determined that they had not. Operating under the<br />
belief that it was more appropriate for the mine operator to release the details <strong>of</strong> the collapse,<br />
between 4:10 <strong>and</strong> 4:20 a.m., UUSS called the Associated Press <strong>and</strong> relayed only the location,<br />
magnitude, <strong>and</strong> time <strong>of</strong> the event.<br />
12
Meanwhile, Pritt, Ward, <strong>and</strong> Harper waited near crosscut 113 for Hardee <strong>and</strong> Curtis to deliver<br />
mine rescue apparatuses. Hardee <strong>and</strong> Curtis stopped at crosscut 91, where they confirmed that<br />
the overcasts were damaged. They determined that a nearby regulator was intact, which would<br />
limit the short-circuit <strong>of</strong> air caused by the damaged overcasts. As they continued driving inby,<br />
light dust was still suspended in the air from crosscut 93 to 109. Inby crosscut 109, dust limited<br />
visibility to one crosscut. Shortly before 4:00 a.m., Hardee <strong>and</strong> Curtis met Pritt, Ward, <strong>and</strong><br />
Harper <strong>and</strong> they started exploring the No. 1 entry together. Near crosscut 115, Curtis detected<br />
between 19.0 <strong>and</strong> 19.5% oxygen. All five miners retreated to their vehicles to obtain breathing<br />
apparatuses to cope with the dusty atmosphere. However, the four, 4-hour mine rescue<br />
apparatuses brought in by Hardee were outdated <strong>and</strong> unusable. Only the two 30-minute, firefighting<br />
units were ready for use.<br />
Since Curtis <strong>and</strong> Pritt were trained members <strong>of</strong> the fire brigade, they wore the 30-minute firefighting<br />
units while resuming exploration in the No. 1 entry. Harper <strong>and</strong> Ward donned their<br />
SCSRs <strong>and</strong> followed Curtis <strong>and</strong> Pritt. Hardee did not don any type <strong>of</strong> unit. He trailed behind the<br />
group <strong>and</strong> eventually turned back to reestablish ventilation. As the group advanced, they<br />
encountered increased depths <strong>of</strong> coal <strong>and</strong> destroyed stoppings covered with debris. After<br />
advancing a few crosscuts, the ro<strong>of</strong> started working <strong>and</strong> they retreated to crosscut 113. A few<br />
minutes later, they resumed exploration in the No. 1 entry <strong>and</strong> advanced to approximately<br />
crosscut 123. After encountering oxygen levels <strong>of</strong> 16% <strong>and</strong> adverse ro<strong>of</strong> conditions, they<br />
returned to crosscut 113 <strong>and</strong> developed a plan to explore the No. 3 entry.<br />
Pritt, Ward, Curtis, <strong>and</strong> Harper then traveled in the No. 2 entry, before crossing the belt into the<br />
No. 3 entry. They soon encountered very unstable ground conditions <strong>and</strong> retreated outby. As<br />
they crossed back over the belt, Pritt tried to communicate with the entrapped miners by beating<br />
on the waterline, but there was no response. When they returned to the phone near crosscut 112,<br />
they called <strong>and</strong> briefed Peacock, who had arrived at the mine.<br />
Pritt <strong>and</strong> Harper remained at the phone while Curtis, Hardee, <strong>and</strong> Ward traveled outby to<br />
reestablish ventilation. Curtis <strong>and</strong> Hardee assessed damage as they walked the belt entry toward<br />
each other from crosscuts 93 <strong>and</strong> 103, respectively, while Ward drove outside to obtain<br />
ventilation materials. Maxwell was already on the surface, loading his supply tractor with<br />
ventilation materials.<br />
By 4:20 a.m., other mine <strong>of</strong>ficials <strong>and</strong> emergency vehicles, including an ambulance <strong>and</strong> an<br />
Emery County Sheriff's Officer, began arriving at the mine. Denning informed William Taylor<br />
(<strong>MSHA</strong> supervisory coal mine inspector) <strong>of</strong> the accident. Taylor called Barry Grosely (<strong>MSHA</strong><br />
Coal mine inspector) <strong>and</strong> assigned him to travel to the mine, issue a 103(k) order, <strong>and</strong> call Taylor<br />
at the <strong>MSHA</strong> Price Field Office with an update. Taylor traveled to the field <strong>of</strong>fice <strong>and</strong> gathered<br />
equipment needed to respond to the accident.<br />
At 4:30 a.m., Curtis <strong>and</strong> Hardee completed their assessment <strong>of</strong> ventilation controls in the belt<br />
entry <strong>and</strong> traveled to the phone near the No. 5 conveyor belt drive to report their findings. All <strong>of</strong><br />
the metal stoppings <strong>and</strong> some <strong>of</strong> the block stoppings inby crosscut 93 were damaged or<br />
destroyed. Hardee stopped the No. 5 conveyor belt <strong>and</strong> requested that the remaining conveyor<br />
belts be shut <strong>of</strong>f from the surface. Hardee <strong>and</strong> Curtis started working outby, beginning repairs<br />
while awaiting additional supplies from the surface. Ward exited the mine at 4:36 a.m. <strong>and</strong><br />
loaded his truck with polyurethane foam spray packs. Six minutes later, Maxwell reentered the<br />
mine with his supply tractor loaded with ventilation materials, followed by Ward.<br />
13
At 4:41 a.m., Grosely called the mine <strong>and</strong> issued an order pursuant to section 103(k) <strong>of</strong> the <strong>Mine</strong><br />
Act that prohibited all activity in the section until <strong>MSHA</strong> determined that it was safe to resume<br />
normal mining operations in the affected area. The order also required the mine operator to<br />
obtain prior approval from an authorized representative for all plans to recover or restore<br />
operations to the affected area. Five minutes later, a magnitude 2.1 seismic event occurred near<br />
the South Barrier section, followed by two smaller events within the next two minutes.<br />
Underground Rescue Efforts<br />
Underground rescue efforts were initiated on the morning <strong>of</strong> August 6. These efforts included<br />
exploring approaches to the South Barrier section, restoring ventilation, cleaning up the rubble in<br />
approaches to the South Barrier section, <strong>and</strong> breaching the No. 1 seal in Main West. Grosely, the<br />
first <strong>MSHA</strong> employee on site, arrived at 5:44 am. Thereafter, <strong>MSHA</strong> evaluated the mine<br />
operator’s specific rescue plans <strong>and</strong> approved them under the 103(k) order. GRI’s comm<strong>and</strong><br />
center was established on the second floor <strong>of</strong> the warehouse building as required in their<br />
Emergency Response Plan. The <strong>MSHA</strong> <strong>Mine</strong> Emergency Operations (MEO) mobile comm<strong>and</strong><br />
center vehicle arrived from Price, Utah, at 10:15 a.m. It was parked near the entrance to the<br />
mine portal access road, adjacent to GRI’s comm<strong>and</strong> center. <strong>MSHA</strong> <strong>and</strong> GRI jointly coordinated<br />
the rescue efforts from these locations. Efforts also were made to locate the entrapped miners<br />
with seismic equipment <strong>and</strong> by drilling boreholes.<br />
Allyn Davis (<strong>MSHA</strong> District 9 manager) arrived on the afternoon <strong>of</strong> August 6 <strong>and</strong> assumed<br />
control <strong>of</strong> <strong>MSHA</strong>’s onsite responsibilities. Richard Stickler (Assistant Secretary <strong>of</strong> Labor) <strong>and</strong><br />
Kevin Stricklin (Administrator for Coal <strong>Mine</strong> <strong>Safety</strong> <strong>and</strong> <strong>Health</strong>) arrived during the afternoon <strong>of</strong><br />
August 7. Three <strong>MSHA</strong> Technical Support ro<strong>of</strong> control specialists worked onsite during the<br />
rescue <strong>and</strong> advised <strong>MSHA</strong> decision-makers on ro<strong>of</strong> control issues. They consulted with other<br />
Technical Support employees <strong>and</strong> outside experts. Details <strong>of</strong> the rescue efforts are explained in<br />
the following sections <strong>of</strong> this report.<br />
Attempts to Explore South Barrier Section <strong>and</strong> Main West Sealed Area<br />
The operator developed a plan to remove debris from the South Barrier No. 4 entry <strong>and</strong> to use<br />
mine rescue teams to search for an access route to the entrapped miners. Under this plan, mine<br />
rescue teams would explore all approaches to the South Barrier section. If no route to the section<br />
could be found, the operator intended to breach the Main West No. 1 seal. <strong>Mine</strong> rescue teams<br />
would explore for a route through the Main West entries to a point adjacent to the entrapped<br />
miners, where they could drill or mine through the remaining barrier pillar into the working<br />
section. The operator presented this plan to <strong>MSHA</strong> <strong>and</strong>, at 6:00 a.m. on August 6, Grosely<br />
modified the 103(k) order to “permit the necessary personnel to travel underground to make<br />
repairs to damaged ventilation devices, work on installing a belt tailpiece <strong>and</strong> feeder breaker at<br />
crosscut 120 in the number two entry, clean <strong>and</strong> advance in the No. 4 entry towards crosscut 124<br />
<strong>and</strong> to open the number one seal in the Old Main West entries inby crosscut 118 <strong>and</strong> use mine<br />
rescue teams to explore within established mine rescue procedures. Ventilation will be<br />
established as necessary for the operation <strong>of</strong> necessary mining equipment. Additional equipment<br />
<strong>and</strong> materials will be moved underground as deemed necessary for current recovery<br />
operations.”<br />
At 6:40 a.m., fourteen members <strong>of</strong> the UEI mine rescue teams entered the mine to explore<br />
approaches to the section (see Figure 3). Eighteen other miners remained in the mine to repair<br />
ventilation controls, set up the feeder/breaker, belt tailpiece, <strong>and</strong> begin the clean-up work. All<br />
other miners were evacuated from the mine. At 7:40 a.m., Taylor debriefed Harper, Ward, <strong>and</strong><br />
14
Pritt. Ward told Taylor that the crew was mining <strong>of</strong>f the No. 1 entry at crosscut 139 into the<br />
barrier before he left the section.<br />
After 8:00 a.m., mine rescue team members from Energy West Mining Company also entered<br />
the mine. Grosely, R<strong>and</strong>y Gunderson (<strong>MSHA</strong> coal mine inspector), <strong>and</strong> a group <strong>of</strong> miners,<br />
including mine rescue team members, explored approaches to the South Barrier section by<br />
traveling back <strong>and</strong> forth between the Nos. 1 <strong>and</strong> 4 entries in an attempt to find a route to the<br />
entrapped miners. Entries <strong>and</strong> crosscuts were largely filled with debris, while intersections were<br />
less filled. They advanced to crosscut 126 where they encountered debris within inches <strong>of</strong> the<br />
ro<strong>of</strong> <strong>and</strong> oxygen below 16%. A decision was made to retreat.<br />
Figure 3 - South Barrier Section Rescue Area<br />
Showing Ground Conditions <strong>and</strong> Rescue Attempts.<br />
Rescuers attempted to provide breathable air to the entrapped miners by utilizing the fresh water<br />
pipeline along the conveyor belt. The water was shut <strong>of</strong>f <strong>and</strong> the pipeline was drained as much<br />
as possible by opening fire valves. A PED message stating “OPEN VALVE ON H2O 4 AIR”<br />
was sent to the cap lamp Erickson was wearing. Erickson was the only entrapped crew member<br />
wearing a PED device. A compressor was set up between crosscuts 109 <strong>and</strong> 110 in the No. 2<br />
entry. The compressor was attached to the water line <strong>and</strong> started. A second PED message<br />
stating “PUMPING AIR THRU WATERLINE” was sent at 11:04 a.m.<br />
By noon, the mine rescue teams had established a fresh air base (FAB) one crosscut outby the<br />
No. 1 seal <strong>and</strong> began the arduous work <strong>of</strong> breaching the seal. At 1:55 p.m., the teams reported<br />
to the comm<strong>and</strong> center that a 3 x 3-foot area <strong>of</strong> material, 8 inches deep into the seal, had been<br />
removed. By 2:50 p.m., a small opening through the seal had been made <strong>and</strong> by 3:20 p.m., a<br />
2 x 2-foot hole was completed through the seal.<br />
Brad Allen (<strong>MSHA</strong> coal mine inspector/<strong>Mine</strong> Emergency Unit (MEU) member) <strong>and</strong> five mine<br />
rescue team members entered the sealed area <strong>and</strong> began exploration at 4:42 p.m. The<br />
15
irrespirable atmosphere behind the seal contained 6.0% to 6.8% oxygen, 62 parts-per-million<br />
(ppm) carbon monoxide, <strong>and</strong> no methane. The team advanced in the Nos. 1, 2, <strong>and</strong> 3 entries to<br />
near crosscut 121 where they encountered impassable ro<strong>of</strong> falls. They attempted to advance into<br />
the No. 4 entry but the ro<strong>of</strong> had deteriorated <strong>and</strong> it was unsafe to travel. During the exploration,<br />
the ground was working <strong>and</strong> bounces were occurring. Because <strong>of</strong> these unstable conditions <strong>and</strong><br />
the fact that travel routes were impassable in Nos. 1, 2, 3, <strong>and</strong> 4 entries, the team retreated to the<br />
FAB.<br />
After evaluating the information from the team’s exploration, the comm<strong>and</strong> center requested that<br />
they attempt to advance into the No. 5 entry. At 5:02 p.m., as the team prepared to reenter the<br />
sealed area, a fall or burst in the sealed area (registering as a magnitude 2.6 seismic event) forced<br />
low oxygen through the breached seal <strong>and</strong> over the FAB. All personnel located in the FAB<br />
quickly evacuated to a safe area outby. The team returned to the seal <strong>and</strong> covered the opening<br />
with curtain to limit air leakage. Due to the poor conditions encountered behind the seals, all<br />
attempts to explore the sealed area were suspended <strong>and</strong> mine rescue team members were<br />
withdrawn from the mine.<br />
While the exploration was continuing, the UUSS issued the following press release at 3:40 p.m.<br />
explaining that further analysis had revised the location <strong>and</strong> magnitude <strong>of</strong> the seismic event:<br />
The preliminary location <strong>and</strong> magnitude <strong>of</strong> today's earthquake are consistent with the<br />
shock being a type <strong>of</strong> earthquake that is induced by underground coal mining. The<br />
general region <strong>of</strong> the earthquake's epicenter is an area that has experienced a high level<br />
<strong>of</strong> mining-induced earthquake activity for many decades. The largest <strong>of</strong> past mininginduced<br />
earthquakes had magnitudes in the 3.5 to 4.2 range, which encompasses the size<br />
<strong>of</strong> today's earthquake (3.9). On the basis <strong>of</strong> present evidence, however, the possibility<br />
that today's shock was a natural earthquake cannot be ruled out. The broad region <strong>of</strong><br />
central Utah experiences normal tectonic earthquakes in addition to mining-induced<br />
earthquakes. For example, in 1988 a magnitude 5.2 earthquake occurred 40 km<br />
southeast <strong>of</strong> today's earthquake.<br />
Seismologists have not conclusively determined how the earthquake <strong>of</strong> August 6 might be<br />
related to the occurrence <strong>of</strong> a collapse at the nearby Cr<strong>and</strong>all Canyon coal mine that, as<br />
<strong>of</strong> midday August 6, had left six miners unaccounted for. The epicenter <strong>of</strong> the seismic<br />
event is close to the mine. We do not have an authoritative report <strong>of</strong> the time at which the<br />
collapse occurred. If the collapse occurred nearly simultaneously with the earthquake,<br />
we would consider it likely that the earthquake is the seismic signature <strong>of</strong> the collapse.<br />
At this point, more information-- both from the mine <strong>and</strong> from more seismological<br />
analyses--will be needed to piece together cause <strong>and</strong> effect relations for today's M3.9<br />
earthquake.<br />
Rescue Efforts in South Barrier Section Nos. 3 <strong>and</strong> 4 Entries<br />
Soon after exploratory efforts indicated that entries were impassible, GRI developed a plan to<br />
use mining equipment to reestablish a route to the missing miners. Fallen ro<strong>of</strong> rock encountered<br />
in the No. 1 entry precluded using that entry initially because a ro<strong>of</strong> bolting machine was not<br />
immediately available. The No. 2 entry contained section belt structure that would have<br />
hindered the recovery process. At that time, conditions in Nos. 3 <strong>and</strong> 4 entries were most<br />
conducive for the underground rescue effort. The recovery plan was implemented in No. 4 entry.<br />
The South Barrier section loading equipment was inby the blocked entries. Therefore, two loadhaul-dump<br />
(LHD) diesel powered loaders were borrowed from a nearby mine to move the<br />
16
material. Additional equipment was moved to the rescue site from other areas <strong>of</strong> the mine,<br />
including an electrical power transformer, a radio remote controlled continuous mining machine,<br />
<strong>and</strong> a feeder breaker.<br />
The removal <strong>of</strong> material from the entries began during the afternoon <strong>of</strong> August 6, 2007. Initially<br />
material was cleared for installation <strong>of</strong> a feeder breaker in No. 2 entry outby crosscut 120.<br />
Rubble was also cleared from crosscut 120, between Nos. 1 <strong>and</strong> 4 entries. The two LHDs were<br />
used to remove material in the No. 3 entry to crosscut 121, in crosscut 121 between the Nos. 3<br />
<strong>and</strong> 4 entries, <strong>and</strong> in the No. 4 entry inby crosscut 121. The rubble was loaded <strong>and</strong> dumped<br />
outby in accessible areas near crosscuts 116, 117, <strong>and</strong> 118. Entries were cleared by taking a<br />
single LHD bucket width down the center <strong>of</strong> the entry. Coal was left along both rib lines.<br />
Timbers were set for support in crosscut 120 between the Nos. 3 <strong>and</strong> 4 entries. The crosscut was<br />
not traveled after timbers were set. The day shift crew was relieved at approximately 7:00 p.m.<br />
<strong>and</strong> clean-up work continued into the night shift. The feeder breaker <strong>and</strong> belt were being<br />
installed but were not operational as the diesel loaders were used to remove debris.<br />
On August 7, 2007, a burst occurred in the clean-up area. UUSS registered a magnitude 2.8<br />
seismic event at 1:13 a.m., which coincided with the approximate time <strong>of</strong> the burst. Ron Paletta<br />
(<strong>MSHA</strong> coal mine inspector) was st<strong>and</strong>ing near the feeder breaker with Benny Allred <strong>and</strong> Gale<br />
Anderson. The burst knocked Paletta to the ground <strong>and</strong> again damaged or destroyed ventilation<br />
controls to crosscut 93. The burst put a large amount <strong>of</strong> dust into suspension throughout the area<br />
<strong>and</strong> limited visibility to only a few feet. There were no injuries associated with this event.<br />
However, the burst partially refilled approximately 300 feet <strong>of</strong> entry that had been cleared (see<br />
Figure 4). Neither LHD was in the area refilled by burst material. One LHD was loading loose<br />
coal near the feeder between the Nos. 2 <strong>and</strong> 3 entries <strong>and</strong> the other LHD was outby the feeder in<br />
the No. 3 entry. All miners were withdrawn to crosscut 109 <strong>and</strong> accounted for.<br />
Figure 4 - View <strong>of</strong> No. 3 Entry after August 7 Burst<br />
Entry cleaned by diesel loaders refilled with rubble (view indicated by arrow in index map insert).<br />
17
Rescue Efforts in South Barrier Section No. 1 Entry<br />
Laine Adair, Gary Peacock, <strong>and</strong> Josh Fielder (section foreman) traveled underground to crosscut<br />
120, evaluated the effects <strong>of</strong> the August 7 burst, <strong>and</strong> developed a new plan that was subsequently<br />
approved by <strong>MSHA</strong>. The new plan relocated the rescue operation from the No. 4 entry to the<br />
No. 1 entry (see Figure 3). The No. 1 entry was adjacent to the 121-foot wide barrier <strong>and</strong><br />
appeared to be in the best condition. In addition to the 18 miners already assigned to work in the<br />
area, 12 miners were assigned to complete work outby crosscut 109 in preparation for advancing<br />
in the No. 1 entry.<br />
Before clean-up in the No. 1 entry was initiated, <strong>MSHA</strong> deployed a small portable seismic<br />
detection system consisting <strong>of</strong> several sensors <strong>and</strong> a receiver/recorder. The portable system was<br />
transported from its storage location in Pittsburgh, Pennsylvania, taken underground on<br />
August 7, 2007, <strong>and</strong> deployed in the No. 1 entry at crosscut 121. This system was designed to<br />
locate people over short distances, up to approximately 200 feet. The sensors were placed on<br />
ro<strong>of</strong> bolts <strong>and</strong> on the mine floor <strong>and</strong> monitored for 30 minutes. No signals from miners were<br />
detected. The unit was then moved to the No. 2 entry at crosscut 120, where sensors were<br />
attached to the section water supply pipe. After pounding on the pipe, the system was monitored<br />
for 30 minutes. No response was detected. The portable system was not used again.<br />
Preparation for Rescue Effort in No. 1 Entry<br />
On August 8, 2007, the 103(k) order was modified to allow recovery operations to continue in<br />
accordance with approved site specific plans. The initial site specific plan used for cleaning <strong>and</strong><br />
advancing in the No. 1 entry <strong>of</strong> the South Barrier section was also approved on August 8, 2007.<br />
This was the base plan throughout the remaining rescue effort, with revisions or addendums<br />
approved as needed. This approach eliminated the need to modify the 103(k) order each time<br />
there was a change in work procedures or method <strong>of</strong> cleaning up, without compromising the<br />
<strong>MSHA</strong> approval process. Once the plan was agreed upon by the company <strong>and</strong> <strong>MSHA</strong>, it was<br />
ready for implementation.<br />
In the initial plan, electrical power to the clean-up area was supplied through a power center<br />
located in crosscut 119 between the No. 1 <strong>and</strong> No. 2 entries. The coal was to be loaded with a<br />
continuous mining machine. Shuttle cars or scoops would transport the material to the feeder<br />
located in the No. 2 entry between crosscuts 119 <strong>and</strong> 120 <strong>and</strong> the material would be carried out<br />
<strong>of</strong> the mine by conveyor belts.<br />
The plan stipulated that the ventilation system would utilize the No. 1 entry for intake with the<br />
No. 2 entry being the belt haulage entry <strong>and</strong> the Nos. 3 <strong>and</strong> 4 entries would be utilized as the<br />
return air course. Ventilation to the area would be established by constructing ventilation<br />
controls at the following locations:<br />
• Between No. 1 <strong>and</strong> No. 2 entries at crosscuts 90-119.<br />
• Between No. 2 <strong>and</strong> No. 3 entries at crosscuts 90-119.<br />
• In No. 2 entry between crosscut 120 <strong>and</strong> 121 (belt entry isolation curtain).<br />
• Between No. 1 <strong>and</strong> No. 2 entries from crosscut 121 to 137 as recovery work advanced in<br />
the No. 1 entry.<br />
The clean-up work did not begin immediately in the No. 1 entry. All <strong>of</strong> the ventilation controls<br />
that had been damaged or destroyed by the August 7 burst were rebuilt before loading was<br />
started. Stopping repairs were completed on August 8, at 1:55 a.m. The continuous mining<br />
machine was moved to the No. 1 entry inby crosscut 120 <strong>and</strong> the electrical power center was<br />
18
elocated to crosscut 119 between the No. 1 <strong>and</strong> No. 2 entries. A fresh air base was established<br />
at crosscut 119. A pager phone was connected between the clean-up area <strong>and</strong> the FAB. A<br />
person was stationed at the FAB at all times to maintain communication with the clean-up area<br />
<strong>and</strong> the comm<strong>and</strong> center on the surface.<br />
The approved site specific plan also addressed the ro<strong>of</strong> support system to be installed in the<br />
clean-up area. As clean-up advanced in the No. 1 entry, additional ro<strong>of</strong> <strong>and</strong> rib control measures<br />
were implemented. The ro<strong>of</strong> support portion <strong>of</strong> the plan required:<br />
(A) As cleanup progresses ro<strong>of</strong> support will be installed on 2.5' centers using rock props<br />
[sic] or 8"x8" square sets on both sides <strong>of</strong> the entry. The square sets will be capped<br />
with Jack Pots for active support.<br />
(B) Screen mesh will be installed between the rib <strong>and</strong> the entry to confine rib roll <strong>and</strong><br />
protect employees <strong>and</strong> roadway.<br />
(C) As each crosscut is completed 5/8" cable will be wrapped around these props to<br />
secure them from pushing out.<br />
Since 6 x 8-inch hard wood timbers were stronger <strong>and</strong> more immediately available than the<br />
8 x 8-inch pine square sets specified in the plan, Item A was modified to include them at<br />
1:05 p.m. on August 8, as follows:<br />
(A) As cleanup progresses ro<strong>of</strong> support will be installed on 2.5' centers using rock props<br />
[sic] or 8"x8"pine square sets or, 6X8 hard wood with 8" dimension perpendicular to<br />
the rib, on both sides <strong>of</strong> the entry. The square sets <strong>and</strong> the 6X8 hard wood will be<br />
capped with Jack Pots for active support.<br />
In addition to the items required for equipment setup, the initial plan listed several special<br />
precautions:<br />
(A) The continuous miner operator will be protected by a 4'x8' sheet <strong>of</strong> ½" thick Lexan<br />
secured at top <strong>and</strong> bottom. Conveyer belting may be used in place <strong>of</strong> Lexan until<br />
Lexan arrives.<br />
(B) All unnecessary persons will be kept outby the fresh air base located at x-cut 119.<br />
(C) Life Line will be maintained in the entry up to the continuous miner operator<br />
location. Additional reflective tape will be added to life line.<br />
(D) If mining conditions change significantly, mining will stop <strong>and</strong> the plan will be reevaluated<br />
before mining resumes.<br />
(E) Additional SCSRs will be stored at the fresh air base at x-cut 119; so that every<br />
person inby x-cut 115 will have access to two SCSRs.<br />
The ro<strong>of</strong> had deteriorated between the No. 1 <strong>and</strong> No. 2 entries at crosscut 120. This area<br />
extended from the No. 1 entry to the location <strong>of</strong> the feeder breaker in No. 2 entry <strong>and</strong> required<br />
additional ro<strong>of</strong> bolting before the area could be safely traveled. Thus additional mining<br />
equipment, including a twin boom ro<strong>of</strong>-bolting machine, had to be moved into the area.<br />
As specified in the plan, pressurized ro<strong>of</strong>-to-floor st<strong>and</strong>ing supports were installed along pillar<br />
ribs for protection from pillar bursts. On August 8, 6 x 8-inch hardwood wood posts were<br />
installed on both sides <strong>of</strong> the No. 1 entry beginning at crosscut 118, narrowing the roadway to<br />
14 feet. These posts were capped with Jackpots to actively preload each support between the<br />
ro<strong>of</strong> <strong>and</strong> floor (see Figure 5). The wood posts were installed in the No. 1 entry to midway<br />
19
etween crosscut 119 <strong>and</strong> 120 until RocProps (telescoping steel supports exp<strong>and</strong>ed with high<br />
pressure water) were available. Thereafter, RocProps were used exclusively as ro<strong>of</strong>-to-floor<br />
support (see Figure 6). After the supports were installed, chain-link fence was installed between<br />
the rib <strong>and</strong> the row <strong>of</strong> supports to confine dislodged coal <strong>and</strong> to protect miners <strong>and</strong> the roadway.<br />
Additionally, 5/8-inch steel cables were wrapped around the RocProps to secure them from being<br />
dislodged.<br />
Figure 5 - Hardwood Posts Installed with Jackpots in No. 1 Entry<br />
Figure 6 - RocProps, Cables, <strong>and</strong> Chain-link Fencing Installed in the No. 1 Entry<br />
20
On the evening <strong>of</strong> August 8, the underground RocProp installation was completed to the<br />
continuous mining machine located just inby crosscut 120 in the No. 1 entry. Just prior to<br />
beginning the clean-up efforts, company <strong>of</strong>ficials accompanied by <strong>MSHA</strong> inspectors brought<br />
news media personnel into the mine. The news media crew was in the clean-up area for a short<br />
period <strong>of</strong> time filming the rescue efforts.<br />
Material Clean-Up from the No. 1 Entry<br />
Clean-up work began at approximately 6:00 p.m. on August 8, 2007, in the No. 1 entry <strong>and</strong><br />
advanced as rescue workers developed efficient means to remove coal, install st<strong>and</strong>ing support,<br />
address damaged ro<strong>of</strong> supports, <strong>and</strong> advance ventilation <strong>and</strong> cables. Initially, material was<br />
hauled by electric shuttle cars. After clean-up in the No. 1 entry had advanced inby crosscut 122,<br />
diesel Ramcars arrived from another mine <strong>and</strong> were used to transport material to the feeder.<br />
On August 10, 2007, an addendum to the approved plan was implemented. The addendum<br />
addressed three concerns:<br />
• No one, including equipment operators, was allowed inby the support (props or timbers).<br />
If the continuous mining machine was not advancing, personnel may be allowed to work<br />
inby the RocProps <strong>and</strong> timbers as long as the ro<strong>of</strong> is supported to perform maintenance <strong>of</strong><br />
the equipment, limited support work, removal <strong>of</strong> debris from the rubble, etc.<br />
• The maximum clean-up distance was not to exceed the inby end <strong>of</strong> the shuttle car<br />
operator’s cab. The shuttle car operators cab shall not extend beyond the last row <strong>of</strong><br />
RocProps <strong>and</strong>/or timbers.<br />
• The rock dust was to be applied in conjunction with the installation <strong>of</strong> ro<strong>of</strong> support to the<br />
furthermost extent <strong>of</strong> those supports.<br />
Also, on August 10, <strong>MSHA</strong> approved a plan for two people, one from <strong>MSHA</strong> <strong>and</strong> one<br />
representing UEI, to explore the No. 1 entry inby the continuous mining machine. At<br />
12:43 p.m., Barry Grosely <strong>and</strong> Gary Peacock left the FAB <strong>and</strong> crawled over the rubble inby the<br />
continuous mining machine at crosscut 123 in the No. 1 entry. Radios were provided for<br />
communication with outby rescue workers during the exploration <strong>and</strong> the team carried multi-gas<br />
detectors. Since neither carried a mine rescue-breathing apparatus during this excursion, they<br />
were to retreat immediately if the oxygen content fell below 19.5% or the carbon monoxide level<br />
elevated to 50 PPM. If bumping or bouncing occurred, they were to retreat to a supported area<br />
immediately. The two-man team advanced to near crosscut 124 where they lost communication<br />
<strong>and</strong> retreated outby. Another attempt was made in the No. 4 entry by Bodee Allred <strong>and</strong> Peter<br />
Saint (<strong>MSHA</strong> coal mine inspector <strong>and</strong> MEU member). Saint was able to crawl to near crosscut<br />
126 where the entry was impassable <strong>and</strong> they retreated. Air quality readings taken at the deepest<br />
point <strong>of</strong> advance indicated 20.9% oxygen. These were the last attempts to explore in advance <strong>of</strong><br />
the clean-up operation.<br />
As loading advanced inby crosscut 123, rescuers observed that part <strong>of</strong> the barrier south <strong>of</strong> the<br />
No. 1 entry had moved northward as a result <strong>of</strong> the initial August 6 ground failure. The barrier<br />
rib had shifted northward as a unit, as much as 10 feet. In some areas the displaced barrier slid<br />
along the immediate ro<strong>of</strong> <strong>and</strong> tore loose the original ro<strong>of</strong> mesh (see Figure 7). In other areas, the<br />
immediate ro<strong>of</strong> was carried northward <strong>and</strong> damaged the original installed ro<strong>of</strong> bolts (Figure 8).<br />
21
Figure 7- Damaged Ro<strong>of</strong> Bolts <strong>and</strong> Torn Mesh after August 6 Accident<br />
Resulting from Northward Movement <strong>of</strong> Southern Barrier<br />
Figure 8 - Damaged Ro<strong>of</strong> Bolts in No. 1 Entry after August 6 Accident<br />
Resulting from Northward Movement <strong>of</strong> Southern Barrier. Mesh shown was installed during<br />
rescue operations, over damaged original ro<strong>of</strong> bolts. Camera view is indicated by arrow in index map insert.<br />
The procedures for advancing in the No. 1 entry were again modified on August 11, 2007. The<br />
additional requirements were focused on limiting the exposure <strong>of</strong> the workers <strong>and</strong> strengthening<br />
the support system. Under this revision, workers were not allowed in the clean-up area unless<br />
they were designated by the foreman. The clean-up distance that could be advanced before the<br />
support system had to be installed also was restricted. The advancement <strong>of</strong> the continuous<br />
mining machine was limited to the distance it took to set three sets <strong>of</strong> RocProps. There was a<br />
22
stipulation that this distance could be increased if conditions improved. However, both <strong>MSHA</strong><br />
<strong>and</strong> UEI had to agree on the increased distance prior to implementation. To limit the exposure <strong>of</strong><br />
workers inby supports, the RocProps were required to be set one at a time.<br />
Another modification required three steel cables to be installed outside the RocProps instead <strong>of</strong><br />
the one cable previously required. The cables were to be installed at the top, middle, <strong>and</strong> bottom<br />
<strong>of</strong> the supports. Each steel cable would wrap around a RocProp <strong>and</strong> be fastened to itself in<br />
40-foot increments. Each cable was required to be connected to a separate RocProp <strong>and</strong><br />
terminated using three clamps.<br />
Additional ventilation requirements were also stipulated in this modification. Permanent<br />
ventilation controls were to replace the temporary controls inby crosscut 120. A h<strong>and</strong>held<br />
detector was to be placed in the No. 3 entry on the return side <strong>of</strong> the door at crosscut 120 until an<br />
atmospheric monitoring system oxygen sensor could be installed. Also, all shuttle car operators<br />
were required to have an extra SCSR in the operator’s compartment at all times.<br />
On August 11, 2007, Peacock reported that ground stress had migrated eastward <strong>and</strong> affected<br />
pillars outby the Main West seals. <strong>MSHA</strong> examined the area <strong>and</strong> mapped these ground<br />
conditions in the Main West entries <strong>and</strong> the North <strong>and</strong> South Barrier workings outby crosscut<br />
119. Pillar damage was noted up to three crosscuts outby the seals, to near crosscut 115 (see<br />
Figure 3). The damaged ribs were sloughed due to abutment stress from the area to the west. At<br />
that time, it appeared that the ground stress had stabilized <strong>and</strong> was no longer progressing<br />
eastward. Clean-up in the No. 1 entry had advanced near crosscut 124.<br />
On August 12, ro<strong>of</strong> deterioration was observed near crosscut 115 in the No. 1 entry. Steel<br />
channels were installed for additional support in this area (see Figure 9). The channels were<br />
supported on both ends with hardwood posts. At the time, clean-up in the No. 1 entry had<br />
advanced just inby crosscut 124. The No. 1 entry was packed with rubble the full width <strong>and</strong><br />
height <strong>of</strong> the original mined opening. The continuous mining machine was loading from a<br />
rubble pile that resembled an unmined coal face (see Figure 10 <strong>and</strong> Figure 11). Observations <strong>of</strong><br />
RocProps tilted from vertical prompted <strong>MSHA</strong> to install a measurement point to monitor<br />
horizontal movement between crosscuts 123 <strong>and</strong> 124.<br />
Figure 9 - Steel Channels Installed in No. 1 Entry to Support Deteriorated Ro<strong>of</strong><br />
23
Figure 10 - No. 1 Entry Packed with Coal Rubble Inby Crosscut 124<br />
Figure 11 - Continuous Mining Machine in Loading Area Inby Crosscut 124<br />
24
A revised plan for loading loose material in No. 1 entry was approved on August 13, 2007. This<br />
was the last addendum to the rescue <strong>and</strong> recovery plan, which stipulated the following:<br />
1. After miner loads ram car with loose material, the continuous miner operator will<br />
back the miner to the location where rock props [sic] need to be set. The exact<br />
location will be determined by the length <strong>of</strong> the hose needed to set the pressure on<br />
the rock prop.<br />
2. Immediately after the ram car is 25 feet outby the location <strong>of</strong> the 6 men <strong>and</strong> heading<br />
to the feeder, up to 6 men who are in the closest x-cut to the end <strong>of</strong> the prop line that<br />
provides a minimum <strong>of</strong> 5 feet <strong>of</strong> clearance behind the rock props will begin setting<br />
support.<br />
3. The support setters shall wear reflective vests so they can be easily seen by any<br />
approaching individual. Reflective vests are on order.<br />
4. A miner will be stationed at least 100 feet, but not more than 200 feet outby the<br />
support setters to be assigned to signal any approaching piece <strong>of</strong> equipment that the<br />
support setters are in the entry. If the designated signal person sees the rock prop<br />
setters in the entry, he will stop the approaching equipment at least 100 feet short <strong>of</strong><br />
the support setters.<br />
5. As the ram car approaches the continuous miner, the support setters will move back<br />
into the x-cut.<br />
6. This process will apply for any work associated with rock props, any square sets,<br />
j-bar, chain link fence, ventilation controls or wire rope or any support work.<br />
7. Ram cars loaded with rock props [sic] or any other ro<strong>of</strong> support material will not<br />
return to the outby area from the continuous miner without a load <strong>of</strong> coal.<br />
8. If a ram car is taking material to the continuous miner, the car should be loaded<br />
while another car is at the miner. The car should be staged in number one entry just<br />
out-by the x-cut 120.<br />
Item 1 refers to the continuous mining machine being used as the hydraulic power source for the<br />
water pump for installing the RocProps. However, a scoop or ro<strong>of</strong> bolting machine also was<br />
used as a power source for the RocProp water pump. Items 3, 4, <strong>and</strong> 5 were procedures to cope<br />
with the close clearance between the mobile equipment <strong>and</strong> the installed RocProps.<br />
At approximately 6:30 p.m. on August 13, <strong>MSHA</strong> mine rescue personnel using breathing<br />
apparatuses installed 3/8-inch plastic tubing to the Main West seals. This allowed air samples to<br />
be taken remotely in fresh air at crosscut 120 near the feeder. Clean-up in the No. 1 entry had<br />
advanced to the vicinity <strong>of</strong> crosscut 125 at the time the air sample tubes were installed.<br />
On August 14, a slight widening <strong>of</strong> ro<strong>of</strong> joints was observed outby the FAB in the No. 1 entry<br />
between crosscuts 115 <strong>and</strong> 117. RocProps were installed along the pillar ribs through this area to<br />
reinforce the ro<strong>of</strong> in the entry. Clean-up in the No. 1 entry had advanced to midway between<br />
crosscuts 125 <strong>and</strong> 126.<br />
On August 15 at 2:26 a.m., a burst initiated from the right pillar rib in the clean-up area <strong>of</strong> the<br />
No. 1 entry inby the RocProps where the continuous mining machine was working. The burst<br />
threw coal across the mining machine <strong>and</strong> registered as a 1.2 magnitude seismic event. The<br />
machine was working 107 feet inby crosscut 125. It was reported as a significant event with<br />
ventilation controls damaged at crosscut 125. No injuries occurred; however, the mining<br />
25
machine cutter motors required repair work as a result <strong>of</strong> the burst. By 4:00 a.m. the mining<br />
machine was repaired <strong>and</strong> clean-up work resumed in the No. 1 entry. Later that day, reports <strong>of</strong><br />
rock noise emanating from locations outby crosscut 119 prompted <strong>MSHA</strong> to install convergence<br />
monitoring stations. Ten ro<strong>of</strong>-to-floor convergence stations were installed at crosscuts 111, 113,<br />
115, 117, <strong>and</strong> 119 in the No. 2 <strong>and</strong> No. 4 entries <strong>and</strong> sixteen monitoring locations were<br />
established on RocProps inby crosscut 116 in the No. 1 entry.<br />
August 16 Accident Description<br />
On the morning <strong>of</strong> August 16, 2007, the No. 1 entry <strong>of</strong> the South Barrier section had been<br />
cleared to just inby crosscut 126. At 6:25 a.m., Br<strong>and</strong>on Kimber (foreman), Dale Black<br />
(foreman), Lester Day (continuous mining machine helper), Phil Gordon (Ramcar operator), <strong>and</strong><br />
Steve Wilson (Ramcar operator) were the first five miners on the day shift crew to arrive on the<br />
section. They were joined by Casey Metcalf (support crew) at 6:51 a.m. <strong>and</strong> R<strong>and</strong>y Bouldin<br />
(Ramcar operator), Carl Gressman (support crew), Mitch Horton (support crew), <strong>and</strong> Br<strong>and</strong>y<br />
Fillingim (outby man) at 7:16 a.m. <strong>MSHA</strong> coal mine inspectors, Donald Durrant, Peter Saint,<br />
<strong>and</strong> Rodney Adamson arrived on the section approximately 15 minutes later. Durrant monitored<br />
activities in the clean-up area, Saint manned the FAB at crosscut 119, <strong>and</strong> Adamson monitored<br />
air quantity <strong>and</strong> quality outby.<br />
Two <strong>MSHA</strong> supervisory mining engineers, Joseph Cybulski <strong>and</strong> Joseph Zelanko, from the<br />
Pittsburgh <strong>Safety</strong> <strong>and</strong> <strong>Health</strong> Technology Center’s Ro<strong>of</strong> Control Division (RCD) accompanied<br />
Durrant, Saint, <strong>and</strong> Adamson to the section that morning. The purpose <strong>of</strong> their visit was to<br />
evaluate ground conditions in the work area <strong>and</strong> to measure the convergence stations they had<br />
installed on August 15. Cybulski <strong>and</strong> Zelanko observed conditions between crosscuts 111 <strong>and</strong><br />
120 in the Nos. 2 <strong>and</strong> 4 entries <strong>and</strong> between crosscut 111 <strong>and</strong> the clean-up face in No. 1 entry.<br />
None <strong>of</strong> the stations displayed any significant convergence <strong>and</strong> ground conditions had not<br />
changed. They left the section <strong>and</strong> arrived outside at 10:10 a.m.<br />
The day shift crew began the shift by installing ro<strong>of</strong> supports in the clean-up area <strong>of</strong> the No. 1<br />
entry. The ro<strong>of</strong> bolting machine hydraulics powered the water pump that was used to pressurize<br />
the RocProps. The continuous mining machine was trammed inby <strong>and</strong> the clean-up <strong>and</strong> support<br />
cycle continued in the No. 1 entry.<br />
The rescue efforts were interrupted at 10:04 a.m. when a burst occurred in the coal pillar between<br />
the No. 1 <strong>and</strong> No. 2 entries. The burst, which registered as a magnitude 1.5 seismic event,<br />
displaced approximately 4 feet <strong>of</strong> the pillar rib inby the RocProps, filling the entry on the right<br />
side <strong>of</strong> the continuous mining machine to a depth <strong>of</strong> approximately 2.5 feet. No injuries were<br />
sustained <strong>and</strong> no RocProps were dislodged by burst coal. The crew backed the continuous<br />
mining machine outby, cleared the debris, <strong>and</strong> continued the clean-up cycle.<br />
At 1:16 p.m., the crew was joined by Jeff Tripp, a supervisor from the Century <strong>Mine</strong> in Ohio,<br />
operated by American Energy Corporation, a subsidiary <strong>of</strong> Murray Energy Corporation. This<br />
was Tripp’s first day working at the Cr<strong>and</strong>all Canyon <strong>Mine</strong>.<br />
At 1:30 p.m., Cybulski <strong>and</strong> Zelanko returned to the section to take a second set <strong>of</strong> measurements<br />
at the convergence stations. The measurements were being taken to establish the historical trend<br />
<strong>and</strong> baseline for the convergence data. Again, measurements <strong>and</strong> observations were made in the<br />
Nos. 1, 2, <strong>and</strong> 4 entries. No significant changes were noted.<br />
26
At 2:58 p.m., <strong>MSHA</strong> coal mine inspectors, Gary Jensen, Frank Markosek, <strong>and</strong> Scott Johnson<br />
arrived at the clean-up area to relieve Durrant, Saint, <strong>and</strong> Adamson for their 8-hour regular shift<br />
rotation. Jensen <strong>and</strong> Johnson were members <strong>of</strong> <strong>MSHA</strong>’s MEU. Cybulski <strong>and</strong> Zelanko returned<br />
to the surface with Durrant, Saint, <strong>and</strong> Adamson.<br />
By the end <strong>of</strong> day shift, the crew had advanced the clean-up efforts in the No. 1 entry close to<br />
crosscut 127. After the last Ramcar was loaded, Jensen informed the crew that they needed to<br />
set RocProps. Jensen also recommended that steel channels be installed across the last two rows<br />
<strong>of</strong> RocProps. As Wilson drove the loaded Ramcar to the feeder, crew members entered the<br />
clean-up area to install supports. Gordon unloaded his Ramcar at the feeder, changed out with<br />
Wilson, <strong>and</strong> parked in crosscut 125. Bouldin parked his Ramcar near crosscut 126 <strong>and</strong> walked to<br />
the clean-up area to help install ground supports. Br<strong>and</strong>y Fillingim, who had been working<br />
outby, came to the clean-up area at the end <strong>of</strong> the shift <strong>and</strong> assisted the crew. Fillingim, Bouldin,<br />
<strong>and</strong> Horton installed RocProps <strong>and</strong> steel channels on the right side <strong>of</strong> the entry, while Black,<br />
Day, <strong>and</strong> Kimber set them on the left side. Gressman was operating the control valve on the<br />
pump used to pressurize the RocProps. Metcalf <strong>and</strong> Tripp were tightening the steel cables on the<br />
left side. Jensen <strong>and</strong> Markosek were near the tail <strong>of</strong> the continuous mining machine, monitoring<br />
the activities. Johnson was outby the clean-up area, taking air measurements at the Panel 13 seal<br />
at crosscut 107.<br />
At 6:38 p.m., as the crew completed installing ground support in the clean-up area, the coal pillar<br />
between the No. 1 <strong>and</strong> No. 2 entries burst. Coal was thrown violently across the No. 1 entry<br />
during the magnitude 1.9 seismic event. The burst created a void up to 20 feet deep into the<br />
pillar at the ro<strong>of</strong> line (see Figure 12 <strong>and</strong> Figure 13, view indicated by arrow). The dislodged coal<br />
threw eight RocProps, steel cables, chain-link fence, <strong>and</strong> a steel channel toward the left side <strong>of</strong><br />
the entry, striking the rescue workers <strong>and</strong> filling the entry with approximately four feet <strong>of</strong> debris<br />
(see Figure 14). Heavy dust filled the clean-up area, reduced visibility, <strong>and</strong> impaired breathing.<br />
Oxygen deficient air from the inby area migrated over the miners. The dust <strong>and</strong> oxygen<br />
deficiency were slow to clear due to damaged ventilation controls.<br />
Figure 12 – Damage to Outby Portion <strong>of</strong> Pillar on Right Side <strong>of</strong> No. 1 Entry (Outby August 16 Accident Site)<br />
27
Figure 13 - 20-foot Deep Void over Pillar on Right Side <strong>of</strong> No. 1 Entry following August 16 Accident<br />
Figure 14 - August 16, 2007, Coal Burst Effects <strong>and</strong> Location <strong>of</strong> Injured <strong>Mine</strong>rs<br />
Bouldin, Horton, <strong>and</strong> Fillingim had just walked out <strong>of</strong> the clean-up area when the burst occurred<br />
behind them. Bouldin was knocked down by the thrown material <strong>and</strong> injured his back. He was<br />
able to st<strong>and</strong>, but had difficulty seeing <strong>and</strong> breathing in the heavy dust. Fillingim <strong>and</strong> Horton<br />
were not injured. Fillingim was near the edge <strong>of</strong> the dust cloud <strong>and</strong> continued out <strong>of</strong> the cleanup<br />
area, unaware <strong>of</strong> the severity <strong>of</strong> the accident. Bouldin <strong>and</strong> Horton were disoriented in the dust<br />
<strong>and</strong> could hear injured miners shouting for help. Bouldin told Horton to go to the phone <strong>and</strong> get<br />
help. Bouldin returned inby to assist the injured miners.<br />
28
<strong>MSHA</strong> coal mine inspector Scott Johnson heard the burst from crosscut 110 while walking<br />
toward the clean-up area. Protocol for the rescue efforts established that communication<br />
between the clean-up crew <strong>and</strong> outby workers would occur following a bounce or burst. When<br />
miners working near crosscut 113 informed Johnson that they had not heard from the clean-up<br />
area, he hurried to the fresh air base phone at crosscut 119.<br />
Gordon had just gotten out <strong>of</strong> his Ramcar <strong>and</strong> was st<strong>and</strong>ing near a pager phone in crosscut 125<br />
when the burst occurred, knocking out the stopping next to him. He looked toward the clean-up<br />
area <strong>and</strong> observed Fillingim walking out <strong>of</strong> a large cloud <strong>of</strong> dust. Wilson, located at the feeder,<br />
felt a bounce <strong>and</strong> paged the crew. As Gordon answered Wilson’s page, Horton ran out <strong>of</strong> the<br />
clean-up area <strong>and</strong> told Gordon that the crew was covered up. Wilson asked † , “Everything...Is<br />
everybody all right in the face, Phil” Gordon replied, “Hey, we need some help in here, now.”<br />
“Okay, what do you need” asked Wilson. Gordon answered, “Get some vehicles up here.”<br />
Wilson replied, “Vehicles, right now.” Gordon continued, “Hey, get some help up here <strong>and</strong> get<br />
some people.”<br />
As Bouldin reentered the clean-up area, he could hear Day’s muffled voice calling for help.<br />
Bouldin asked Day where he was. Day replied that Bouldin was st<strong>and</strong>ing on him. Bouldin<br />
looked down <strong>and</strong> saw part <strong>of</strong> Day's shoulder exposed through the rubble <strong>and</strong> his head buried<br />
beneath large pieces <strong>of</strong> coal. Bouldin uncovered Day <strong>and</strong> helped him to his feet before leaving<br />
the clean-up area to catch his breath. Day attempted to help the other injured miners even though<br />
he felt blood running down over his shoulders <strong>and</strong> realized that his head had been injured. Day<br />
found Tripp buried in coal from the waist down <strong>and</strong> told him that he was going to get help. After<br />
catching his breath, Bouldin resumed his attempts to dig out the injured miners who were<br />
partially covered by debris from the burst.<br />
Gordon told Fillingim to call outside <strong>and</strong> get help. He then entered the clean-up area to assess<br />
the condition <strong>of</strong> the injured rescue workers. Fillingim <strong>and</strong> Horton called the AMS operator,<br />
requesting “We need help in here now, in the face. We need everybody you can get in here<br />
now…We need stretchers, we need bridles, we need everything...Hurry!” Gordon found Jensen<br />
partially covered in coal, but responsive. Metcalf was conscious <strong>and</strong> lying against the left rib<br />
entangled in chain-link fencing. Black was covered in material up to his waist. Markosek <strong>and</strong><br />
Gressman were severely injured, but alert. Kimber was located farther inby. Gordon checked<br />
Black <strong>and</strong> Kimber for vital signs, but none were detected.<br />
<strong>MSHA</strong> personnel stationed in the mobile comm<strong>and</strong> center vehicle were Bob Cornett (assistant<br />
district manager), Danny Frey (<strong>MSHA</strong> supervisory coal mine inspector), <strong>and</strong> Dewayne Brown<br />
(<strong>MSHA</strong> coal mine inspector trainee). Brown was manning the pager phone <strong>and</strong> maintaining the<br />
comm<strong>and</strong> center log. Brown reported the call for help to Cornett, who assigned Frey <strong>and</strong> Brown<br />
to remain in the vehicle to monitor communications <strong>and</strong> maintain the log. Cornett also assigned<br />
C.W. Moore (<strong>MSHA</strong> mining engineer) to the Emergency Medical Services (EMS) staging area<br />
to get the names <strong>and</strong> condition <strong>of</strong> everybody that they brought out, which he was to report to<br />
Frey. Cornett then joined Adair in the comm<strong>and</strong> center.<br />
† Audio files <strong>of</strong> actual voice communications via the pager phone system were digitally recorded on August 16,<br />
2007. Quoted conversations <strong>of</strong> pager phone communications were obtained from these recordings for this report.<br />
29
The night shift crew members were traveling toward the clean-up area when the accident<br />
occurred. Benny Allred, Chris Armstrong, Ronnie Gutierrez, Richard Hansen, Natalio Lema,<br />
Ignazio Manzo, Dallen McFarlane, <strong>and</strong> Juan Zarate were walking toward the loading point when<br />
they heard the burst <strong>and</strong> realized that airflow had been disrupted. Gale Anderson, Dave Blake,<br />
Jeff Beckett, Keith Norris, <strong>and</strong> Jason Bell arrived at the fresh air base just behind Allred’s group.<br />
Anderson told Benny Allred’s group to install curtains from the loading point at crosscut 120 to<br />
the accident area. Anderson <strong>and</strong> the remaining night shift crew members continued inby to the<br />
accident site <strong>and</strong> began helping the injured miners. Tim Harper, Ryan Mann, <strong>and</strong> Jameson Ward<br />
were waiting by the phone at crosscut 89 when they overheard Fillingim’s call to the AMS<br />
operator. Harper asked the AMS operator, “What's going on” AMS replied, “I don't know, he<br />
just told me we need everything in the face.” Harper told the AMS operator that they were at<br />
crosscut 89 <strong>and</strong> they were going to the face.<br />
Johnson arrived at the fresh air base <strong>and</strong> instructed miners to get the six stretchers stored there<br />
ready. He also told the miners to load the stretchers into a truck <strong>and</strong> transport them to the cleanup<br />
area. Johnson then ran to the accident site.<br />
<strong>Mine</strong> management had just finished a meeting to discuss progress <strong>and</strong> work plans for continued<br />
rescue work in the No. 1 entry. Bodee Allred, Adair, Peacock, <strong>and</strong> several other managers exited<br />
the meeting into the hallway near the AMS room. Allred overheard the AMS operator talking to<br />
Harper. Allred picked up a phone in his <strong>of</strong>fice, which was located adjacent to the AMS room,<br />
<strong>and</strong> called the fresh air base. Mike Elwood answered the phone at crosscut 123 <strong>and</strong> Bodee<br />
Allred asked, “Hey, what's going on in there” Elwood replied, “We had a bump. I don't know<br />
exactly what went on...we called up to see how everybody was doing, they called for trucks...so<br />
we're going, we are on our way up to the face, now, to see what's happening.” Allred asked if<br />
they needed EMS. Elwood replied: “I would, just to be on the safe side. I don't know what we<br />
got.” During this conversation, Bodee Allred motioned for Adair <strong>and</strong> informed him <strong>of</strong> the<br />
accident. Adair immediately turned to Peacock <strong>and</strong> a few other managers <strong>and</strong> told them that<br />
they had a big bounce <strong>and</strong> to get in the mine. Allred h<strong>and</strong>ed the phone to Adair <strong>and</strong> left the<br />
<strong>of</strong>fice to go underground.<br />
As Elwood briefed Adair, Bouldin was having difficulty breathing <strong>and</strong> went to the phone at<br />
crosscut 125 to call for brattice. Bouldin interrupted, “Can anybody outby bring some rag<br />
Bring some brattice!” Adair announced, “They want brattice <strong>and</strong> rag, take it in there…get<br />
moving, anybody outby in the mine, head toward the face.” Bouldin left the phone <strong>and</strong> returned<br />
to the accident site where he was joined by night shift crew members, who began digging out the<br />
injured miners <strong>and</strong> providing first aid treatment.<br />
At 6:45 p.m., Adair attempted to resume contact with the accident site as Jeff Palmer <strong>and</strong> Bodee<br />
Allred drove quickly up the portal road to enter the mine. They slowed down to speak to a<br />
person at the portal before continuing into the mine, just as communication with the accident site<br />
resumed. “You guys okay up there” someone asked. “No, there's a bad accident, about eight<br />
people…” The person at the portal called the AMS operator <strong>and</strong> reported, “I got Jeff <strong>and</strong> Bodee<br />
heading into the face,” talking over the miner still speaking from accident site. The miner at the<br />
accident site continued, “…we need lots <strong>of</strong> shovels, <strong>and</strong> pick, we need bridles…to hook on the<br />
miner…we can't get them unburied.” “Okay, we'll bring all we got, bud.” “All right, try, hurry<br />
fast.” Some <strong>of</strong> the information from the miner at the accident site was inaudible due to the<br />
interruption for post accident tracking <strong>of</strong> personnel movements through the mine. Adair ordered<br />
over the pager phone system, “This is Laine Adair. I want everybody <strong>of</strong>f this line that's not<br />
necessary.”<br />
30
At 6:48 p.m., Adair paged the accident site. Gordon finished assessing the miners’ injuries <strong>and</strong><br />
answered the phone, “Hey this is Phil, we're on the face. Who have I got” Adair replied, “This<br />
is Laine, what do you need, buddy” Palmer <strong>and</strong> Bodee Allred interrupted to report that they<br />
were entering Zone 2 (see Appendix C). Gordon requested, “Everybody <strong>of</strong>f the phone but<br />
Laine.” Adair again ordered everybody <strong>of</strong>f the phone. Gordon, speaking short <strong>of</strong> breath,<br />
continued, “I think there's five or six…Dale Black <strong>and</strong> Br<strong>and</strong>on Kimber, is all that I can tell<br />
right now, are fatalities…We got to have air, from the tail piece in, because we have no air up in<br />
there, okay” Gordon also requested first aid supplies <strong>and</strong> a medical team.<br />
Johnson entered the clean-up area <strong>and</strong> detected 16% oxygen. Dust suspended in the air still<br />
limited visibility to approximately 20 feet. He informed the workers recovering the injured<br />
miners <strong>of</strong> the low oxygen but they did not want to leave the area. Johnson returned outby to<br />
crosscut 125 <strong>and</strong> instructed miners arriving at the accident site to install brattice in the clean-up<br />
area. Johnson paged the comm<strong>and</strong> center <strong>and</strong> reported, “They’re running short on air.” Adair<br />
replied, “Start pushing that air in from the belt line. Check every crosscut. Start taking rag <strong>and</strong><br />
get that air pushed in.” Johnson returned to the clean-up area as Benny Allred <strong>and</strong> his crew<br />
continued repairs to the ventilation system.<br />
As Harper, Mann, <strong>and</strong> Ward traveled toward the accident site, they were stopped by Gutierrez.<br />
Gutierrez informed them they needed brattice because the bounce had blown out stoppings.<br />
They loaded the material Gutierrez had gathered into Harper’s truck <strong>and</strong> traveled inby. Harper<br />
assisted in reestablishing ventilation while Mann <strong>and</strong> Ward continued inby. They met Day<br />
walking out <strong>of</strong> the clean-up area. Mann had a first-aid trauma kit <strong>and</strong> b<strong>and</strong>aged Day’s head<br />
wounds.<br />
At 6:51 p.m., Peacock, Robert E. Murray, <strong>and</strong> Jerry Taylor (corporate safety director) entered the<br />
mine, followed by several miners in a pick-up truck loaded with stretchers <strong>and</strong> supplies. Also,<br />
an Emery County Sheriff’s Officer radioed his <strong>of</strong>fice <strong>and</strong> requested that Huntington EMTs be<br />
paged out to respond to the mine. Four ambulances, in addition to the one already stationed at<br />
the mine, were dispatched. Three emergency medical transport helicopters were also dispatched<br />
to the mine. Ambulances were staged at the entrance to the portal access road, near the <strong>MSHA</strong><br />
mobile comm<strong>and</strong> center vehicle.<br />
At 6:52 p.m., Elwood informed Adair that a temporary stopping had been built in crosscut 125,<br />
<strong>and</strong> airflow to the clean-up area was re-established. Adair expressed a concern for low oxygen<br />
coming into the rescue area. He told Elwood to get some detectors in the clean-up area <strong>and</strong><br />
monitor for low oxygen. Johnson also briefed the comm<strong>and</strong> center at 6:54 p.m.<br />
Harper rejoined Mann <strong>and</strong> Ward. Harper helped Day get a ride outside while Mann <strong>and</strong> Ward<br />
continued inby to assist other victims. As the miners were working to free the injured miners,<br />
several factors were slowing their efforts. Not only were rescuers dealing with the quantity <strong>of</strong><br />
burst material, the ro<strong>of</strong> <strong>and</strong> rib support that had been installed to protect the workers was now<br />
part <strong>of</strong> the rubble. The electrical cable <strong>and</strong> water line used to operate the continuous mining<br />
machine, along with the line curtain used for ventilation <strong>of</strong> the clean-up area, were also hindering<br />
the recovery <strong>of</strong> the injured miners (refer to Figure 15).<br />
31
Figure 15 – Clean-up Area Following the Fatal August 16, 2007, Accident<br />
The direction <strong>and</strong> location <strong>of</strong> camera view is denoted by black arrow in the insert.<br />
At 6:59 p.m., Bodee Allred arrived at the accident site, where he met rescuers carrying Br<strong>and</strong>on<br />
Kimber to a pick-up truck. Allred helped place Kimber in the truck <strong>and</strong> started performing<br />
cardiopulmonary resuscitation (CPR). Allred continued CPR until reaching the surface at<br />
7:14 p.m. EMT personnel provided medical attention <strong>and</strong> continued CPR while in route to<br />
Castleview Hospital in Price, Utah.<br />
Day arrived at the surface at 7:18 p.m. <strong>and</strong> was taken to an ambulance where he was assisted by<br />
Bodee Allred <strong>and</strong> attended to by EMT personnel. Markosek was brought out <strong>of</strong> the mine at<br />
7:27 p.m. <strong>and</strong> placed in the ambulance with Day, which transported them to Castleview Hospital.<br />
Markosek was later airlifted to Utah Valley Regional Medical Center in Provo, Utah. Tripp was<br />
brought out <strong>of</strong> the mine at 7:33 p.m. <strong>and</strong> transported by ambulance to Castleview Hospital.<br />
Gary Jensen was brought out <strong>of</strong> the mine at 7:40 p.m. <strong>and</strong> airlifted to Utah Valley Regional<br />
Medical Center.<br />
At 8:11 p.m., the last victim, Dale Black, was removed from the accident site. Metcalf <strong>and</strong><br />
Bouldin exited the mine at 8:13 p.m. <strong>and</strong> were transported by ambulance to Castleview Hospital.<br />
Gressman arrived on the surface at 8:19 p.m. <strong>and</strong> was airlifted to University Hospital in Salt<br />
Lake City, Utah. Black was brought out <strong>of</strong> the mine at 8:30 p.m.<br />
At 9:17 p.m. the last group <strong>of</strong> the rescue workers exited the mine. Due to the large number <strong>of</strong><br />
people assisting in the rescue efforts, it took several minutes <strong>and</strong> a thorough head count to ensure<br />
that everyone was out <strong>of</strong> the mine. To facilitate this effort, as workers exited the mine they were<br />
directed to the shop area. Once everyone was in the shop area, <strong>MSHA</strong> <strong>and</strong> the mine operator<br />
conducted a debriefing to verify who was in the mine at the time <strong>of</strong> the accident <strong>and</strong> to gather<br />
specific information about the accident. At 9:55 p.m., mine management verified that everyone<br />
32
was out <strong>of</strong> the mine. At 11:35 p.m., <strong>MSHA</strong> modified the 103(k) order <strong>and</strong> prohibited anyone<br />
from traveling inby Main West crosscut 107.<br />
The August 16, 2007, accident resulted in fatal injuries to rescue workers Dale Black <strong>and</strong><br />
Br<strong>and</strong>on Kimber <strong>and</strong> <strong>MSHA</strong> coal mine inspector Gary Jensen. R<strong>and</strong>y Bouldin, Lester Day, Carl<br />
Gressman, Casey Metcalf, Jeff Tripp, <strong>and</strong> <strong>MSHA</strong> coal mine inspector Frank Markosek suffered<br />
severe injuries.<br />
Following the August 16 accident, a panel <strong>of</strong> independent ground control experts was convened<br />
at the mine site to reevaluate the rescue effort. Although underground rescue efforts were<br />
suspended until the conditions were reevaluated, efforts to locate the miners from the surface<br />
continued.<br />
Surface Rescue Efforts<br />
Attempt to Locate <strong>Mine</strong>rs - Boreholes<br />
Seven boreholes were drilled from the surface to the mine workings to locate the entrapped<br />
miners <strong>and</strong> assess conditions in the affected area. <strong>Mine</strong> coordinates for each borehole were<br />
determined from the mine map. These mine coordinates were then transferred <strong>and</strong> translated as<br />
surface coordinates <strong>and</strong> located on the surface using global positioning satellite surveying. If<br />
miners were located after a borehole intersected the mine, the hole could be used to communicate<br />
<strong>and</strong> provide fresh air <strong>and</strong> sustenance until they were rescued. The first three boreholes were<br />
drilled as the underground rescue efforts were ongoing. The next four boreholes were completed<br />
after the accident on August 16, 2007.<br />
The mine operator contracted the services <strong>of</strong> two companies to drill the boreholes into the mine.<br />
A road, 1.7 miles in length, <strong>and</strong> a drill pad were constructed with bulldozers while the drill rigs<br />
were being transported to the mine. These roads <strong>and</strong> drill pads were constructed in mountainous<br />
terrain (see Figure 16). Surface locations for the boreholes were surveyed by a contractor for the<br />
mine operator. The first borehole was started on August 7, 2007, at 7:30 p.m. <strong>and</strong> the last<br />
borehole was completed at 4:30 a.m., August 30, 2007.<br />
Figure 16 - Mountainous Terrain where Roads <strong>and</strong> Drill Pads were Constructed<br />
33
Borehole No. 1 was drilled using a small rotary core drill fitted with a full hole, polycrystalline<br />
diamond bit. This drill rig was transported by helicopter from another mine to the drill pad for<br />
Borehole No. 1 at 4:30 p.m. on August 7, 2007 (see Figure 17). The diameter <strong>of</strong> Borehole No. 1<br />
was approximately 3 inches for the first 450 feet <strong>and</strong> 2.4 inches from 450 feet to its full depth <strong>of</strong><br />
1,871 feet. This drill did not have any directional control capability.<br />
Figure 17 - Heliportable Drill Rig<br />
The other six boreholes (Nos. 2–7) were drilled with a larger drill rig that was driven to each drill<br />
pad location (see Figure 18). This drill rig arrived at the site at approximately 3:00 a.m. on<br />
August 8, 2007, <strong>and</strong> started drilling Borehole No. 2 at approximately 1:20 p.m. that day. The<br />
first 20 feet <strong>of</strong> all six boreholes were drilled 14.75-inch in diameter with a hammer bit <strong>and</strong> cased<br />
with 10.75-inch steel pipe. The remaining lengths <strong>of</strong> the boreholes were drilled 8.75-inch in<br />
diameter with a tri-cone bit. Borehole No. 2 was cased from 20 feet down to the top <strong>of</strong> the coal<br />
seam with 7.0-inch outside diameter by 6.375-inch inside diameter steel pipe. Boreholes<br />
Nos. 3-7 were uncased beyond 20 feet in depth. The larger drill rig utilized directional control<br />
<strong>and</strong> boreholes intersected the mine within a few feet <strong>of</strong> their intended locations. Figure 19<br />
illustrates the locations <strong>of</strong> these boreholes relative to the mine workings. Figure 20 illustrates the<br />
location <strong>of</strong> these boreholes on the surface. Table 2 summarizes the borehole parameters <strong>and</strong><br />
locations.<br />
34
Figure 18 - Drill Rig at Borehole No. 4<br />
Figure 19 - Borehole Locations Intersecting Underground Workings<br />
35
Figure 20 - Surface Location <strong>of</strong> Boreholes<br />
Table 2 - Summary <strong>of</strong> Borehole Size, Depth, Drill Rate, Location, Voids, <strong>and</strong> O 2 Concentration<br />
Borehole<br />
No.<br />
Dia.<br />
(In)<br />
Depth<br />
to <strong>Mine</strong><br />
(Ft)<br />
Drill<br />
Time<br />
(Hrs)<br />
Drill<br />
Rate<br />
(Ft/Hr)<br />
<strong>Mine</strong><br />
Intersection<br />
Time/Date<br />
1 2.4 1871 50.5 37.0<br />
9:58 pm<br />
Aug 9<br />
12:57 am<br />
2* 8.75 1886 59.6 31.6 Aug 11<br />
10:11 am<br />
3* 8.75 1414 36.0 39.3 Aug 15<br />
9:16 am<br />
4*# 8.75 1587 41.5 38.2 Aug 18<br />
8:30 am<br />
5 8.75 2039 58.3 35.0 Aug 22<br />
4:02 pm<br />
6 8.75 1783 48.0 37.1 Aug 25<br />
4:15 am<br />
7 8.75 1865 48.3 38.6 Aug 30<br />
* Air was injected into these boreholes with a compressor<br />
# Robot was lowered into mine through this borehole<br />
Note: Borehole Depth to <strong>Mine</strong> = Depth reported to BLM by GRI<br />
36<br />
<strong>Mine</strong><br />
Intersection<br />
Location<br />
Void<br />
(Ft)<br />
Crosscut 138,<br />
Entry 2 5.5<br />
Crosscut 137,<br />
Entry 2 5.7<br />
Crosscut 147,<br />
Entry 4 8.0<br />
Crosscut 142,<br />
Entry 4 4.0<br />
Crosscut 133,<br />
Entry 1 0.5<br />
Crosscut 138.5,<br />
Entry 1 0.0<br />
Crosscut 137.5,<br />
Entry 3 2.7<br />
Initial O 2<br />
Date<br />
8.17%<br />
August 10<br />
Borehole used<br />
for air injection<br />
16.88%<br />
August 16<br />
11.97%<br />
August 18<br />
Borehole<br />
blocked<br />
Borehole<br />
blocked<br />
Borehole<br />
blocked
When a borehole intersected the mine opening, attempts were made to contact the entrapped<br />
miners by striking the drill steel. <strong>MSHA</strong> <strong>and</strong> company personnel would listen for a response by<br />
placing a microphone or a person’s ear against the drill steel. <strong>MSHA</strong>’s seismic location system<br />
was also monitored. The drill steel was then lowered into the mine opening in two-foot<br />
increments with pounding <strong>and</strong> listening taking place at each increment for about ten minutes.<br />
This procedure would continue until the drill steel met solid resistance. There were no responses<br />
to these activities at any <strong>of</strong> the boreholes.<br />
The drill operators were able to determine when the boreholes intersected the mine opening by<br />
observation <strong>of</strong> the hydraulic weight indicator gauge. The value on this gauge increased abruptly<br />
when the mine opening was intersected. The mine void distance was determined for each<br />
borehole by measuring the distance that the drill steel was lowered, after it intersected the mine<br />
opening, until it met solid resistance.<br />
Air quality was measured in Borehole No. 1 by drawing an air sample from the drill steel. The<br />
air quality was determined in Borehole Nos. 2–7 when the holes were exhausting by collecting<br />
air samples near the collar <strong>of</strong> the hole. The results <strong>of</strong> air sample analyses from the boreholes are<br />
shown in Table 3.<br />
A microphone <strong>and</strong> camera were lowered into the 8.75-inch boreholes. The camera was equipped<br />
with lights <strong>and</strong> could be rotated 360 degrees. Once evaluations at Borehole No. 2 were<br />
completed, a compressor was used to pump fresh air into the mine. The process was repeated at<br />
Borehole Nos. 3 <strong>and</strong> 4.<br />
Description <strong>of</strong> Boreholes<br />
Borehole No. 1 was started at 7:30 p.m. on August 7, 2007, while preparations were underway to<br />
begin the underground rescue in No. 1 entry. The underground rescue efforts had advanced to<br />
just inby crosscut 122 in the No. 1 entry when this borehole intersected the mine at 9:58 p.m. on<br />
August 9. The mine void was 5.5 feet high at this location. A camera was not lowered into this<br />
borehole because <strong>of</strong> the small diameter. The initial air samples collected at this hole, at<br />
12:00 a.m. on August 10, 2007, contained 20.73% oxygen. However, it was discovered that the<br />
holes in the bit were clogged <strong>and</strong> that this initial sample did not represent the air quality in the<br />
mine. After the bit was flushed with water, another air sample taken at 1:45 a.m. on August 10<br />
contained 8.17% oxygen. Since the penetration location was not known at that time, it could not<br />
be determined whether the low oxygen concentration was associated with the South Barrier<br />
section or a sealed area <strong>of</strong> the mine. Therefore, a borehole survey was conducted on August 10.<br />
The survey determined that the borehole had intersected the mine level at crosscut 138 in the<br />
No. 2 entry 85 feet south <strong>of</strong> its intended location. The large deviation was due to the lack <strong>of</strong><br />
directional control with this rig <strong>and</strong> it was only by chance that the hole intersected the mine<br />
opening.<br />
The location for Borehole No. 2 was in the belt entry in the intersection outby the section feeder.<br />
Drilling <strong>of</strong> this borehole started at 1:20 p.m. on August 8, 2007. The borehole intersected the<br />
mine at crosscut 137 in the No. 2 entry at 12:57 a.m. on August 11, 2007. This was the projected<br />
mine location for this borehole. The underground rescue efforts had advanced to between<br />
crosscuts 123 <strong>and</strong> 124 in the No. 1 entry when this borehole intersected the mine. The mine void<br />
was 5.7 feet at this location. A camera that was lowered into this borehole revealed that the<br />
intersection was mostly open but the entries <strong>and</strong> crosscuts leading into the intersection were<br />
almost completely filled with rubble. The belt was embedded in rubble inby <strong>and</strong> outby the<br />
intersection.<br />
37
Table 3 - Analysis Results <strong>of</strong> Air Samples Taken at Boreholes<br />
38
On August 11, 2007, <strong>MSHA</strong>’s rescue capsule arrived on mine property from Beckley, West<br />
Virginia. The 92-inch high by 21.5-inch diameter, one-man rescue capsule required a larger rig<br />
to drill a minimum 30-inch diameter hole into the mine opening to provide clearance for the<br />
capsule. The rescue capsule was available for use should signs <strong>of</strong> life be detected during rescue<br />
efforts.<br />
The location chosen for Borehole No. 3 was in the bleeder entry <strong>of</strong> the South Barrier section.<br />
Drilling <strong>of</strong> this borehole started at 10:12 p.m. on August 13, 2007. The borehole intersected the<br />
mine at crosscut 147 in the No. 4 entry at 10:11 a.m. on August 15, 2007. This was the projected<br />
mine location for this borehole. The underground rescue efforts had advanced to 120 feet inby<br />
crosscut 125 in the No. 1 entry when this borehole intersected the mine. The mine void was the<br />
full entry height or approximately 8 feet at this location. After penetrating the mine, the drill<br />
steel was struck three times with a hammer. A signal, repeating at 1 to 2 second intervals, was<br />
detected by the <strong>MSHA</strong> seismic location system. These signals were received at only one subarray<br />
location (sub-array four). Dr. Jeffrey Kravitz (<strong>MSHA</strong> chief <strong>of</strong> scientific development),<br />
reviewed the record <strong>and</strong> determined that the signals were too strong for that expected from an<br />
entrapped miner. These signal recordings prompted the decision to move the proposed location<br />
<strong>of</strong> Borehole No. 4 to a location near the sub-array where the signal was received to determine if<br />
the entrapped miners might be in that vicinity.<br />
Underground rescue efforts were suspended indefinitely after the accident on August 16, 2007.<br />
Borehole No. 4 was being drilled at this time. Borehole No. 4 was completed <strong>and</strong> three more<br />
boreholes were drilled in an effort to locate the entrapped miners after the underground rescue<br />
efforts were suspended. The location for Borehole No. 4 was in the South Barrier section<br />
bleeder entry, five crosscuts outby Borehole No. 3. Drilling <strong>of</strong> this borehole started at 3:45 p.m.<br />
on August 16, 2007. Borehole No. 4 intersected the mine at crosscut 142 in the No. 4 entry at<br />
9:16 a.m. on August 18, 2007. This was the projected mine location for this borehole. The mine<br />
void was 4 feet at this location. After penetrating the mine, the drill steel was struck with a<br />
hammer to signal the miners. No response was heard. A quiet time was established by shutting<br />
down all surface operations. A series <strong>of</strong> explosive charges were set <strong>of</strong>f to signal the miners.<br />
First, three 100-pound charges were detonated at 12:16 p.m. At 12:53 p.m., three 50-pound<br />
charges were detonated. No response was detected by <strong>MSHA</strong>’s seismic location system.<br />
The location for Borehole No. 5 was in the primary escapeway entry <strong>of</strong> the South Barrier section.<br />
Drilling <strong>of</strong> this borehole started at 10:15 p.m. on August 19, 2007. The borehole intersected the<br />
mine at crosscut 133 in the No. 1 entry at 8:30 a.m. on August 22, 2007. This was the projected<br />
mine location for this borehole. The mine void was 0.5 feet at this location. An attempt to lower<br />
a camera into this borehole was aborted because the hole was blocked with mud at 511 feet from<br />
the surface.<br />
The location chosen for Borehole No. 6 was near the last known area where mining was taking<br />
place in the South Barrier section. Drilling <strong>of</strong> this borehole started at 4:00 p.m. on August 23,<br />
2007. The borehole intersected the mine halfway between crosscuts 138 <strong>and</strong> 139 in the No. 1<br />
entry at 4:02 p.m. on August 25, 2007. This was the projected mine location for this borehole.<br />
No mine void was encountered.<br />
The location chosen for Borehole No. 7 was in the kitchen/transformer area <strong>of</strong> the South Barrier<br />
section. This was near the area in which Borehole No. 1 was intended to intercept the mine.<br />
Drilling <strong>of</strong> this borehole started at 4:00 a.m. on August 28, 2007. The borehole intersected the<br />
mine level between crosscuts 137 <strong>and</strong> 138 in the No. 3 entry at 4:15 a.m. on August 30, 2007.<br />
39
This was the projected mine location for this borehole. A 7-foot rubble depth <strong>and</strong> a 2.7-foot void<br />
height were encountered. An immediate attempt to lower a camera into this borehole was<br />
thwarted because water <strong>and</strong> mud had blocked the hole approximately 9 feet from the mine level.<br />
A camera-equipped robot was quickly designed <strong>and</strong> assembled specifically for the Cr<strong>and</strong>all<br />
Canyon <strong>Mine</strong> drilling rescue efforts. The robot was lowered into Borehole No. 3 on August 27,<br />
2007. The robot was lowered into the mine with a winch <strong>and</strong> tripod arrangement as shown on<br />
Figure 21 <strong>and</strong> Figure 22. The robot was unable to enter the mine because the borehole had<br />
partially closed.<br />
Figure 21 - Arrangement for Lowering Robot into <strong>Mine</strong> Through a Borehole<br />
Figure 22 - Robot Being Lowered Into Borehole<br />
On August 30, 2007, the robot was lowered into Borehole No. 4 in the same manner as was<br />
attempted with Borehole No. 3. However, it was only able to travel a short distance in the mine<br />
due to the rubble. While retrieving the robot from Borehole No. 4, it became wedged in the<br />
borehole <strong>and</strong> could not be retrieved.<br />
40
Attempt to Locate <strong>Mine</strong>rs - <strong>MSHA</strong>’s Seismic System<br />
<strong>MSHA</strong> maintains a truck-mounted seismic location system at the Pittsburgh <strong>Safety</strong> <strong>and</strong> <strong>Health</strong><br />
Technology Center. The system is designed to detect <strong>and</strong> locate entrapped miners. The truckmounted<br />
system consists <strong>of</strong> a seismic truck, generator truck, <strong>and</strong> a supply trailer. The system is<br />
unique compared to typical seismic monitoring equipment. The system is tuned specifically to<br />
detect the frequencies generated by miners signaling by pounding on the ro<strong>of</strong>.<br />
Kravitz was notified <strong>of</strong> the accident at 5:58 a.m. MDT on August 6, 2007, <strong>and</strong> began to ready the<br />
system. The system was airlifted from Pittsburgh, Pennsylvania, to Gr<strong>and</strong> Junction, Colorado,<br />
<strong>and</strong> arrived at approximately 4:00 a.m. on August 7, 2007. The two trucks were driven to the<br />
mine <strong>and</strong> arrived at 10:30 a.m. that morning.<br />
The seismic location system utilizes geophone sub-arrays which detect <strong>and</strong> transmit signals to<br />
the seismic truck. Each array consists <strong>of</strong> several geophones, preamp <strong>and</strong> telemetry unit with<br />
antenna. A line-<strong>of</strong>-sight path is required from the sub-array antennas to the truck for the<br />
telemetry to function. Due to the steep terrain, the seismic location truck was set up to the west<br />
<strong>of</strong> the mine in Joes Valley. This provided a clear line <strong>of</strong> communication to each sub-array.<br />
While the truck was being positioned in Joes Valley, other members <strong>of</strong> the MEU set up the subarrays.<br />
The system became operational at approximately 10:30 p.m. on August 7, 2007.<br />
The sub-arrays <strong>and</strong> drilling operations were both centered over the last known location <strong>of</strong> the<br />
entrapped miners. After the first signals were analyzed, it was apparent that noise from the<br />
drilling operations <strong>and</strong> drill pad preparations would preclude any chance <strong>of</strong> receiving signals<br />
from underground while drilling. System sensitivity had to be decreased during drilling. The<br />
sub-arrays were relocated several times to maximize the chance <strong>of</strong> receiving a signal. A quiet<br />
period was established after each borehole intersected the mine. The system sensitivity was<br />
maximized at these times <strong>and</strong> the system was carefully monitored.<br />
Suspension <strong>of</strong> Rescue Efforts<br />
After the August 16 accident, a group <strong>of</strong> independent ground control experts was assembled by<br />
GRI <strong>and</strong> <strong>MSHA</strong> to reevaluate conditions <strong>and</strong> rescue methods. On August 19, 2007, the seven<br />
member panel convened at the mine site. The panel members, listed below, included three<br />
NIOSH employees <strong>and</strong> four consultants.<br />
• Keith A. Heasley, Ph.D., P.E., Pr<strong>of</strong>essor, West Virginia University<br />
• Hamid Maleki, Ph.D., P.E., President/Principal, Maleki Technologies Inc.<br />
• Christopher Mark, Ph.D., P.E., Mining Engineer, NIOSH Pittsburgh Research Laboratory<br />
• Anthony T. Iannacchione, Ph.D., P.E., Mining Engineer, NIOSH Pittsburgh Research<br />
Laboratory<br />
• Reid W. Olsen, Business Manager, Bruno Engineering, P.C.<br />
• Morgan Moon, Engineering Consultant, Morgan Moon Co.<br />
• Peter Swanson, Ph.D., Research Geophysicist, NIOSH Spokane Research Laboratory<br />
The panel was charged with two objectives: evaluate the overall stability <strong>of</strong> the mine <strong>and</strong> the<br />
underlying <strong>and</strong> overlying strata in the Main West area, inby crosscut 107; <strong>and</strong> quantify the risks<br />
<strong>and</strong> recommend potential ground control methods <strong>of</strong> gaining access to the last known location <strong>of</strong><br />
the miners. On August 20, 2007, the panel issued a written statement <strong>and</strong> presented it to<br />
41
epresentatives <strong>of</strong> the mine operator <strong>and</strong> <strong>MSHA</strong> at the mine site. The panel stated “that the<br />
overwhelming preponderance <strong>of</strong> data indicates that the entire Main West area remains in a state<br />
that is structurally unstable. We are highly concerned that dangerous seismic activity <strong>and</strong> pillar<br />
instability are likely to continue, <strong>and</strong> that it is not possible to accurately predict the timing or<br />
location <strong>of</strong> these events. No matter how a miner might access the Main West area, seismic<br />
activity <strong>and</strong> pillar instability will pose a significant risk. These risks would be further increased<br />
by any excavation <strong>of</strong> coal in the Main West area.”<br />
The evaluation confirmed what the mine operator <strong>and</strong> <strong>MSHA</strong> had surmised from the August 16<br />
accident when underground rescue work was suspended. The panel reinforced the opinion that<br />
even with a much stronger support system in place, the process <strong>of</strong> disturbing the rubble for<br />
installation <strong>of</strong> the next set <strong>of</strong> supports would endanger those installing the support system. Based<br />
on the panel’s evaluation it was decided that rescue efforts would be limited to borehole drilling.<br />
If miners were located, entering the mine via rescue capsule would be pursued.<br />
Drilling continued until August 30, at which time sufficient information had been obtained to<br />
determine that the entrapped miners could not have survived the August 6 accident due to<br />
extensive burst damage <strong>and</strong> low oxygen on the section. As a result <strong>of</strong> information obtained from<br />
the boreholes, the unfavorable conditions encountered underground, <strong>and</strong> the findings <strong>of</strong> the<br />
expert panel, the families were notified on August 31, 2007, at 5:00 p.m. that all rescue efforts<br />
were being suspended. The bodies <strong>of</strong> Kerry Allred, Don Erickson, Jose Luis Hern<strong>and</strong>ez,<br />
Juan Carlos Payan, Br<strong>and</strong>on Phillips, <strong>and</strong> Manuel Sanchez remained entombed in the mine.<br />
<strong>Mine</strong> Closure<br />
The decision to suspend rescue efforts was followed by the mine operator’s announcement to<br />
cease coal production at the mine. Activities at the mine changed from rescue efforts to the<br />
recovery <strong>of</strong> mining equipment. On September 4, 2007, at 3:55 p.m., the 103(k) order was<br />
modified to allow work inby crosscut 90, provided that all entries were continually monitored for<br />
oxygen, carbon monoxide, <strong>and</strong> methane. Travel inby crosscut 107 was prohibited. The order<br />
was modified on September 14, 2007, at 2:45 a.m. to prohibit work inby crosscut 50 <strong>of</strong> the Main<br />
West. This modification also required all persons working underground to be provided with<br />
multi-gas detectors capable <strong>of</strong> detecting oxygen, carbon monoxide, <strong>and</strong> methane.<br />
On September 27, 2007, BLM received a plan from the mine operator requesting approval to<br />
grout the boreholes drilled during the rescue attempt. BLM approved the plan the following day.<br />
On October 1, 2007, the mine operator submitted a plan to <strong>MSHA</strong> detailing the grouting <strong>of</strong> the<br />
boreholes on East Mountain <strong>and</strong> construction <strong>of</strong> concrete block walls in the mine openings to<br />
prevent entrance by unauthorized persons. <strong>MSHA</strong> acknowledged the plan on October 18, 2007.<br />
The borehole ab<strong>and</strong>onment process began on October 12, 2007, <strong>and</strong> was completed on<br />
October 15, 2007. The actual plugging <strong>of</strong> the boreholes varied from borehole to borehole.<br />
Uncased boreholes were extensively blocked. Boreholes were filled from the point <strong>of</strong> blockage<br />
to within 20 feet <strong>of</strong> the surface with ab<strong>and</strong>onite, a bentonite based grout mixture. The top 20 feet<br />
<strong>of</strong> all boreholes was filled with cement.<br />
42
INVESTIGATION OF THE ACCIDENT<br />
The <strong>MSHA</strong> Administrator <strong>of</strong> Coal <strong>Mine</strong> <strong>Safety</strong> <strong>and</strong> <strong>Health</strong> appointed a team to investigate the<br />
accident at the mine, led by Richard A. Gates, District Manager <strong>of</strong> Coal District 11. The<br />
remainder <strong>of</strong> the team consisted <strong>of</strong> personnel from <strong>MSHA</strong> Coal Districts 2, 3, 6, 11, <strong>and</strong><br />
Technical Support’s Pittsburgh <strong>Safety</strong> <strong>and</strong> <strong>Health</strong> Technology Center. The investigation was<br />
conducted jointly with the State <strong>of</strong> Utah Labor Commission. Sherrie Hayashi, Labor<br />
Commissioner served as the state representative. The team received assistance from <strong>MSHA</strong><br />
personnel in Headquarters, Educational Field Services, <strong>and</strong> Program Evaluation <strong>and</strong> Information<br />
Resources. The team also received assistance from personnel at The University <strong>of</strong> Utah, West<br />
Virginia University, United States Geological Survey, <strong>and</strong> Neva Ridge Technologies. The<br />
investigation team was announced on August 30, 2007, <strong>and</strong> arrived at <strong>MSHA</strong>’s Price, Utah,<br />
Field Office on September 5, 2007.<br />
Representatives <strong>of</strong> the miners <strong>and</strong> GRI participated in the on site investigation. At the mine, the<br />
investigative procedures included mapping specific underground areas <strong>of</strong> the mine including the<br />
August 16, 2007, accident scene, <strong>and</strong> photographing the affected areas. Unstable ground<br />
conditions inby crosscut 107 <strong>of</strong> Main West limited the underground investigation to two<br />
underground visits focusing on the August 16 accident scene. However, the team was able to<br />
take advantage <strong>of</strong> in-mine information obtained during the rescue efforts from August 6 through<br />
August 16. Pertinent records <strong>and</strong> documents were obtained <strong>and</strong> reviewed during the course <strong>of</strong><br />
the investigation. Information <strong>and</strong> records were obtained from <strong>MSHA</strong> District 9 <strong>of</strong>fices, GRI,<br />
<strong>and</strong> AAI.<br />
The investigation team identified people who had knowledge relevant to the accident <strong>and</strong><br />
conducted 80 interviews. These people included current <strong>and</strong> former employees <strong>of</strong> Genwal<br />
Resources Inc, UtahAmerican Energy Inc. <strong>and</strong> other Murray Energy Corporation operations,<br />
<strong>MSHA</strong>, Bureau <strong>of</strong> L<strong>and</strong> Management, University <strong>of</strong> Utah, Agapito Associates, Inc., <strong>and</strong> Energy<br />
West Mining Company. The interviews were conducted at:<br />
• Southeastern Utah Association <strong>of</strong> Local Governments Building, Price, Utah,<br />
• Residence Inn, Salt Lake City, Utah,<br />
• City Hall Building, Spring City, Utah,<br />
• University <strong>of</strong> Utah, Salt Lake City, Utah,<br />
• National <strong>Mine</strong> <strong>Health</strong> <strong>and</strong> <strong>Safety</strong> Academy, Beckley, WV,<br />
• Agapito Associates, Inc., Gr<strong>and</strong> Junction, Colorado,<br />
• Hall & Evans LLC, Denver, Colorado,<br />
• <strong>MSHA</strong> Approval <strong>and</strong> Certification Center, Triadelphia, WV.<br />
The interviews with <strong>MSHA</strong> were voluntary. A number <strong>of</strong> witnesses declined to give interviews<br />
to <strong>MSHA</strong>, including current <strong>and</strong> former employees <strong>of</strong> Murray Energy Corporation operations<br />
<strong>and</strong> AAI.<br />
In addition to this accident investigation <strong>and</strong> the independent review noted in the Preface, there<br />
have been several other governmental investigations <strong>and</strong> hearings related to the Cr<strong>and</strong>all Canyon<br />
<strong>Mine</strong> accidents. These include those conducted by: the Utah <strong>Mine</strong> <strong>Safety</strong> Commission; the<br />
Senate Appropriations Subcommittee on Labor, <strong>Health</strong> <strong>and</strong> Human Services, Education <strong>and</strong><br />
Related Agencies; the Senate Committee on <strong>Health</strong>, Education, Labor, <strong>and</strong> Pensions; the House<br />
Committee on Education <strong>and</strong> Labor; <strong>and</strong> the Office <strong>of</strong> the Inspector General <strong>of</strong> the U.S.<br />
Department <strong>of</strong> Labor.<br />
43
DISCUSSION<br />
The Cr<strong>and</strong>all Canyon <strong>Mine</strong> accident investigation was somewhat unique among <strong>MSHA</strong><br />
investigations in that (1) it examined two separate but related fatal accidents <strong>and</strong> (2) it utilized a<br />
variety <strong>of</strong> technical analyses. It was obvious at the most fundamental level that the accidents at<br />
Cr<strong>and</strong>all Canyon <strong>Mine</strong> were precipitated by pillar failures in the South Barrier section. One<br />
could envision that the South Barrier was the last substantial block <strong>of</strong> coal supporting the<br />
mountain <strong>and</strong>, as it was removed, the mountain was simply too heavy for the pillars. Similarly,<br />
the August 16, 2007, accident could be attributed to the inability <strong>of</strong> the installed support system<br />
to protect rescuers from an unanticipated pillar burst. However, <strong>MSHA</strong>’s investigation augments<br />
these observations with detailed analyses intended to provide sufficient insight to prevent a<br />
recurrence.<br />
The following sections provide information pertaining to both accidents. Since these accidents<br />
were associated with dynamic pillar failures, detailed technical analyses <strong>of</strong> ground behavior <strong>and</strong><br />
mine design are included. In some instances, the results <strong>of</strong> the analyses are important in<br />
explaining what happened. In other instances, it is important to underst<strong>and</strong> the methodologies<br />
that were used. Sufficient technical detail has been included to describe the analyses <strong>and</strong> allow<br />
industry practitioners to apply the findings <strong>of</strong> the investigation to prevent future incidents.<br />
Additionally, each major section includes an introduction <strong>and</strong> summary which provide a general<br />
underst<strong>and</strong>ing <strong>of</strong> the issues.<br />
August 6 Accident Discussion<br />
The August 6 accident occurred as a result <strong>of</strong> the rapid failure <strong>of</strong> a large number <strong>of</strong> pillars.<br />
Although it was a single catastrophic event, the failure was the culmination <strong>of</strong> a series <strong>of</strong><br />
decisions, actions, events, <strong>and</strong> conditions that were made or occurred over a period <strong>of</strong> more than<br />
12 years (i.e., from the time the Main West entries in the vicinity <strong>of</strong> the accident site were<br />
developed).<br />
Pillars developed in 1995 in Main West proved to be adequate for development but deteriorated<br />
when adjacent longwall panels were mined. These pillars were protected from more extreme<br />
longwall abutment loading by large barriers (~450 feet wide) <strong>and</strong> the system, though damaged,<br />
remained stable. Mining through the barriers on both sides <strong>of</strong> Main West in 2007, however,<br />
disrupted the balance.<br />
Between late 2006 <strong>and</strong> February 2007, the 448-foot wide barrier north <strong>of</strong> Main West was<br />
developed by driving four entries parallel to the existing Main West entries. Smaller barriers<br />
remained on either side <strong>of</strong> the new section entries (53 feet wide on the south side <strong>and</strong> 135 feet<br />
wide on the north side). The 135-foot wide barrier that separated the North Barrier section from<br />
the adjacent longwall panel gob was insufficient to isolate the workings from substantial<br />
abutment loading. Despite the high stress levels associated with deep cover (up to 2,240 feet <strong>of</strong><br />
overburden) <strong>and</strong> longwall abutment stress, the section remained stable during development.<br />
However, as pillar recovery operations retreated under a steadily increasing depth <strong>of</strong> overburden,<br />
conditions worsened <strong>and</strong> culminated in a March 10, 2007, outburst accident <strong>of</strong> sufficient<br />
magnitude to cause the mining section to be ab<strong>and</strong>oned.<br />
Between March <strong>and</strong> July 2007, four entries were developed in the barrier south <strong>of</strong> Main West.<br />
Pillar dimensions were increased in an effort to mitigate the type <strong>of</strong> outburst failure that had<br />
occurred in the North Barrier section. The longer pillars were about 16% stronger but, at the<br />
44
same time, a narrower barrier pillar (121 feet versus 135 feet in the previous section) exposed the<br />
section to higher abutment stress from the adjacent longwall gob. The net effect was that the<br />
mining experience in the South Barrier section was quite similar to that in the north. Once again,<br />
the section was developed without incident but conditions worsened during pillar recovery <strong>and</strong><br />
culminated in the catastrophic August 6, 2007, outburst accident.<br />
The August 6 event affected a much broader area than the March 10 outburst accident in the<br />
North Barrier section. The primary reason for this was that entry development in both Barrier<br />
sections had segmented the original, ~450-feet wide Main West barriers into relatively small<br />
pillars; these pillars formed a large area <strong>of</strong> similarly sized <strong>and</strong> marginally stable pillars. When<br />
the North Barrier section was developed, the overall system (i.e., the North Barrier section, the<br />
Main West, <strong>and</strong> the 53-foot barrier between the two) effectively created a nine-entry system <strong>of</strong><br />
similarly sized pillars. When the South Barrier section was developed, the system was exp<strong>and</strong>ed<br />
to a 13-entry system albeit with slightly stronger section pillars. With this large area <strong>of</strong> similarly<br />
sized <strong>and</strong> marginally stable pillars, once failure initiated at any point in the system, the system<br />
was set to fail in domino fashion <strong>and</strong> on August 6 it did.<br />
GRI relied upon several engineering analyses to validate that their mining plan was sound.<br />
However, the results proved to be misleading in some cases because the analyses were wrong<br />
<strong>and</strong> in others they were misinterpreted. Three separate methods <strong>of</strong> analysis employed as part <strong>of</strong><br />
<strong>MSHA</strong>’s investigation confirm that the mining plan was destined to fail. Results <strong>of</strong> the first<br />
method, Analysis <strong>of</strong> Retreat Mining Pillar Stability (ARMPS), are well below NIOSH<br />
recommendations. The second method, a finite element analysis <strong>of</strong> the mining plan, indicates a<br />
decidedly unsafe, unstable situation in the making even without pillar recovery. Similarly, the<br />
third method, boundary element analysis, demonstrated that the area was primed for a massive<br />
pillar collapse (see Appendix K).<br />
All three analysis methods show that the area was destined to fail. However, additional analyses<br />
were required to underst<strong>and</strong> how <strong>and</strong> why it failed. Boundary element models provided insight<br />
to the strata mechanics associated with the failure. These results demonstrate that if material<br />
properties <strong>and</strong> loading conditions are exactly uniform throughout the Main West area, then some<br />
stimulus such as a gradual weakening <strong>of</strong> the coal over time or joint slip in the overburden may<br />
have triggered the event. On the other h<strong>and</strong>, if the properties <strong>and</strong> loading conditions are not<br />
uniform (a reasonable geologic assumption), the event may have been triggered by pillar<br />
recovery in the active mining section. The boundary element modeling only identified possible<br />
triggers, <strong>and</strong> by itself could not distinguish the most likely trigger. However, seismic analyses<br />
<strong>and</strong> subsidence information employed in the investigation provide further clarification that the<br />
collapse was most likely initiated by the mining activity.<br />
Analyses <strong>of</strong> the seismic event associated with the August 6 collapse indicate that it originated<br />
from a point near the last row <strong>of</strong> recovered pillars, just inby the last known location <strong>of</strong> the<br />
entrapped miners. Soon after the collapse, an initial location <strong>of</strong> the event was calculated<br />
automatically <strong>and</strong> posted on UUSS <strong>and</strong> USGS web sites. This calculation process provides<br />
expedient information <strong>of</strong> value to seismologists but it <strong>and</strong> other routine location procedures lack<br />
the precision required for this investigation. In the months following the accident, UUSS<br />
employed a variety <strong>of</strong> advanced seismological methods to improve source location accuracy <strong>and</strong><br />
to determine other characteristics <strong>of</strong> the collapse. UUSS determined that the magnitude 3.9<br />
event lasted only seconds, calculated that the mine opening decreased in height by approximately<br />
one foot over an area <strong>of</strong> 50 acres, <strong>and</strong> noted that movement likely occurred along a north-south<br />
oriented vertical plane on the west end <strong>of</strong> the collapse area. UUSS’s description <strong>of</strong> strata<br />
45
displacements is very consistent with other observations <strong>and</strong> analyses conducted during the<br />
investigation.<br />
Satellite radar images were used to determine surface displacements over the Cr<strong>and</strong>all Canyon<br />
<strong>Mine</strong>. A comparison <strong>of</strong> images acquired shortly before <strong>and</strong> after the accident revealed the<br />
development <strong>of</strong> a large surface depression over the accident site. Vertical movements greater<br />
than ¾ inches were observed on the surface over an area approximately 1 mile (east-to-west) by<br />
¾ miles (north-to-south). A maximum displacement <strong>of</strong> nearly 12 inches was observed over the<br />
121-foot wide barrier pillar about 500 feet outby the last known location <strong>of</strong> the entrapped miners.<br />
Borehole No. 5 penetrated the mine workings near the point <strong>of</strong> maximum displacement <strong>and</strong><br />
confirmed that the void space in an intersection was only 0.5 feet.<br />
Traditional surface elevation surveys between 1999 <strong>and</strong> 2004 show that strata overlying about<br />
half <strong>of</strong> the longwall panel south <strong>of</strong> the working section had not completely subsided <strong>and</strong> was<br />
cantilevered from the Main West South Barrier. Both traditional <strong>and</strong> satellite surveys conducted<br />
after the accident demonstrate that the surface over the panel <strong>and</strong> the barrier displaced downward<br />
as much as 12 inches. Furthermore, the satellite analysis indicates that the strata movement that<br />
occurred was much more abrupt at the southern <strong>and</strong> western edges <strong>of</strong> the depression (as<br />
evidenced by the steeper subsidence contours). The abrupt displacement on the western side is<br />
consistent with UUSS’s theory that some movement may have occurred on a steeply dipping<br />
(near vertical), north-south oriented plane. The abrupt displacement on the southern edge is<br />
consistent with substantial failure <strong>of</strong> the 121-foot wide barrier <strong>and</strong> an associated downward<br />
movement <strong>of</strong> cantilevered strata over the adjacent longwall gob. The volume <strong>of</strong> cantilevered<br />
strata likely provided the additional loading necessary to initiate the collapse event from the<br />
working section.<br />
Pillar recovery operations by their nature create a zone <strong>of</strong> high stress in adjacent workings. As<br />
pillars are removed, the weight <strong>of</strong> overburden that they once supported must then be carried by<br />
neighboring pillars. Abutment loads can be diminished if or when sufficient ro<strong>of</strong> caving <strong>and</strong><br />
compaction occurs in the gob to allow the weight <strong>of</strong> overburden to be transmitted into the floor<br />
where the pillars were removed; due to the limited dimensions <strong>of</strong> the South Barrier pillar<br />
recovery area, however, it is unlikely that gob compaction had occurred there. Abutment loads<br />
were present from the active retreat line <strong>and</strong> the adjacent longwall gob. Also, overburden depth<br />
(<strong>and</strong> the associated stress level) was increasing as pillar recovery progressed outby. Ultimately,<br />
it is most likely that the stress level exceeded the strength <strong>of</strong> a pillar or group <strong>of</strong> pillars near the<br />
pillar line <strong>and</strong> that failure initiated a rapid <strong>and</strong> widespread collapse that propagated outby<br />
through the large area <strong>of</strong> similarly sized pillars.<br />
As pillars were recovered in the South Barrier section, bottom coal was mined from cuts made<br />
into the production pillars <strong>and</strong> barrier. The effect <strong>of</strong> this activity was to reduce the strength <strong>of</strong><br />
the remnant barrier behind the retreating pillar line. Bottom mining was not addressed in AAI’s<br />
model to evaluate the mine design or in GRI’s approved ro<strong>of</strong> control plan. Similarly, barrier<br />
mining was conducted in violation <strong>of</strong> the approved ro<strong>of</strong> control plan. A portion <strong>of</strong> the barrier<br />
immediately inby the last know location <strong>of</strong> the miners was mined even though it had been<br />
specified to be left unmined. Although neither <strong>of</strong> these actions is a fundamental cause <strong>of</strong> the<br />
August 6 collapse, they increased the amount <strong>of</strong> load transferred to pillars at the working face<br />
<strong>and</strong> reduced the strength <strong>of</strong> the barrier adjacent to it.<br />
The following sections <strong>of</strong> this report provide details that support the observations <strong>and</strong><br />
conclusions <strong>of</strong> the investigation <strong>of</strong> the August 6 accident. Included are discussions <strong>of</strong>: the<br />
46
geology <strong>and</strong> mining methods at the mine; the relevant ground control history <strong>of</strong> the mine; the<br />
various analyses that were used to determine the nature <strong>and</strong> extent <strong>of</strong> the failure; a critique <strong>of</strong> the<br />
previous analyses that provided the basis for the implemented mining plan; <strong>and</strong> other safety<br />
issues (e.g., mine ventilation, emergency response, <strong>and</strong> training) pertaining to the August 6<br />
accident.<br />
Background for Ground Control Analysis<br />
Since both accidents at Cr<strong>and</strong>all Canyon <strong>Mine</strong> were essentially ground control failures, factors<br />
such as geology, mining dimensions, ground support, <strong>and</strong> mining method have direct or indirect<br />
relevance to the accident or implications regarding conditions encountered afterward. An<br />
overview <strong>of</strong> each <strong>of</strong> these subjects is provided below.<br />
General <strong>Mine</strong> Geology<br />
The Cr<strong>and</strong>all Canyon <strong>Mine</strong> is located in the Wasatch Plateau coal field, within the Hiawatha coal<br />
seam. The Hiawatha coal seam typically ranges from 5 to 13 feet thick in the Cr<strong>and</strong>all Canyon<br />
<strong>Mine</strong> reserve. Mining had been undertaken primarily where the coal seam height exceeded<br />
7.5 feet. The Hiawatha coal seam is at the base <strong>of</strong> the Blackhawk formation (Upper Cretaceous<br />
age). Corehole <strong>and</strong> geophysical data indicate that the overburden above the Hiawatha seam<br />
consists <strong>of</strong> 49% to 68% s<strong>and</strong>stone. The immediate mine ro<strong>of</strong> typically consists <strong>of</strong> 0 to 2 feet <strong>of</strong><br />
interbedded siltstone, shale, <strong>and</strong> s<strong>and</strong>stone overlain by bedded s<strong>and</strong>stone. The Star Point<br />
S<strong>and</strong>stone, which consists <strong>of</strong> massive s<strong>and</strong>stone beds interbedded with shale, lies beneath the<br />
Hiawatha seam. A general stratigraphic column for the mine is shown in Figure 23.<br />
The mine portal is at approximately 7,900 feet above sea level in the eastward trending Cr<strong>and</strong>all<br />
Canyon. Overburden ranges from less than 100 feet at the mine portal to 2,300 feet under the<br />
higher ridges due to the steep mountainous terrain. The Blackhawk formation overlying the<br />
Hiawatha coal seam consists <strong>of</strong> approximately 650 feet <strong>of</strong> interbedded s<strong>and</strong>stone <strong>and</strong> siltstone<br />
with an occasional coal seam. The Blind Canyon coal seam lies 55 to 100 feet above the<br />
Hiawatha coal seam. Within the Cr<strong>and</strong>all Canyon <strong>Mine</strong> reserve, the Blind Canyon seam is<br />
typically less than 3 feet thick <strong>and</strong> is not mined. Overlying the Blackhawk formation is the<br />
approximately 250-foot thick, cliff forming, Castlegate S<strong>and</strong>stone consisting predominantly <strong>of</strong><br />
s<strong>and</strong>stone interbedded with shale <strong>and</strong> siltstone. Alternating s<strong>and</strong>stone, siltstone, <strong>and</strong> shale <strong>of</strong> the<br />
Price River <strong>and</strong> North Horn formations exist above the Castlegate S<strong>and</strong>stone.<br />
Geologic structure in the area consists <strong>of</strong> faults, joints, <strong>and</strong> igneous dikes. The most significant<br />
geologic structure is the north-south oriented Joes Valley Fault system that delineates the<br />
western perimeter <strong>of</strong> the mine reserve (see Appendix D). In the overlying Castlegate S<strong>and</strong>stone<br />
<strong>and</strong> Price River formation, the joint orientation trends north to N20ºE. In the southwest <strong>and</strong><br />
southern portion <strong>of</strong> the reserve an igneous dike system oriented at approximately N80ºW exists<br />
near the southern reserve boundary.<br />
Within the mine property, the coal seam gradually dips at 2.5º to 4º in all directions from a high<br />
region in the northwest area (intersection <strong>of</strong> 2 nd North Main <strong>and</strong> longwall Panel 7 development<br />
entries). In the eastern portion <strong>of</strong> the mine, the face coal cleat (dominant cleat) trends N65ºW.<br />
Within the central <strong>and</strong> western portion <strong>of</strong> the mine, the face coal cleat mostly trends N40ºE.<br />
S<strong>and</strong>stone immediate ro<strong>of</strong> <strong>and</strong> s<strong>and</strong>stone channel scours <strong>of</strong> the coal seam have been encountered<br />
in some areas.<br />
47
Figure 23 - General Stratigraphic Column for Cr<strong>and</strong>all Canyon <strong>Mine</strong><br />
Mining Horizon <strong>and</strong> Mining Width<br />
The mining height throughout most <strong>of</strong> the Cr<strong>and</strong>all Canyon <strong>Mine</strong> was maintained at 7.5 to 8 feet.<br />
When the Hiawatha coal seam was less than 8-foot thick, the mined opening had rock ro<strong>of</strong> <strong>and</strong><br />
floor. However, coal seam thickness <strong>of</strong>ten exceeded the mining height. In these areas, coal was<br />
left unmined in either the floor or ro<strong>of</strong>. Most <strong>of</strong> the North <strong>and</strong> South Barrier sections were<br />
developed in the upper portion <strong>of</strong> the seam; the Main West entries were developed in the lower<br />
portion <strong>of</strong> the seam.<br />
For the mining <strong>of</strong> the North Barrier section, the ro<strong>of</strong> control plan initially specified that no ro<strong>of</strong><br />
coal would be left in place. While mining in the North Barrier, on January 18, 2007, the plan<br />
48
was modified to allow ro<strong>of</strong> coal to be left in place in areas <strong>of</strong> weak immediate ro<strong>of</strong>. The plan<br />
specified that the minimum bolt length would be 6-foot in the ro<strong>of</strong> coal areas. Prior experience<br />
had shown that ro<strong>of</strong> coal would help support weak ro<strong>of</strong> rock. However, the ro<strong>of</strong> coal did not<br />
remain intact during retreat mining in the North Barrier section. Therefore, South Barrier section<br />
entries <strong>and</strong> crosscuts were mined to the overlying rock.<br />
While recovering pillars in the North <strong>and</strong> South Barrier sections, coal left in the floor during<br />
development (bottom coal) was being mined. After the upper portion <strong>of</strong> a cut had been made,<br />
the bottom coal would be mined. The continuous mining machine would ramp down into the<br />
bottom coal (up to 5 feet in the western portion <strong>of</strong> the South Barrier section), starting at the edge<br />
<strong>of</strong> the pillar <strong>and</strong> continuing to the end <strong>of</strong> the cut. The mining <strong>of</strong> bottom coal was not addressed<br />
in the approved ro<strong>of</strong> control plan.<br />
Areas <strong>of</strong> Main West developed with continuous haulage were mined an average <strong>of</strong><br />
approximately 20 to 21 feet wide (based on measurements from 1991 era mining east <strong>of</strong> crosscut<br />
107). In the newer development, entries <strong>and</strong> crosscuts were mined 18 feet wide, although the<br />
approved ro<strong>of</strong> control plan permitted a maximum mining width <strong>of</strong> 20 feet. Throughout the mine,<br />
pillars showed an hour glass rib pr<strong>of</strong>ile (see Figure 24). Consequently, mining widths measured<br />
at mid pillar <strong>of</strong>ten were wider than the original excavated width. The hour glass rib pr<strong>of</strong>ile was<br />
evident when overburden exceeded approximately 1,100 feet <strong>and</strong> was more pronounced as the<br />
depth increased. For example, measurements made during the accident investigation beneath<br />
1,500 feet <strong>of</strong> cover indicated that older entries, which averaged 20.6 feet on development, had<br />
hour glassed to 24.7 feet. Similarly, recently mined 18.5-foot wide openings had hour glassed to<br />
an average <strong>of</strong> 22.4 feet.<br />
Figure 24 - Hour Glass Shape <strong>of</strong> Stressed Pillars<br />
Primary <strong>and</strong> Supplemental Ro<strong>of</strong> Support<br />
Prior to 1997, the primary ro<strong>of</strong> support typically consisted <strong>of</strong> ¾-inch diameter, 5-foot long, fully<br />
grouted ro<strong>of</strong> bolts. Five bolts were installed per row, spaced 4 feet apart within a row <strong>and</strong> 4 to<br />
5 feet between rows. In 1997, the primary support practice transitioned to six ro<strong>of</strong> bolts per row<br />
with 3- to 4-foot bolt-to-bolt spacing within the row <strong>and</strong> wire mesh was installed with the<br />
primary ro<strong>of</strong> bolts. Since 1997, six ro<strong>of</strong> bolts per row <strong>and</strong> wire mesh were used for development<br />
<strong>and</strong> rehabilitation. Wire mesh consisted <strong>of</strong> welded wire panels 17 feet wide with 4 x 4-inch<br />
49
grids. In mid-2005, the mine adopted a 0.914-inch diameter x 5-foot fully grouted bolt as the<br />
primary ro<strong>of</strong> bolt for development mining <strong>and</strong> rehabilitation ro<strong>of</strong> bolting. For the mining <strong>of</strong> the<br />
North <strong>and</strong> South Barrier sections, the ro<strong>of</strong> control plan specified six bolts per row with a<br />
maximum distance <strong>of</strong> five feet between rows.<br />
Wood posts, wood cribs, Cans (steel cylinders filled with light-weight concrete), <strong>and</strong> cable bolts<br />
were used for supplemental support. Prior to 2004, wood posts were used as the only<br />
supplemental support during pillar recovery. However, beginning in early 2004, four 800-ton<br />
capacity Mobile Ro<strong>of</strong> Support (MRS) units were used in conjunction with breaker posts for pillar<br />
recovery.<br />
Accidents Related to Ground Control Failures<br />
St<strong>and</strong>ardized form reports must be completed by an operator <strong>and</strong> sent to <strong>MSHA</strong> within ten<br />
working days <strong>of</strong> each accident, occupational injury, or occupational illness that occurs at a mine,<br />
as required by 30 CFR 50.20. The term “accident” includes the following non-injury ground<br />
control related events, as defined in 30 CFR 50.2 (h):<br />
• An unplanned ro<strong>of</strong> fall at or above the anchorage zone in active workings where ro<strong>of</strong><br />
bolts are in use;<br />
• An unplanned ro<strong>of</strong> or rib fall in active workings that impairs ventilation or impedes<br />
passage;<br />
• A coal or rock outburst that causes withdrawal <strong>of</strong> miners or which disrupts regular<br />
mining activity for more than one hour.<br />
Data from the st<strong>and</strong>ardized form reports are collected <strong>and</strong> maintained by <strong>MSHA</strong>. <strong>Mine</strong><br />
operators also must maintain a map on which ro<strong>of</strong> falls, rib falls, <strong>and</strong> coal or rock bursts are<br />
plotted. <strong>MSHA</strong> uses all <strong>of</strong> this information when reviewing ro<strong>of</strong> control plans for adequacy<br />
pursuant to 30 CFR 75.223 (d). In addition to submission <strong>of</strong> st<strong>and</strong>ardized form reports, 30 CFR<br />
50.10 requires operators to immediately contact <strong>MSHA</strong> following an “accident” (as defined, in<br />
part, above) at the toll-free number, 1–800–746–1553. <strong>MSHA</strong> procedures for responding to<br />
accidents reported to the toll-free number ensure that the appropriate <strong>MSHA</strong> manager is rapidly<br />
engaged in the decision-making process for initiating accident investigations <strong>and</strong> for determining<br />
that the operator has taken appropriate action to protect miners <strong>and</strong> prevent a similar occurrence<br />
in the future.<br />
Since 1984, GRI submitted form reports for 23 ground control related injuries, 4 non-injury<br />
accidents where a longwall tailgate travelway passage was impeded by ground failures, <strong>and</strong><br />
8 non-injury ro<strong>of</strong> falls. However, only two <strong>of</strong> these ro<strong>of</strong> falls were plotted on the mine’s ro<strong>of</strong> fall<br />
map required by 30 CFR 75.223(b). Prior to 2007, 8 injuries related to coal bursts <strong>and</strong> bounces<br />
were reported. Seven <strong>of</strong> the eight events occurred during pillar recovery <strong>and</strong> longwall mining.<br />
A 2-entry yield pillar longwall gate configuration was introduced for the deeper longwall<br />
Panels 8 to 18 to minimize burst potential <strong>and</strong> ro<strong>of</strong> instability in the vicinity <strong>of</strong> the longwall face.<br />
Bounces sometimes occurred when the longwall panels retreated to a distance equal to the face<br />
length (panel width) or when longwall mining was being conducted under the deeper<br />
overburden. Records <strong>and</strong> interview statements show some bounces <strong>and</strong> bursts were severe<br />
enough to cause reportable injuries. Accident records <strong>and</strong> interview statements indicate five<br />
injuries from bursts <strong>and</strong> bounces occurred while longwall mining. Accident records also indicate<br />
that a miner was injured during pillar recovery from a coal burst in December 1993 <strong>and</strong> another<br />
was injured from a rib fall (reported as a bounce) in January 1994. Both accidents occurred<br />
during pillar recovery in the 7 th Left Panel <strong>of</strong>f 1 st North.<br />
50
Room <strong>and</strong> Pillar Retreat Coal Mining Overview<br />
At the time <strong>of</strong> the August 6 accident, pillars were being recovered on the South Barrier section.<br />
Pillar recovery is undertaken at approximately 30% <strong>of</strong> the 638 underground coal mines in the<br />
United States. Approximately 5% <strong>of</strong> the 638 underground coal mines project pillar recovery in<br />
overburden exceeding 1,250 feet. In pillar recovery operations, a series <strong>of</strong> pillars are first<br />
developed using a continuous mining machine <strong>and</strong> the associated mining equipment.<br />
Subsequently, the same equipment is used to remove the pillars. The process generally involves<br />
retreating from the deepest point <strong>of</strong> advance by taking sequential cuts from pillars with the<br />
continuous mining machine (typically radio remote controlled) as illustrated in Figure 25.<br />
Adjoining pillars are sequentially mined, one pillar row at a time. The regions where the coal<br />
pillars are removed are allowed to cave. The border between the remaining pillars being<br />
recovered <strong>and</strong> the area where the ro<strong>of</strong> is expected to break is known as the pillar line. The<br />
immediate work area is protected by the intact surrounding pillars <strong>and</strong> supplemental support<br />
systems. The Cr<strong>and</strong>all Canyon <strong>Mine</strong> used pillar recovery early in its history (until 1995) <strong>and</strong><br />
restarted pillar recovery in early 2004 (see Appendix D).<br />
Figure 25 - Example <strong>of</strong> a Pillar Recovery Cut Sequence<br />
Nature <strong>and</strong> Extent <strong>of</strong> Failure<br />
The August 6, 2007, outburst accident was a rapid, catastrophic failure <strong>of</strong> pillars in a large area<br />
<strong>of</strong> the mine. Rescue attempts in the South Barrier section entries <strong>and</strong> in the sealed portion <strong>of</strong> the<br />
Main West entries provided direct observations <strong>of</strong> the nature <strong>and</strong> outby extent <strong>of</strong> the failure.<br />
Boreholes from the surface provided insight on the inby side. These observations were<br />
substantiated by survey <strong>and</strong> satellite borne radar subsidence data, <strong>and</strong> seismological records.<br />
Seismological analyses indicate that the 3.9 magnitude event associated with the August 6 failure<br />
was characteristic <strong>of</strong> a collapse event <strong>and</strong> not a naturally occurring earthquake. The mine<br />
collapse resulted in a surface depression up to 12 inches. The greatest vertical movements (<strong>and</strong><br />
51
corresponding pillar damage at seam level) were located east <strong>of</strong> the last known location <strong>of</strong> the<br />
entrapped miners. However, pillar damage <strong>of</strong> varying degrees extended over a much broader<br />
area. The most accurate measure <strong>of</strong> the initiation time <strong>of</strong> the August 6 accident was 2:48:40 a.m.<br />
(MDT). This time was determined from the seismological analysis <strong>and</strong> confirmed using records<br />
from the atmospheric monitoring system in operation at the mine at the time <strong>of</strong> the accident.<br />
Underground Observations<br />
Within minutes <strong>of</strong> the accident, mine workers attempted to reach the South Barrier section to<br />
assist their coworkers. These initial efforts <strong>and</strong> additional attempts in the following days<br />
demonstrated that bursting had damaged pillars as far outby as crosscut 119, approximately<br />
½ mile outby the entrapped miners. Debris from the outburst blocked access to all South Barrier<br />
entries inby crosscut 126 (see Figure 26). Attempts to reach the miners by breaching a seal <strong>and</strong><br />
entering the Main West entries revealed poor ground conditions there as well. Inby the seals at<br />
Main West crosscut 118, the ground was working <strong>and</strong> bounces were occurring. Pillar<br />
deterioration (rib sloughage) had narrowed walkways to no more than 2 to 3 feet. Ro<strong>of</strong> bolts<br />
were showing signs <strong>of</strong> excessive loading.<br />
Figure 26 - Extent <strong>of</strong> Pillar Rib Damage Outby Crosscut 119<br />
On August 11, 2007, ground conditions were mapped in the Main West entries <strong>and</strong> the North <strong>and</strong><br />
South Barrier workings outby crosscut 119. Pillar damage was noted up to three crosscuts outby<br />
the seals (see Figure 26). The damaged ribs did not appear to be the result <strong>of</strong> bursting. Rather,<br />
the damage appeared to be associated with abutment stress transferred from inby the seals.<br />
Figure 27 <strong>and</strong> Figure 28 illustrate the difference between damaged <strong>and</strong> undamaged pillar rib<br />
conditions. Figure 27 shows normal Main West pillar rib conditions <strong>and</strong> Figure 28 shows recent<br />
pillar rib sloughage from abutment stress.<br />
52
Figure 27 - Normal Main West Pillar Rib Conditions<br />
Figure 28 - Main West Pillar Rib Condition showing Recent Sloughage from Abutment Stress<br />
53
Borehole Observations<br />
Conditions determined by the boreholes <strong>and</strong> visual observations from borehole cameras set the<br />
western boundary <strong>of</strong> the collapse between Borehole Nos. 3 <strong>and</strong> 4. Borehole No. 4 <strong>and</strong> others to<br />
the east <strong>of</strong> that location indicated that the mine openings contained rubble. Boreholes in the<br />
entries were filled or nearly filled with rubble while boreholes in the intersections contained less<br />
rubble. Figure 29 depicts the borehole locations.<br />
Figure 29 - Borehole Locations <strong>and</strong> Conditions Observed<br />
Surface Subsidence Determined from GPS Surveys<br />
Surface subsidence had been monitored over the Main West <strong>and</strong> the adjacent longwall panels<br />
since 1999. Longwall subsidence data <strong>and</strong> characteristics are described in Appendix L. Initially,<br />
a baseline survey was done to establish monuments along a north-south line south <strong>of</strong> crosscut<br />
133 in the Main West (crosscut 129 in the South Barrier). Follow-up surveys were done<br />
annually from 2000 to 2004. Aerial photogrammetric surveys were conducted in 2005 <strong>and</strong> 2006.<br />
The aerial survey data lacked the accuracy required to supplement the l<strong>and</strong> surveys.<br />
On August 17, 2007, the subsidence monitoring line was resurveyed over a portion <strong>of</strong> the South<br />
Barrier section <strong>and</strong> longwall Panels 13 to 14. The GPS survey was conducted along the line <strong>of</strong><br />
existing surface monuments to provide an updated pr<strong>of</strong>ile <strong>of</strong> subsidence. Some <strong>of</strong> the<br />
monuments that previously had been used to monitor subsidence were dislodged. Although the<br />
data are incomplete, the pr<strong>of</strong>ile indicates that a substantial downward movement<br />
(approximately1 foot) occurred over the South Barrier between July 30, 2004, <strong>and</strong> August 17,<br />
2007 (see Figure 30). However, some <strong>of</strong> the deviation noted in this <strong>and</strong> earlier time periods may<br />
reflect accuracy limitations <strong>of</strong> the GPS surveys (±0.2 feet).<br />
The longwall subsidence behavior observed in Figure 30 is somewhat typical <strong>of</strong> the Wasatch<br />
Plateau. In this region, strong, thick strata in the overburden control caving characteristics <strong>and</strong><br />
are responsible for the high abutment stresses <strong>and</strong> long abutment stress transfer distances<br />
discussed in the ground control analysis portion <strong>of</strong> this report. Subsidence data collected<br />
elsewhere in the region indicates that the amount or extent <strong>of</strong> cantilevered strata at panel<br />
boundaries varies. Data presented in Figure 30 indicate that subsidence adjacent to the South<br />
Barrier section was incomplete over more than half the width <strong>of</strong> Panel 13. The figure also<br />
demonstrates that additional subsidence over the panel <strong>and</strong> the adjacent barrier was observed<br />
between 2004 <strong>and</strong> 2007. To determine how much <strong>of</strong> the recorded movement during the 3-year<br />
period was associated with the August accidents, Interferometric Synthetic Aperture Radar<br />
(InSAR) analyses were conducted.<br />
54
Figure 30 - Subsidence Pr<strong>of</strong>iles over Panels 13 to 15<br />
Measurements from 2004 <strong>and</strong> 2007, vertical scale exaggerated<br />
Surface Subsidence Determined from InSAR Analyses<br />
Interferometric Synthetic Aperture Radar (InSAR) analyses provide precise surface deformation<br />
measurements using satellite radar images. The process compares satellite images taken over a<br />
study area at different times to determine surface changes (see Appendix L). Although this<br />
technique is relatively new to the U.S. coal industry, it has been used extensively to study ground<br />
movement, including that due to earthquakes, groundwater loss, <strong>and</strong> volcanic activity.<br />
Analyses <strong>of</strong> the Cr<strong>and</strong>all Canyon <strong>Mine</strong> initially were conducted by the Radar Project <strong>of</strong> L<strong>and</strong><br />
Sciences at the U.S. Geological Survey’s Earth Resources Observation <strong>and</strong> Science Center in<br />
Vancouver, Washington (USGS). Several time intervals were evaluated to assess surface<br />
deformation before <strong>and</strong> after the August accidents. InSAR subsidence analyses for four time<br />
intervals between: June <strong>and</strong> September 2006, December 2006 <strong>and</strong> June 2007, June <strong>and</strong><br />
September 2007, <strong>and</strong> September <strong>and</strong> October 2007 were evaluated. Three <strong>of</strong> the four intervals<br />
displayed no significant subsidence. However, comparison <strong>of</strong> satellite images acquired on<br />
June 8, 2007, <strong>and</strong> September 8, 2007 (a relatively short span <strong>of</strong> time within which the August<br />
accidents occurred) revealed the development <strong>of</strong> a large subsidence depression over the accident<br />
site.<br />
Neva Ridge Technologies (Neva Ridge) in Boulder, Colorado, subsequently was contracted to<br />
provide an independent InSAR analysis. The Neva Ridge report (see Appendix M) confirmed<br />
the lateral extent <strong>and</strong> vertical displacements determined by USGS. Maximum vertical<br />
displacement at the center <strong>of</strong> the depression was 12 inches (30 centimeters). Vertical subsidence<br />
from the Neva Ridge study is shown on Figure 31. Calculations, based on coal density (in situ<br />
<strong>and</strong> post mining) <strong>and</strong> mining geometry (pillar <strong>and</strong> entry volumes) demonstrate that surface<br />
subsidence <strong>of</strong> this magnitude is consistent with extensive coal pillar bursts <strong>and</strong> substantial filling<br />
<strong>of</strong> entries. A discussion <strong>of</strong> the two studies is included in Appendix L.<br />
55
Figure 31 - Surface Deformation from Neva Ridge InSAR Analyses (June to Sept. 2007)<br />
<strong>MSHA</strong> made visual surveys <strong>of</strong> the ground surface above Main West before the InSAR data was<br />
available. These surveys were conducted from a helicopter <strong>and</strong> on foot. Mining related surface<br />
deformation was not visible. However, a maximum <strong>of</strong> 12 inches (30 cm) <strong>of</strong> vertical subsidence<br />
over such a broad area may not form visible slips or cracks. Soil slumps were noted but could<br />
not be associated with the August accidents.<br />
The InSAR analysis generally confirms the magnitude <strong>of</strong> subsidence determined in the GPS<br />
survey <strong>and</strong> further constrains the time in which the subsidence occurred. The analysis also<br />
provides insight to the lateral extent <strong>of</strong> the collapse zone. As illustrated in Figure 31, the surface<br />
area affected by the collapse extends approximately 1 mile east-to-west <strong>and</strong> ¾ miles north-tosouth.<br />
At seam level, subsidence principles suggest that the extent <strong>of</strong> the collapse would be less<br />
laterally but greater vertically than the surface expression implies.<br />
The depth <strong>of</strong> burst coal in the No. 1 entry <strong>of</strong> the South Barrier section increased from crosscut<br />
120 until it blocked access to all entries at approximately crosscut 126. Above crosscut 119, the<br />
InSAR analysis indicates there was almost 2 inches (5 cm) <strong>of</strong> vertical subsidence; above<br />
crosscut 126, the subsidence was approximately 6 inches (15 cm). The 15 cm subsidence<br />
contour encompasses all <strong>of</strong> the area above the South Barrier section from crosscuts 126 to 142.<br />
If the 15 cm contour is used as an indication <strong>of</strong> pillar damage severe enough to block all travel,<br />
then the surface subsidence indicates that the entire working section was severely damaged. The<br />
region <strong>of</strong> Main West between the longwall panels that subsided vertically 6 inches (15 cm) or<br />
more was approximately 69 acres in area, centered near crosscut 135.<br />
56
The area <strong>of</strong> greatest subsidence, <strong>and</strong> therefore the greatest damage at seam level, was centered on<br />
the 121-foot wide barrier between the South Barrier section <strong>and</strong> longwall Panel 13. A maximum<br />
displacement <strong>of</strong> nearly 12 inches was observed over the barrier pillar about 500 feet outby the<br />
last known location <strong>of</strong> the entrapped miners. Borehole No. 5 penetrated the mine workings near<br />
the point <strong>of</strong> maximum displacement <strong>and</strong> confirmed that the damage was severe there as<br />
demonstrated by the observation that the void space in that intersection was only 0.5 feet.<br />
It is noteworthy that the maximum surface displacement occurred near crosscut 135, a location<br />
nearly equidistant from the ridge top (deepest overburden at ~crosscut 129) <strong>and</strong> the pillar line<br />
(crosscut 142). This observation implies that either the coal pillars were weaker at this point or<br />
the stress levels were higher than would be anticipated (i.e., if stress magnitude was based on<br />
overburden <strong>and</strong> abutment load transfer from the active pillar line). However, additional<br />
observations <strong>of</strong> both InSAR <strong>and</strong> GPS survey data suggest that stress rather than coal strength<br />
controlled the location <strong>of</strong> the failure.<br />
Traditional surface elevation surveys between 1999 <strong>and</strong> 2004 show that strata overlying about<br />
half <strong>of</strong> the longwall panel south <strong>of</strong> the working section had not completely subsided <strong>and</strong> was<br />
cantilevered from the Main West South Barrier. Both traditional <strong>and</strong> satellite surveys conducted<br />
after the accident demonstrate that the surface over the panel <strong>and</strong> the barrier displaced downward<br />
as much as 12 inches. Furthermore, the satellite analysis indicates that the strata movement that<br />
occurred was much more abrupt at the southern <strong>and</strong> western edges <strong>of</strong> the depression (as<br />
evidenced by the steeper subsidence contours). The abrupt displacement on the southern edge is<br />
consistent with substantial failure <strong>of</strong> the 121-foot wide barrier <strong>and</strong> an associated downward<br />
movement <strong>of</strong> cantilevered strata over the adjacent longwall gob. The volume <strong>of</strong> cantilevered<br />
strata likely provided the additional loading necessary to initiate the collapse event from the<br />
working section. The abrupt displacement on the western side is consistent with seismological<br />
analyses that indicate that some movement may have occurred on a steeply dipping (near<br />
vertical), north-south oriented plane.<br />
Seismology<br />
The seismic event created by the August 6 collapse was detected by a regional network <strong>of</strong><br />
seismographs maintained by the University <strong>of</strong> Utah. The preliminary location <strong>of</strong> the seismic<br />
event near the Joes Valley fault apparently led to speculation by some that the event was a<br />
naturally occurring earthquake. However, additional analyses <strong>of</strong> the event by both the<br />
University <strong>of</strong> Utah 2 , <strong>and</strong> the University <strong>of</strong> California at Berkeley <strong>and</strong> Lawrence Livermore<br />
National Laboratories 3 , determined that the seismic event was the result <strong>of</strong> the mine collapse.<br />
Months after the August accidents, the University <strong>of</strong> Utah Seismograph Stations (UUSS)<br />
reevaluated event locations using a “double difference” location method. This methodology can<br />
only be used after subsequent events with known locations are available. At Cr<strong>and</strong>all Canyon<br />
<strong>Mine</strong>, the method used the known location <strong>of</strong> the August 16 accident to improve location<br />
accuracy. The revised location indicated that the August 6 accident originated near the No. 3<br />
entry <strong>of</strong> the South Barrier section between crosscuts 143 <strong>and</strong> 144.<br />
Analyses <strong>of</strong> events recorded after the initial August 6 event provided additional insight to strata<br />
behavior <strong>and</strong> the nature <strong>of</strong> the mine collapse. For example, seismologic records demonstrated<br />
that activity persisted for more than 1-½ days after the initial failure. The UUSS reported this in<br />
an August 9, 2007, 5:00 p.m. (MDT) press release:<br />
57
Twelve seismic events were recorded by the University's seismic network in the<br />
first 38 [sic] hours following, <strong>and</strong> in the vicinity <strong>of</strong>, the large event <strong>of</strong> August 6.<br />
These smaller events range in magnitude from less than 1.0 to 2.2. A shock <strong>of</strong><br />
magnitude 2.1 occurred about 17 hours after the main event (at 8:05 PM MDT,<br />
August 6); another <strong>of</strong> magnitude 2.2 occurred about five hours later (at 01:13<br />
AM, August 7). These shocks are interpreted to reflect settling <strong>of</strong> the rockmass<br />
following a cavity collapse.<br />
The seismic record in this time period is consistent with underground observations <strong>of</strong> noise<br />
emanating from the strata as the initial rescue efforts were underway.<br />
Refined double difference locations <strong>of</strong> seismic events for the period <strong>of</strong> August 6 to August 27,<br />
2007, are shown in Figure 32. These refined locations were unavailable until three months after<br />
all rescue efforts had been suspended. The August 6 event is indicated by the red circle <strong>and</strong> the<br />
twelve events that occurred within 37 hours afterward are represented as tan circles; the radius <strong>of</strong><br />
each circle corresponds to the relative magnitude <strong>of</strong> the events. Activity during the first 37 hours<br />
after the accident was predominantly located on the outby side <strong>of</strong> the collapse area. Conversely,<br />
seismic activity for the time period August 8-27 (shown as blue <strong>and</strong> magenta circles) was<br />
concentrated on the inby side <strong>of</strong> the collapse area. Very few events were located near the north<br />
<strong>and</strong> south boundaries <strong>of</strong> the collapse area.<br />
Figure 32 – Double Difference Locations <strong>of</strong> Seismic Events, August 6-27, 2007<br />
Seismologic analyses indicated that the August 6, 2007, event was dominantly a collapse<br />
mechanism but the waveforms also included a smaller shear component. A likely explanation<br />
was shear displacement along a vertical plane with movement downward on the east side. The<br />
plane would have a strike <strong>of</strong> approximately 150 degrees azimuth. This conclusion is<br />
substantiated by InSAR analyses which show a more abrupt displacement on the western side <strong>of</strong><br />
the collapse area than on the eastern side. Steeper subsidence in this region could be consistent<br />
with movement on a steeply dipping, north-south oriented plane between the North <strong>and</strong> South<br />
58
Barrier section gobs. Extensive near-vertical joints are a prominent geologic feature <strong>of</strong> the strata<br />
at Cr<strong>and</strong>all Canyon <strong>Mine</strong>.<br />
Analyses also indicated that a collapse area <strong>of</strong> 50 acres moving downward approximately 1 foot<br />
represents a plausible model to quantitatively account for 80% <strong>of</strong> the seismic moment (i.e., the<br />
total energy) release associated with the event. Pechmann 2 explains that “Although this model is<br />
by no means unique, it serves to illustrate one possibility that is consistent with both the<br />
seismological data <strong>and</strong> the underground observations.” A more detailed discussion <strong>of</strong> the<br />
seismicity <strong>of</strong> the Cr<strong>and</strong>all Canyon <strong>Mine</strong> is provided in Appendix N.<br />
Time <strong>of</strong> the Accident<br />
Seismological data <strong>and</strong> mine-specific atmospheric monitoring records provided a very precise<br />
time <strong>of</strong> occurrence. The origin time <strong>of</strong> the seismic event was determined to be 2:48:40 a.m.<br />
(MDT). Seismic monitoring systems incorporate very accurate clocks to ensure that events<br />
detected by networks across the world can be correlated with one another.<br />
An atmospheric monitoring system (AMS) was operating in the mine. The system consisted <strong>of</strong><br />
computers, sensors, <strong>and</strong> a network to gather <strong>and</strong> record data on carbon monoxide (CO), fan<br />
pressure, tonnage mined, <strong>and</strong> conveyor belt status. At the time <strong>of</strong> the accident, a series <strong>of</strong><br />
communication failures occurred on the system. The failures began at the CO sensor on the<br />
South Barrier section alarm box <strong>and</strong> progressed to other sensors outby. The computer-generated,<br />
printed alarms for the initial failures showed a time <strong>of</strong> 2:51:31 a.m. However, the time display<br />
on the AMS computer that generated the printed alarms was not accurate.<br />
To determine an accurate time for the event, the AMS clock was synchronized with the time base<br />
at UUSS by telephone. This was done on several occasions to account for any drift in the<br />
monitoring system clock. Based on the AMS data, the corrected time <strong>of</strong> the communication<br />
failure report was calculated to be 2:48:53 a.m. The 13-second difference between the<br />
2:48:40 a.m. seismic event <strong>and</strong> the corrected AMS communication failure time can be explained<br />
largely by the methodology used by the AMS system to report a loss <strong>of</strong> communication <strong>and</strong> by<br />
the accuracy <strong>of</strong> the time correction.<br />
AMS alerts <strong>and</strong> alarms typically occur some time after the actual corresponding event,<br />
depending on the size <strong>and</strong> configuration <strong>of</strong> the system. The AMS system scans all sensors on the<br />
system. When a communications failure occurs, repeated attempts are made to communicate<br />
with the sensor before a failure is reported by the computer. The number <strong>of</strong> attempts can be set<br />
by the user. The time to report a communication failure depends on the time it takes for the<br />
system to cycle through the sensors <strong>and</strong> the number <strong>of</strong> attempts the system is set to make. It<br />
appears that data was being collected for the “CO Main West Section Alarm Box” sensor at an<br />
interval <strong>of</strong> 2 to 3 seconds before the accident. Because sensors were removed from the system<br />
after the accident, the pre-accident interval could not be determined during the investigation.<br />
Also, the number <strong>of</strong> attempts to reestablish communication for that sensor is unknown but was<br />
reported by the manufacturer to be typically 3 to 5. The accuracy <strong>of</strong> the time correction was<br />
estimated at plus or minus five seconds. Together, the time lag to report the communication<br />
failure <strong>and</strong> the uncertainty <strong>of</strong> the time display can explain the difference between the seismically<br />
determined time <strong>of</strong> event <strong>and</strong> the AMS communication failure. The most accurate measure <strong>of</strong><br />
the initiation time <strong>of</strong> the August 6 accident was 2:48:40 a.m. (MDT), as established by the<br />
seismic data.<br />
59
Summary - Nature <strong>and</strong> Extent <strong>of</strong> Failure<br />
The nature <strong>and</strong> extent <strong>of</strong> the collapse were estimated by combining all <strong>of</strong> the underground <strong>and</strong><br />
borehole observations, surface subsidence, <strong>and</strong> seismic evidence previously described.<br />
Seismological analyses indicate that the 3.9 Richter event associated with the August 6 failure<br />
was characteristic <strong>of</strong> a collapse event <strong>and</strong> not a naturally occurring earthquake. Analyses also<br />
indicate that it originated from a point near the last row <strong>of</strong> recovered pillars, just inby the last<br />
known location <strong>of</strong> the entrapped miners. The collapse occurred at 2:48:40 a.m. (MDT) <strong>and</strong> it<br />
lasted only several seconds. This time was determined from the seismological analysis <strong>and</strong> was<br />
consistent with corrected times from the atmospheric monitoring system in operation at the mine<br />
at the time <strong>of</strong> the accident.<br />
Surface subsidence data (GPS surveys <strong>and</strong> InSAR analyses) indicate that a surface depression up<br />
to 12 inches deep formed over the Main West between June 8 <strong>and</strong> September 8, 2007. Vertical<br />
movements greater than ¾ inches were observed on the surface over an area approximately<br />
1 mile (east-to-west) by ¾ miles (north-to-south). A maximum displacement <strong>of</strong> nearly 12 inches<br />
was observed over the 121-foot wide barrier pillar about 500 feet outby the last known location<br />
<strong>of</strong> the entrapped miners. Borehole No. 5 penetrated the mine workings near the point <strong>of</strong><br />
maximum displacement <strong>and</strong> confirmed that the void space in an intersection was only 0.5 feet.<br />
Although the displacements observed in the InSAR analyses could have occurred at any time<br />
between June 8 <strong>and</strong> September 8, several observations suggest that much <strong>of</strong> the movement was<br />
associated with the August 6 accident. First, it is noteworthy that negligible amounts <strong>of</strong><br />
displacement were noted in analyses <strong>of</strong> time periods before June <strong>and</strong> after September. Second,<br />
seismic activity detected in the aftermath <strong>of</strong> the event is located on the east <strong>and</strong> west margins <strong>of</strong><br />
the surface depressions. Finally, seismologists estimate that a relatively large volume <strong>of</strong> strata<br />
(e.g., 50 acres <strong>of</strong> ground moving downward approximately 1 foot over the Main West) must have<br />
been involved to account for measured seismic moment (i.e., total energy) <strong>of</strong> the event.<br />
The satellite analysis indicates that the strata movement was much more abrupt at the southern<br />
<strong>and</strong> western edges <strong>of</strong> the depression (as evidenced by the steeper subsidence contours). The<br />
abrupt displacement on the western side is consistent with UUSS’s theory that some movement<br />
may have occurred on a steeply dipping (near vertical), north-south oriented plane. The abrupt<br />
displacement on the southern edge is consistent with substantial failure <strong>of</strong> the 121-foot wide<br />
barrier <strong>and</strong> an associated downward movement <strong>of</strong> cantilevered strata over the adjacent longwall<br />
gob. The volume <strong>of</strong> cantilevered strata likely provided additional loading on the South Barrier<br />
section.<br />
Figure 33 superimposes a variety <strong>of</strong> data used to determine the extent <strong>of</strong> the collapse, including:<br />
the seismic data from the time <strong>of</strong> the August 6 accident to August 27, 2007, the borehole<br />
locations, the InSAR subsidence contours, <strong>and</strong> the likely extent <strong>of</strong> damaged pillars. The eastern<br />
boundary <strong>of</strong> the pillar failures was based on the underground observations <strong>and</strong> InSAR<br />
subsidence data <strong>and</strong> is consistent with residual seismic activity. The western edge <strong>of</strong> the pillar<br />
failures was based on the borehole observations <strong>and</strong> InSAR subsidence data <strong>and</strong> is consistent<br />
with the seismic location <strong>of</strong> the accident <strong>and</strong> the additional seismicity later in August 2007.<br />
60
Figure 33 - Combined Data <strong>and</strong> Likely Extent <strong>of</strong> Collapse<br />
The extent coincides approximately with the 5 cm vertical subsidence line. The 5 cm line falls<br />
between Borehole Nos. 3 <strong>and</strong> 4. The area indicating extensively damaged pillars was based on<br />
conditions observed near crosscut 126 where the damage was more severe <strong>and</strong> the entries were<br />
impassable. The boundary <strong>of</strong> the area follows the 15 cm subsidence contour <strong>and</strong> encompasses<br />
Boreholes Nos. 1, 2, 4, 5, 6, <strong>and</strong> 7, all <strong>of</strong> which showed damage.<br />
Main West Ground Control History<br />
The history <strong>of</strong> ground conditions in Main West provides a basis for the engineering backanalyses<br />
discussed in a later section <strong>of</strong> this report. Back-analysis is a process in which known<br />
failures or successes are evaluated to determine the relationship <strong>of</strong> engineering parameters to<br />
outcomes. For example, the mining scenario associated with the March 10, 2007, outburst<br />
accident in the North Barrier section provides insight to the conditions conducive to bursting at<br />
Cr<strong>and</strong>all Canyon <strong>Mine</strong>. Furthermore, the history demonstrates GRI’s failure to report outburst<br />
accidents. The following sections detail the sequence <strong>of</strong> events <strong>and</strong> associated ground control<br />
implications that culminated in the August 6 accident.<br />
Main West Development<br />
The Main West entries adjacent to the August 6, 2007, accident site were developed in 1995.<br />
This development included five entries <strong>and</strong> crosscuts on 90 x 92-foot centers. These workings<br />
were mined using a mobile bridge continuous haulage system. Pillar corners were rounded <strong>and</strong><br />
entries were mined to 20 feet or wider (particularly the middle entry, which contained the<br />
conveyor belt system). The mining height was established at 8 feet by mining to the bottom <strong>of</strong><br />
61
the seam <strong>and</strong> leaving ro<strong>of</strong> coal in the immediate ro<strong>of</strong>. The entries were stable for several years<br />
after development, prior to adjacent longwall mining.<br />
Longwall Panel Extraction<br />
Longwall panels were mined parallel to the Main West entries between 1997 <strong>and</strong> 2003. Six<br />
panels were mined north <strong>of</strong> Main West (Panels 7 to 12) <strong>and</strong> six were mined to the south<br />
(Panels 13 to 18). Barrier pillars measuring approximately 450 feet wide were established<br />
between Main West <strong>and</strong> the adjacent longwall Panels 12 <strong>and</strong> 13 (see Figure 34).<br />
Figure 34 – Initial Main West Barrier Pillars after Panel 13 Mining showing Overburden<br />
In retreat mining operations (longwall or pillar recovery), barrier pillars are used to protect<br />
workings from abutment loading associated with panel extraction <strong>and</strong> to separate active<br />
workings from worked out areas. As a block <strong>of</strong> coal is mined, the immediate ro<strong>of</strong> above the<br />
block falls into the void created by mining. At shallow depths <strong>and</strong> with suitably wide panels, the<br />
ro<strong>of</strong> failure can propagate to the surface <strong>and</strong> allow much <strong>of</strong> the weight <strong>of</strong> the overburden to be<br />
transmitted directly to the mine floor in the caved area. A portion <strong>of</strong> the overburden usually<br />
cantilevers over the void near the edges (see Figure 35). These cantilevered strata create load on<br />
the void boundaries in excess <strong>of</strong> the typical overburden load that would be carried.<br />
In deep overburden <strong>and</strong>/or in narrow extraction areas, failure may not propagate to the surface.<br />
Instead, strata near the excavation can fail <strong>and</strong> fall into the void while higher strata may simply<br />
sag onto the fallen lower layers. The strength <strong>and</strong> stiffness <strong>of</strong> rock layers in the mine ro<strong>of</strong><br />
generally dictate the degree to which the uncaved layers sag <strong>and</strong> transfer load into the broken<br />
material (gob). If the rock layers are strong <strong>and</strong> thick, load can be transferred across the void<br />
created by mining in much the same way that an arch bridge rests on abutments at either <strong>of</strong> its<br />
ends. This abutment stress is usually highest near the excavation <strong>and</strong> lessens with distance away<br />
from the caved area.<br />
62
Figure 35 - Abutment Stress due to Cantilevered Strata from Mining<br />
63
In the Main West entries, some influence <strong>of</strong> abutment stress was observed when each <strong>of</strong> the<br />
adjacent longwall Panels 12 <strong>and</strong> 13 were extracted in 1999. Abutment stresses associated with<br />
these longwall panels caused pillar rib sloughage <strong>and</strong> ro<strong>of</strong> deterioration. A similar observation<br />
was noted earlier as longwall panels were mined to within about 400 feet <strong>of</strong> the 2 nd North Mains.<br />
These observations imply that the Main West barriers <strong>and</strong> entry pillars were subjected to<br />
abutment stress <strong>and</strong> effects <strong>of</strong> this stress were evident at distances beyond 450 feet (the<br />
approximate width <strong>of</strong> the original barriers).<br />
Abutment stress from Panels 12 <strong>and</strong> 13 caused damage in Main West that required additional<br />
ro<strong>of</strong> support to maintain stability. The area with the most ro<strong>of</strong> deterioration <strong>and</strong> pillar sloughing<br />
appeared to be the region beneath more than 1,800 feet <strong>of</strong> overburden, which was approximately<br />
between crosscuts 123 <strong>and</strong> 150. In this region, roadways were timbered-<strong>of</strong>f, ro<strong>of</strong> coal was<br />
falling from around ro<strong>of</strong> bolts, <strong>and</strong> pillars showed significant rib sloughing. It was noted that<br />
ro<strong>of</strong> coal deterioration was most apparent in the middle No. 3 entry followed in severity by the<br />
No. 2 <strong>and</strong> No. 4 entries. Efforts focused on maintaining the No. 1 entry near the south barrier<br />
<strong>and</strong> No. 4 entry nearer the north barrier as intake <strong>and</strong> return air courses. As longwall mining<br />
progressed southward, the Main West entries required continued maintenance particularly to<br />
keep the stopping line intact.<br />
After March 2003, longwall mining south <strong>of</strong> Main West was completed <strong>and</strong> the worked out<br />
longwall district was sealed. The Main West entries were no longer needed as part <strong>of</strong> the<br />
longwall ventilation circuit. However, the area was not sealed at that time because GRI<br />
anticipated the possibility <strong>of</strong> recovering the Main West pillars. Later, GRI decided to forgo<br />
pillar recovery <strong>of</strong> the Main West workings inby crosscut 118 <strong>and</strong> sealed the area in<br />
November 2004. In a letter to the BLM dated November 10, 2004, GRI claimed that it “decided<br />
to construct the seals for the following reasons:<br />
1. The abutment loads from the longwall districts to the north <strong>and</strong> south <strong>of</strong> Main West in<br />
this area have caused the ro<strong>of</strong> <strong>and</strong> coal pillars to deteriorate to a point that a substantial<br />
economic investment would be required to rehabilitate the area. This investment would<br />
likely exceed the economic value <strong>of</strong> any recovered coal.<br />
2. The majority <strong>of</strong> the coal resource left in place is in cover greater than 1,500 ft. <strong>MSHA</strong><br />
currently will not approve pillar extraction in areas where the cover exceeds 1,500 ft.<br />
3. The amount <strong>of</strong> air necessary to keep this area ventilated is making it difficult to get<br />
ventilation to those active areas <strong>of</strong> the mine where the ventilation is required.”<br />
The referenced ventilation problems included the recurrent need to perform maintenance on<br />
stoppings in the Main West entries due to continued ground deterioration. In justification <strong>of</strong><br />
sealing the area, a BLM inspector also noted pillar failure <strong>and</strong> several large ro<strong>of</strong> falls.<br />
Sealing the Main West had ground control implications. First, the seals prevented access for<br />
evaluation <strong>of</strong> ground conditions west <strong>of</strong> crosscut 118. Further deterioration <strong>of</strong> pillars that could<br />
lead to additional stress transfer to the adjacent barriers could not be observed. Second, the seals<br />
prevented the barriers from being extracted in the manner that had been used in the South Mains.<br />
In the South Mains, barriers adjacent to worked out longwall panels were recovered using a<br />
“rooming out” technique. Barriers on either side <strong>of</strong> the South Mains were developed<br />
sequentially as illustrated in Figure 36. This method helped maintain the integrity <strong>of</strong> the barrier<br />
outby the working section since the barrier width was reduced only near the retreating pillar line.<br />
A similar plan could not be used in the sealed Main West without extensive rehabilitation to the<br />
existing Main West entries <strong>and</strong> crosscuts.<br />
64
Figure 36 – South Mains “Rooming Out” Pillar Recovery Sequence<br />
65
North Barrier Section Development<br />
In contrast to the sequential development <strong>and</strong> recovery plan used in the South Mains, four entries<br />
were driven on 80 x 92-foot centers through the Main West North Barrier prior to retreat. The<br />
original 448-foot barrier width was reduced during development to 135 feet between the section<br />
<strong>and</strong> Panel 12 to the north <strong>and</strong> to 53 feet between the section <strong>and</strong> the sealed Main West to the<br />
south (see Figure 37). One implication <strong>of</strong> this approach was that the load bearing capacity <strong>of</strong><br />
these barriers (i.e., their ability to support front <strong>and</strong> side abutment loading during pillar recovery)<br />
was reduced. Another was that entries used to access the working faces were subjected to<br />
abutment loading during development.<br />
Figure 37 - North Barrier Section Mining showing Overburden<br />
Development <strong>of</strong> the North Barrier section began in late 2006 <strong>and</strong> had advanced to crosscut 123<br />
when Agapito Associates, Inc. (AAI) personnel visited the section on December 1, 2006 (see<br />
Appendix H). Overburden depth at this location was about 1,900 feet. Based on their<br />
observations, AAI reported that “There was no indication <strong>of</strong> problematic pillar yielding or ro<strong>of</strong><br />
problems that might indicate higher-than-predicted abutment loads.”<br />
<strong>MSHA</strong> District 9 Ro<strong>of</strong> Control personnel visited the developing North Barrier section on<br />
January 9, 2007. At that time, the section had advanced to about crosscut 141, situated beneath<br />
2,000 feet <strong>of</strong> overburden, past the deepest overburden (2,240 feet) at crosscut 132. Billy Owens<br />
(District 9 ro<strong>of</strong> control group supervisor) <strong>and</strong> Peter Del Duca (inspector trainee) observed pillar<br />
hour glassing outby the face <strong>and</strong> were present during the failure <strong>of</strong> the rib in a crosscut. Owens<br />
stated that “about 200 to 300 feet out from the mining face, the --- one <strong>of</strong> the pillars sloughed,<br />
<strong>and</strong> I mean, it was almost a whole crosscut, probably 6 to 12 inches thick, the rib just set down.<br />
But it didn't throw coal out into the walkway. It didn't expel any particles that would strike<br />
anyone. It just laid down --- sloped down <strong>and</strong> laid down against the rib.” Owens stated further,<br />
“I considered that to be the pillar yielding in the controlled manner that it should.”<br />
All parties (GRI, AAI, <strong>and</strong> <strong>MSHA</strong> District 9) placed a great deal <strong>of</strong> emphasis on the nature <strong>of</strong> the<br />
observed pillar yielding during the development phase <strong>of</strong> mining (i.e., that it was nonviolent).<br />
66
For example, Laine Adair stated in an interview with the investigation team that “the main things<br />
that we were really looking at that was <strong>of</strong> most interest to Billy [Owens] <strong>and</strong> to me <strong>and</strong> to<br />
Agapito on our other visits was how the coal was yielding as these pillars yielded Was it in a<br />
nonviolent fashion” Nonviolent yielding <strong>of</strong> the coal ribs was perceived as an indication that the<br />
mine design was effective. However, a rib failure <strong>of</strong> this extent in an area where persons work or<br />
travel is not indicative <strong>of</strong> effective rib control to protect persons from related hazards.<br />
Similar ground conditions were noted after <strong>MSHA</strong>’s January 9 visit. Gary Peacock reported in a<br />
memo to Adair that “We advanced the section 14 xc's from 137 to 151 in January. Even though<br />
the amount <strong>of</strong> cover has gone from 2,200' to 1,500', we are still seeing a considerable amount <strong>of</strong><br />
rib sloughage. It does create some problems, but is no worse than we would expect to see<br />
mining in the barrier like we are.” Bounces were occurring outby the face areas resulting in rib<br />
sloughage. The resulting rib sloughage was greatest from crosscut 135 to 142 which was the<br />
area <strong>of</strong> greatest overburden. There was some minor floor heave in this region that did not require<br />
grading.<br />
Development proceeded in the North Barrier more than 4,600 feet (measured from crosscut 108)<br />
to crosscut 158. Water began flowing from the floor <strong>and</strong> ro<strong>of</strong> near crosscut 145 to 146. Section<br />
development was stopped at crosscut 158, five crosscuts short <strong>of</strong> the projected extent, due to<br />
excessive water inflow. This was the same water zone that had been encountered in the north<br />
side <strong>of</strong> Main West in 1995.<br />
North Barrier Section Pillar Recovery<br />
Pillar recovery operations were initiated in the North Barrier section on February 16, 2007. Two<br />
<strong>of</strong> the three pillars in each row were extracted while the third pillar between the Nos. 3 <strong>and</strong> 4<br />
entries was not mined to provide a bleeder entry. The section was retreated from west to east.<br />
MRS units were used in-lieu-<strong>of</strong> turn posts near the continuous mining machine during pillar<br />
mining. MRS units <strong>and</strong> wooden posts were used for breaker rows.<br />
Initially, the ro<strong>of</strong> did not cave immediately as pillars were removed, resulting in higher stress in<br />
the pillars being mined. Some miners <strong>and</strong> mine management felt that the section was too narrow<br />
to promote good caving. On February 21, 2007, after removing four rows <strong>of</strong> pillars, eight<br />
stoppings were blown out by caving within the pillared area. The next day, foremen reported<br />
that hard bounces were occurring <strong>and</strong> that caving remained close to the pillar line.<br />
BLM inspector Stephen Falk visited the section on February 27, 2007. In the associated<br />
Inspection <strong>Report</strong>, finalized on July 12, 2007, Falk noted: “So far, the crews have pulled 18<br />
pillars or 9 rows. Currently they are pulling the pillars between crosscut 149 <strong>and</strong> 150. I have<br />
been concerned about pulling pillars in this environment with mining a narrow block with little<br />
coal barriers to mined out blocks on both sides. Fortunately, the beginning depth on the west<br />
end toward the Joe's Valley Fault is somewhat shallow starting at 1300 feet. So far no<br />
inordinate pillar stresses have been noted, though things should get interesting soon. The face is<br />
under 1600 feet <strong>of</strong> cover now <strong>and</strong> will increase to over 2000 feet by crosscut 139. The working<br />
face looks ok <strong>and</strong> coal is good. There is some cap rock in the ro<strong>of</strong> that is not holding up during<br />
mining.” Foremen also reported “good bounces” occurring that day.<br />
Beginning on February 28, 2007, in the vicinity <strong>of</strong> pillar Nos. 23 <strong>and</strong> 24 at 1,880 feet <strong>of</strong><br />
overburden, foremen regularly reported problems with the immediate ro<strong>of</strong>, bounces, blown out<br />
stoppings, <strong>and</strong> associated production delays. The ro<strong>of</strong> coal <strong>and</strong> s<strong>of</strong>t rock above it broke into<br />
small pieces that fell onto the wire mesh <strong>and</strong> caused it to sag down between the ro<strong>of</strong> bolts.<br />
67
Larger stumps were left unmined in the pillars to avoid the sagging wire mesh. On March 3, a<br />
Murray Energy Corporation employee emailed a copy <strong>of</strong> Cr<strong>and</strong>all Canyon <strong>Mine</strong>’s production<br />
report for the night shift ending March 1, 2007, to Jerry Taylor (Corporate <strong>Safety</strong> Director):<br />
“Fyi…this is at least the third time they have noted walls blown out by caves on the pillar<br />
section. Must be pretty violent. You see they had to pull the [continuous mining machine] out<br />
<strong>and</strong> had stone between the [continuous mining machine] <strong>and</strong> the MRS supports.”<br />
Stoppings were blown out during both shifts on Sunday, March 4. The next day, Bruce Hill<br />
(president <strong>and</strong> CEO <strong>of</strong> UEI, ARI, <strong>and</strong> GRI) reported to Murray: “The mine should continue to<br />
perform well for the next three months as we pull pillars. The one potential obstacle remains the<br />
depth <strong>of</strong> cover. We are now approaching 2,000 feet <strong>of</strong> cover. <strong>MSHA</strong> has never allowed pillar<br />
recovery at this depth. I was in the mine on Sunday <strong>and</strong> while the pillars were bumping <strong>and</strong><br />
thundering, the conditions remain good.” Also on March 5, foremen reported “ran steady until<br />
around 3:00 PM, had a couple hard bounces that knocked top coal loose in #2.” Eight-foot bolts<br />
were installed in the affected area, delaying production for eight hours.<br />
A coal burst occurred during the night shift beginning March 6 <strong>and</strong> ending March 7, 2007. A<br />
lump <strong>of</strong> coal ejected during the burst struck a miner in the face. An entry in the shift foremen’s<br />
report noted, “Bouncing real hard on occasion. Smacked little Carlos [Payan] up aside <strong>of</strong> the<br />
haid [sic] with a pretty good chunk.” Payan received a small cut on the side <strong>of</strong> his head, which<br />
required first aid treatment only, <strong>and</strong> he continued working in his normal duties.<br />
A non-injury coal outburst accident during the following day shift on March 7 knocked miners<br />
down <strong>and</strong> damaged a stopping. The shift foreman’s report described the event as: “Had 1 real<br />
hard bounce, blowed ribs down in 2-3 crosscut & beltline…” The production report showed a<br />
delay in mining <strong>of</strong> 70 minutes after the event. <strong>MSHA</strong> was not immediately notified <strong>of</strong> the March<br />
7 coal outburst accident as required by 30 CFR 50.10. GRI did not file an accident report with<br />
<strong>MSHA</strong> as required by 30 CFR 50.20.<br />
On March 8, a coal burst tripped a breaker on an MRS unit, requiring the crew to set timbers<br />
prior to resetting the breaker. This event caused a 30-minute production delay.<br />
On March 9, 2007, in an attempt to alleviate the poor ground conditions, GRI stopped pillar<br />
recovery between crosscuts 137 <strong>and</strong> 138 <strong>and</strong> resumed mining between crosscuts 134 <strong>and</strong> 135.<br />
However, the following morning, foremen reported that the section was “still bouncing pretty<br />
hard.” Hill also reported to Murray: “The mine is experiencing heavy bouncing <strong>and</strong> rib<br />
sloughage. We moved the section back two crosscuts to provide a barrier.” Although Hill<br />
characterized the decision to skip several rows as providing “a barrier,” the move was not made<br />
in consideration <strong>of</strong> specific concerns about abutment stress. Peacock made the decision to “get<br />
to where we hadn’t left any <strong>of</strong> the top coal <strong>and</strong> where the initial ro<strong>of</strong> was good.” Mining<br />
resumed in an area <strong>of</strong> greater overburden.<br />
The concept <strong>of</strong> skipping pillar rows was consistent with AAI’s recommendations at that time. In<br />
an August 9, 2006, email report to Adair from Leo Gilbride (AAI principal) the report stated:<br />
“The plan affords the contingency to leave occasional pillars for protection during retreat if<br />
conditions warrant, thus providing additional control <strong>of</strong> the geotechnical risk” (refer to<br />
Appendix G). AAI cautioned against this practice after the March 2007 outburst accidents.<br />
68
March 10, 2007, Coal Outburst<br />
At 5:22 p.m. on March 10, 2007, a non-injury coal outburst accident occurred on the working<br />
section while mining the first cut <strong>of</strong> the southernmost pillar from the No. 1 entry between<br />
crosscuts 133 <strong>and</strong> 134. The associated seismic event registered magnitude 2.3. The outburst<br />
threw coal into entries <strong>and</strong> crosscuts between 131 <strong>and</strong> 139 <strong>and</strong> suspended dust in the air for 5 to<br />
10 minutes, obstructing vision. Most <strong>of</strong> the damage was in the Nos. 3 <strong>and</strong> 4 entries <strong>and</strong> rendered<br />
the bleeder entry unsafe for travel. Coal expelled from the ribs was up to four feet deep in some<br />
entries <strong>and</strong> crosscuts. A scoop was blocked by coal debris in the No. 3 entry between crosscuts<br />
133 <strong>and</strong> 134.<br />
During the following shift, crew members cleaned coal from the entries <strong>and</strong> crosscuts with the<br />
continuous mining machine. They also set timbers, retrieved the scoop, <strong>and</strong> repaired stoppings.<br />
Peacock was notified <strong>of</strong> the burst at approximately 10:00 p.m. <strong>and</strong> he traveled to the mine later<br />
that night to observe conditions on the section. On March 11, Peacock noted in an email to<br />
Adair <strong>and</strong> Hill that “conditions in the pillar section have deteriorated to the point that I don’t<br />
think it is safe to mine in there any longer. We are pulling the equipment out <strong>and</strong> setting up to<br />
mine south. The bad conditions consist <strong>of</strong> some huge bounces <strong>and</strong> the stopping line is no longer<br />
intact back in the bleeder entry. It is not safe to have people in there repairing the stoppings. I<br />
talked to Dave Hibbs this morning, he is looking into the possibility <strong>of</strong> not needing a new <strong>MSHA</strong><br />
plan to mine south until we go past the seals. I realize pulling out early could change the way<br />
<strong>MSHA</strong> views the plan on the south side. I also realize we have used all the tricks we know <strong>of</strong> to<br />
pull these pillars <strong>and</strong> I no longer feel comfortable we can do it without unacceptable risk.”<br />
Mining was temporarily moved to the 3 rd North spare section while the South Barrier section was<br />
prepared for mining.<br />
<strong>MSHA</strong> was not immediately notified <strong>of</strong> the March 10 coal outburst accident as required by<br />
30 CFR 50.10. Later, on March 12, GRI contacted <strong>MSHA</strong> District 9 personnel by telephone. In<br />
a documented call to Owens, Adair indicated that the section was pulling out due to damage to<br />
the bleeder entry. Later that day, GRI left a phone message with William Reitze (District 9<br />
ventilation group supervisor) stating that it was not safe to travel to the approved bleeder<br />
measurement point location (MPL) due to a bounce but that there were no plans to immediately<br />
seal the area. On March 13, GRI contacted Reitze by telephone <strong>and</strong> requested to replace<br />
damaged permanent ventilation controls adjacent to the bleeder entry with curtains. Reitze<br />
denied the request. GRI then proposed a possible relocation <strong>of</strong> the MPL. When this request was<br />
also denied (because ventilation <strong>of</strong> the worked out area could not be adequately evaluated from<br />
the proposed location), the mine operator requested approval to seal the area. During a regular<br />
inspection, R<strong>and</strong>y Gunderson (<strong>MSHA</strong> coal mine inspector) was informed by GRI that mining<br />
had ceased because “the country got rough.” He did not travel to the damaged area. These<br />
communications with <strong>MSHA</strong> minimized the extent <strong>of</strong> the adverse conditions <strong>and</strong> failed to<br />
accurately portray the degree <strong>of</strong> the damage.<br />
Records indicate BLM personnel were also notified <strong>of</strong> the March 10 event on March 12. As<br />
noted earlier, some <strong>of</strong> the Cr<strong>and</strong>all Canyon coal reserves were leased from the Federal<br />
government <strong>and</strong> managed by BLM. BLM has a m<strong>and</strong>ate to manage these coal resources to<br />
maximize economic recovery whenever possible. GRI had to obtain BLM’s approval to leave<br />
behind coal that would otherwise be mined.<br />
BLM inspector Stephen Falk visited the North Barrier section on March 15. He noted damage<br />
on a map filed with his inspection report. He verbally approved GRI’s request to cease mining in<br />
the North Barrier, to seal the area at crosscut 118, <strong>and</strong> to mine the one entry <strong>of</strong> the Main West<br />
69
South Barrier on the BLM coal lease. A written approval from BLM to GRI dated August 27,<br />
2007, confirmed the verbal approval. The written approval indicated that GRI reported adverse<br />
ground conditions with damaging bounces as justification to BLM for leaving the rest <strong>of</strong> the<br />
pillars in the North Barrier section.<br />
At the request <strong>of</strong> Adair, AAI personnel observed conditions in the section on March 16, 2007.<br />
The site visit was documented by photographs <strong>and</strong> a map showing pillar, entry, <strong>and</strong> crosscut<br />
conditions from crosscut 131 to 145. Figure 38 <strong>and</strong> Figure 39 illustrate a damaged stopping <strong>and</strong><br />
conditions in the No. 4 entry from a collection <strong>of</strong> photos taken on March 16, 2007 (see Appendix<br />
O to view additional pictures). AAI’s notes <strong>and</strong> photographs confirmed Falk’s representation <strong>of</strong><br />
conditions on the section in his report. The North Barrier section was sealed on March 27, 2007.<br />
Figure 38 – Stopping Damaged during March 2007 Coal Outburst Accident on North Barrier Section<br />
Figure 39 –Damage in No. 4 Entry after the March 2007 Coal Outburst Accident on North Barrier Section<br />
70
GRI contracted AAI to refine the pillar design for the South Barrier section based on the<br />
conditions encountered during the mining <strong>of</strong> the North Barrier section. AAI evaluated ground<br />
conditions resulting from the coal outburst accident, analyzed the proposed South Barrier<br />
mining, <strong>and</strong> made recommendations for mining the Main West South Barrier (see Appendix I).<br />
South Barrier Section Development<br />
In an effort to mitigate the potential for a failure similar to the one that occurred in the North<br />
Barrier section, two changes were implemented during development <strong>of</strong> the South Barrier section<br />
<strong>and</strong> a third was implemented during pillar recovery:<br />
• entries were mined to the rock in the ro<strong>of</strong> (as opposed to leaving ro<strong>of</strong> coal),<br />
• crosscut spacing was increased from 92 to 130 feet, <strong>and</strong><br />
• the width <strong>of</strong> the caved area was increased by slabbing the barrier between the No. 1 entry<br />
<strong>and</strong> the adjacent longwall Panel 13.<br />
After the March 10, 2007, coal outburst accident, AAI made recommendations for mining in the<br />
South Barrier that included a precaution that “Skipping pillars should be avoided in the south<br />
barrier, particularly under the deepest cover.” Bagging <strong>of</strong> ro<strong>of</strong> coal had contributed to the<br />
operator’s decision to skip pillars in the North Barrier section. By mining to the rock, the<br />
operator effectively eliminated the potential for a recurrence <strong>of</strong> this type <strong>of</strong> ro<strong>of</strong> control problem<br />
<strong>and</strong> the resulting need to skip pillars.<br />
In the South Barrier section, pillar length was increased by 38 feet (from 92 to 130-foot centerto-center<br />
– see Figure 40). AAI indicated that this change “increases the size <strong>and</strong> strength <strong>of</strong> the<br />
pillars’ confined cores, which helps to isolate bumps to the face <strong>and</strong> reduce the risk <strong>of</strong> larger<br />
bumps overrunning crews in outby locations.”<br />
Figure 40 - South Barrier Section Mining showing Overburden<br />
Development <strong>of</strong> the South Barrier section began on March 28, 2007. By late April 2007, four<br />
entries were being driven on 80 x 130-foot centers from crosscut 118 through the length <strong>of</strong> the<br />
Main West South Barrier. The original 438-foot barrier width was reduced during development<br />
to 121 feet between the section <strong>and</strong> Panel 13 to the south <strong>and</strong> to 55 feet between the section <strong>and</strong><br />
the Main West No. 1 entry room notches to the north. A sump had been mined southward from<br />
71
the Main West No. 1 entry at crosscut 150. The South Barrier section No. 4 entry was not mined<br />
through between crosscuts 140 <strong>and</strong> 141 to ensure that a minimum 50-foot barrier remained<br />
between the section <strong>and</strong> the sump. The entries <strong>and</strong> crosscuts were mined eight feet high <strong>and</strong><br />
18 feet wide. No coal was being left against the ro<strong>of</strong>. Loose rock was also being mined from the<br />
ro<strong>of</strong>. Coal was left in the floor where coal seam thickness exceeded 8 feet. The section was<br />
typically dry with one wet area at crosscut 140.<br />
During development mining, ro<strong>of</strong> <strong>and</strong> rib conditions were better than in the North Barrier. <strong>Mine</strong><br />
management attributed the improvement to the larger pillars. Owens <strong>and</strong> Jensen visited the<br />
section on May 22, 2007. Owens determined that pillars were yielding closer to the face (which<br />
he interpreted as being favorable) <strong>and</strong> that pillars outby appeared to be more stable than in the<br />
North Barrier. Despite these improvements, reports indicated that bounces occurred <strong>and</strong> the ribs<br />
showed significant signs <strong>of</strong> hour glassing <strong>and</strong> sloughage. The South Barrier section was mined<br />
to crosscut 149, its projected limit, with development completed on July 15, 2007.<br />
South Barrier Section Pillar Recovery<br />
Pillar recovery began in the South Barrier section on July 15, 2007. The section was retreated<br />
from west to east. Pillars between the No. 1 <strong>and</strong> 3 entries were extracted <strong>and</strong> the barrier to the<br />
south was slabbed to a depth up to 40 feet. Pillars between No. 3 <strong>and</strong> 4 entries on the north side<br />
<strong>of</strong> the section were not mined. These pillars remained in place to protect the No. 4 entry which<br />
served as a bleeder. MRS units were used during pillar recovery <strong>and</strong> bottom mining was taking<br />
place in pillar cuts <strong>and</strong> in barrier cuts (slabbing) south <strong>of</strong> the No. 1 entry. Barrier slabbing was<br />
intended to facilitate better caving inby the pillar line by creating a wider span. Better caving, in<br />
turn, was intended to reduce abutment stress transferred to the pillar line.<br />
Grosely was conducting an inspection in the South Barrier section on July 17 <strong>and</strong> 18, 2007.<br />
Removal <strong>of</strong> the first pillar was taking place during his inspection. He did not hear any bounces<br />
<strong>and</strong> the pillars on the section looked stable. He observed some floor heave in the belt entry.<br />
This was the last time <strong>MSHA</strong> was on the section before the August 6 accident.<br />
The cut sequence when mining a row <strong>of</strong> pillars is shown in Figure 41. Half <strong>of</strong> the No. 1 pillar<br />
<strong>and</strong> the barrier to the south were mined simultaneously, right <strong>and</strong> left, from the No. 1 entry<br />
(Sequence A). The remainder <strong>of</strong> the No. 1 pillar <strong>and</strong> the No. 2 pillar were then mined as they<br />
had been in the North Barrier section (Sequences B, C, D, E, F, <strong>and</strong> G).<br />
Figure 41 - South Barrier Section Pillar Recovery Cut Sequence<br />
72
During pillar recovery, eight pillars <strong>and</strong> the barrier between crosscuts 139 <strong>and</strong> 142 (where the<br />
South Barrier section was reduced to three entries) were designated to remain unmined. This<br />
unmined area was intended to protect the bleeder entry from abutment stresses associated with<br />
the eventual caved areas to the west <strong>and</strong> east.<br />
The first large intentional cave within the pillared area <strong>of</strong> the South Barrier section occurred<br />
July 21, 2007, after recovery <strong>of</strong> two rows <strong>of</strong> pillars. The caving ro<strong>of</strong> caused an air blast that<br />
blew out five stoppings, <strong>and</strong> delayed production for nearly three hours. As the South Barrier<br />
section retreated toward deeper overburden, rib failures <strong>and</strong> floor heave became more frequent.<br />
On July 30, 2007, a bounce occurred at the working face, which broke a torque shaft on the<br />
continuous mining machine. Two days later, an intentional cave inby the pillar line damaged<br />
stoppings <strong>and</strong> disrupted production for approximately two hours.<br />
On August 3, 2007, at 4:39 a.m., a non-injury coal outburst accident occurred at the face as the<br />
night shift crew mined the first cut to the north <strong>of</strong> No. 2 entry from the pillar between crosscuts<br />
142 <strong>and</strong> 143. Coal was thrown into the entries along the entire length <strong>of</strong> the pillar, dislodging<br />
timbers <strong>and</strong> burying the continuous mining machine cable. The continuous mining machine<br />
operator was struck by coal. He was not injured, but the lower half <strong>of</strong> his body was covered with<br />
material. A stopping was damaged <strong>and</strong> a separation was observed between the mine ro<strong>of</strong> <strong>and</strong> the<br />
damaged pillar. The crew retrieved the continuous mining machine, removed debris, <strong>and</strong><br />
replaced some <strong>of</strong> the dislodged timbers before leaving the section at 6:00 a.m. When the day<br />
shift crew arrived on the section at 8:35 a.m., they repaired the damaged stopping <strong>and</strong> finished<br />
cleaning roadways <strong>and</strong> resetting timbers in the No. 2 entry. The accident was not immediately<br />
reported to <strong>MSHA</strong> as required.<br />
Coal production resumed at 10:35 a.m., as the day shift crew mined the remaining cuts from<br />
either side <strong>of</strong> the No. 2 entry inby crosscut 142. Adverse ground conditions in the No. 3 entry<br />
prevented mining the north half <strong>of</strong> the damaged pillar (cut F <strong>and</strong> G as shown on Figure 41).<br />
Crew members (including the section foreman) discussed the possibility that management would<br />
decide to pull out <strong>of</strong> the South Barrier section due to similarities between the outburst accident<br />
that morning <strong>and</strong> the events in the North Barrier. The section was visited by mine management,<br />
who discussed the conditions with the section foreman. After this discussion, the section<br />
foreman informed the crew that they were to begin mining the barrier <strong>and</strong> skip some pillar rows.<br />
The crew moved the continuous mining machine outby crosscut 142 in the No. 1 entry <strong>and</strong><br />
mined a lift from the barrier pillar. Six cuts were mined from the barrier during the night shift,<br />
retreating to near crosscut 141. Mining in the barrier between crosscuts 139 <strong>and</strong> 142 was<br />
prohibited by the approved ro<strong>of</strong> control plan.<br />
On August 4, 2007, the day shift crew moved the section loading point <strong>and</strong> power center outby<br />
to crosscut 138. They also moved the section equipment. The floor had heaved, making the<br />
move difficult. The night shift crew routed two MRS unit cables through the No. 1 entry to<br />
continue mining in the barrier pillar before leaving the section at 5:30 a.m.<br />
On August 4, 2007, Gary Peacock emailed agenda information to Bruce Hill <strong>and</strong> Laine Adair for<br />
a management meeting scheduled for August 7, 2007. He described conditions in the South<br />
Barrier section: “The conditions have been very good, we are getting a lot <strong>of</strong> good floor coal <strong>and</strong><br />
85%+ <strong>of</strong> recovery on the pillars. The cave is good <strong>and</strong> high <strong>and</strong> staying right with us for the<br />
most part.” In anticipation <strong>of</strong> the August 7 pillar line location, he also wrote: “We just started<br />
on the row outby the area where the 3 rows were left, this week will be critical to get the<br />
maximum out <strong>of</strong> each pillar to start a good cave without having the weight go over the top <strong>of</strong><br />
73
us.” Although Peacock characterized conditions as very good, numerous bounces <strong>and</strong> a noninjury<br />
coal outburst accident had occurred as the pillar line approached crosscut 142.<br />
At 7:30 a.m. on August 5, 2007, the day shift crew arrived on the section. Before mining, they<br />
graded floor heave to provide clearance for shuttle cars from the loading point at crosscut 138 in<br />
the No. 2 entry to the face in the No. 1 entry. At 11:25 a.m., the crew started mining cuts from<br />
the barrier pillar between crosscuts 140 <strong>and</strong> 141. Production was interrupted from 2:25 p.m. to<br />
3:25 p.m. by an electrical power outage during a lighting storm, after which mining continued<br />
until the end <strong>of</strong> the shift. The night shift crew arrived on the section at 6:25 p.m. <strong>and</strong> relieved the<br />
day shift crew, which had mined a total <strong>of</strong> four cuts from the barrier pillar. The night shift<br />
continued mining the barrier until the time <strong>of</strong> the August 6 accident, as detailed in the August 6<br />
Accident Description section <strong>of</strong> this report. Analysis <strong>of</strong> conveyor belt scale data <strong>and</strong> information<br />
obtained from miners who were on the section shortly before the accident indicated that the night<br />
shift crew was mining in the barrier pillar near crosscut 139 at the time <strong>of</strong> the August 6 accident.<br />
Summary – Main West Ground Control History<br />
Ground conditions encountered historically in the Main West demonstrate that the mine design<br />
was insufficient for pillar recovery in deep overburden. Main West workings were affected by<br />
abutment stress as adjacent longwall panels were extracted <strong>and</strong> these workings deteriorated over<br />
time. Subsequent development mining in the barriers on either side <strong>of</strong> Main West encountered<br />
high stress levels, particularly under the deepest overburden. During pillar recovery in both the<br />
North <strong>and</strong> South Barrier sections, increased stress levels contributed to increasingly difficult<br />
ground conditions that culminated in coal outburst accidents.<br />
Historical ground conditions in Main West also provide a basis for engineering back-analyses <strong>of</strong><br />
strata behavior. As indicated earlier, back-analysis is a process in which known failures or<br />
successes are evaluated to determine the relationship <strong>of</strong> engineering parameters to outcomes.<br />
Longwall abutment stress transfer was observed in the Main West more than 450 feet away from<br />
the mined-out panels. Of particular significance for stability analysis is the mining scenario<br />
associated with the March 10 non-injury coal outburst accident in the North Barrier section. This<br />
event demonstrated that 60-foot wide coal pillars at the Cr<strong>and</strong>all Canyon <strong>Mine</strong> were prone to<br />
bursting under high stress attributed to deep cover <strong>and</strong> abutment stress.<br />
Analysis <strong>of</strong> Collapse<br />
<strong>Mine</strong> design is somewhat unique in comparison to other engineering structural design projects.<br />
In other disciplines, designers choose among a variety <strong>of</strong> materials with different mechanical or<br />
aesthetic properties. Often the materials are man-made (e.g., steel or concrete) with precisely<br />
controlled properties <strong>and</strong> known behavior. In contrast, mine design is limited by the properties<br />
<strong>of</strong> the coal or ore that is extracted <strong>and</strong> the host rock surrounding it. Usually, these geologic<br />
materials contain weaknesses (e.g., bedding planes or joints) <strong>and</strong> other inherent variations that<br />
complicate design because properties (<strong>and</strong> <strong>of</strong>ten applied loads) cannot be precisely determined or<br />
controlled. As a result, most if not all engineering analyses <strong>of</strong> geologic structures incorporate<br />
various generalizations, simplifications, <strong>and</strong> assumptions. Furthermore, uncertainties in material<br />
properties <strong>and</strong> applied loads necessitate designs that err on the side <strong>of</strong> safety.<br />
A variety <strong>of</strong> analyses are available to assess ground stability in mine design. The basis for the<br />
analyses can be empirical (e.g., based on statistical treatment <strong>of</strong> case histories), analytical (i.e.,<br />
based on fundamental principles <strong>of</strong> mathematics <strong>and</strong>/or mechanics), or numerical (i.e., based on<br />
an iterative mathematic process to find an approximate solution controlled by a complex<br />
interaction <strong>of</strong> variables). Various analyses rely on different input parameters or different<br />
74
epresentations <strong>of</strong> the same parameter. For example, pillar stability analyses may rely on<br />
empirically derived coal strengths or they may be determined from laboratory tests or minespecific<br />
back-analysis. Despite these differences, when used properly, each analysis can provide<br />
valid <strong>and</strong> valuable insight to mine design.<br />
As part <strong>of</strong> the Cr<strong>and</strong>all Canyon <strong>Mine</strong> accident investigation, three approaches <strong>and</strong> computer<br />
programs were used to evaluate ground behavior in general <strong>and</strong> pillar response in particular:<br />
• Analysis <strong>of</strong> Retreat Mining Pillar Stability (ARMPS 15 ) calculations,<br />
• Finite Element Method (UT2 4 ) modeling, <strong>and</strong><br />
• Boundary Element Method (LaModel 5 ) modeling.<br />
In these analyses, the pillar dimensions <strong>and</strong> extraction widths were determined from mine maps.<br />
The overburden was determined by translating <strong>and</strong> rotating the USGS topographic map into the<br />
mine area based on state plane coordinates <strong>and</strong> corresponding mine local coordinates. The<br />
USGS topographic contours were digitized <strong>and</strong> then used with the digital mine top-<strong>of</strong>-coal<br />
contours to calculate the overburden for the mine area. The resulting overburden map was<br />
similar to the overburden contours on the Cr<strong>and</strong>all Canyon <strong>Mine</strong> map. However, the map<br />
generated for the investigation contained more overburden contour detail.<br />
The following sections provide detailed discussions <strong>of</strong> each analysis. It is important to note that<br />
input values (e.g., coal strength) vary between methods but each is valid for the type <strong>of</strong> analysis<br />
in which it is used. Similarly, thresholds used to interpret safety or stability factors are not<br />
directly comparable between methods. Although the three approaches differ substantially from<br />
one another, all three indicate that a widespread catastrophic pillar failure was central to the<br />
events at the Cr<strong>and</strong>all Canyon <strong>Mine</strong>. ARMPS analyses revealed that stability factors (relative<br />
measures <strong>of</strong> stability) were below NIOSH’s recommended minimums <strong>and</strong> also below the mine’s<br />
historical experience. Finite element analyses indicated strong potential for a rapid catastrophic<br />
failure <strong>of</strong> the North <strong>and</strong> South Barrier sections <strong>and</strong> the Main West pillars between them.<br />
Similarly, boundary element analyses confirmed that the Main West was vulnerable to widespread<br />
failure; these results also provided insight to the factors that contributed to the overall<br />
collapse <strong>and</strong> potential means <strong>of</strong> triggering the event.<br />
<strong>Safety</strong>/Stability Factors<br />
Engineering analyses <strong>of</strong>ten evaluate the reliability <strong>of</strong> a design by calculating a factor that relates<br />
the strength <strong>of</strong> a design to its loading condition. The three programs used in this investigation<br />
(ARMPS, UT2, <strong>and</strong> LaModel) use different methods to calculate a measure <strong>of</strong> stability.<br />
Consequently, values or criteria from one type <strong>of</strong> analysis must not be related or compared<br />
directly to values from another type <strong>of</strong> analysis.<br />
ARMPS. The ARMPS program calculates a stability factor (StF) which has the following<br />
relationship:<br />
StF =<br />
Pillar Load Bearing Capacity from the Mark Bienawski Equation<br />
Pillar Load from geometric configuration <strong>and</strong> field data<br />
In the literature, the ARMPS stability factor is expressed with the term: “SF.” To avoid<br />
confusion with the factors calculated in UT2 <strong>and</strong> LaModel, ARMPS stability factor in this report<br />
is designated as “StF.” Based on a mining database <strong>of</strong> successful <strong>and</strong> unsuccessful case<br />
histories, recommended StF design criteria were developed. ARMPS design criteria are<br />
75
empirically derived <strong>and</strong> should not be used with factors derived from UT2 <strong>and</strong> LaModel which<br />
have a different calculation basis.<br />
UT2. In the UT2 analyses, a safety factor (SF) from material modeled as linear elastic can be<br />
determined by the following relationship:<br />
Strength Load Carrying Capability at Elastic Limit<br />
SF = or<br />
Stress<br />
Applied Load<br />
The SF values in the UT2 analysis follow the typical engineering safety factor relationship where<br />
material strength is divided by applied stress.<br />
LaModel. In the LaModel analysis a safety factor (SF) from material modeled as strains<strong>of</strong>tening<br />
or elastic-plastic can be determined for a particular element by the following<br />
relationship:<br />
Peak Strain<br />
SF =<br />
Applied Strain<br />
The LaModel SF is a strain-based (deformation-based) safety factor. Traditionally, safety factors<br />
are calculated on a stress basis. For LaModel analyses using nonlinear materials, strain-based<br />
safety factors are more appropriate.<br />
Analysis <strong>of</strong> Retreat Mining Pillar Stability (ARMPS)<br />
Pillar stability was evaluated using the ARMPS program developed by Christopher Mark <strong>and</strong><br />
others at the National Institute for Occupational <strong>Safety</strong> <strong>and</strong> <strong>Health</strong> (NIOSH) Pittsburgh Research<br />
Laboratory (a former US Bureau <strong>of</strong> <strong>Mine</strong>s research center). This program is considered an<br />
empirical approach because it is based on a statistical analysis <strong>of</strong> case histories. More than 250<br />
case histories (including successful <strong>and</strong> unsuccessful experiences) have been documented <strong>and</strong><br />
used to develop the ARMPS database <strong>of</strong> stability factors (StF). StF’s are similar to safety factors<br />
(SF) in that they are calculated as the ratio <strong>of</strong> strength to stress (or load carrying capacity to<br />
applied load). StF’s in ARMPS, however, are computed specifically for pillars using two basic<br />
assumptions. First, pillar strength is computed using an empirical pillar strength formula (the<br />
Mark-Bieniawski equation). Second, pillar load is estimated using geometric relationships <strong>and</strong><br />
stress distribution criteria developed from field data.<br />
ARMPS can be used to provide a first approximation <strong>of</strong> the pillar sizes required to<br />
prevent pillar failure during retreat mining. It also provides a framework for evaluating<br />
the relative stability <strong>of</strong> workings in an operating mine. For example, ARMPS stability<br />
factors can be calculated for both successful <strong>and</strong> unsuccessful areas at a given mine site.<br />
This approach, referred to as “back-analysis,” can be used to establish a minimum StF<br />
that has been shown to provide adequate ground conditions. This minimum then can be<br />
used as a threshold for design in subsequent areas as changes occur in the depth <strong>of</strong> cover,<br />
coal mining height, or pillar layout.<br />
Site-specific criteria used in lieu <strong>of</strong> NIOSH’s recommendations should be developed<br />
cautiously using multiple case histories with known conditions at a given mine. Backanalysis<br />
is most appropriate for mines that have a proven track record <strong>of</strong> retreat mining.<br />
In these cases, proper examinations <strong>of</strong> individual mine data may demonstrate that<br />
stability factors above or below NIOSH’s recommended values are warranted. Proper<br />
76
examination would entail an analysis <strong>of</strong> the broad experience at a mine site rather than a<br />
focus on isolated case(s) that represent the extreme.<br />
The ARMPS s<strong>of</strong>tware calculates stability factors using 15 user-provided input parameters:<br />
1. Entry Height 9. Barrier Pillar Width<br />
2. Entry Width 10. Depth <strong>of</strong> a slab cut<br />
3. Number <strong>of</strong> Entries 11. Loading Condition<br />
4. Entry Spacings 12. In Situ Coal Strength<br />
5. Crosscut Spacing 13. Unit Weight <strong>of</strong> the Overburden<br />
6. Crosscut Angle 14. Breadth <strong>of</strong> the Active Mining Zone (AMZ)<br />
7. Depth <strong>of</strong> Cover 15. Abutment Angle<br />
8. Extent <strong>of</strong> Active Gob<br />
Parameters 1 to 10 are dimensions <strong>of</strong> individual mine openings <strong>and</strong> the overall mining section<br />
that must be established by the user (see Figure 42). Item 11 is associated with the sequence in<br />
which panels <strong>of</strong> pillars are recovered <strong>and</strong> is defined in the ARMPS help files. Parameters 12 <strong>and</strong><br />
13 are properties <strong>of</strong> the coal seam <strong>and</strong> rock comprising the overburden; defaults values are<br />
provided in the s<strong>of</strong>tware <strong>and</strong> should be used if the user plans to utilize NIOSH recommended<br />
StF’s. The last two parameters are program specific values that establish the geometry used to<br />
estimate abutment loading <strong>of</strong> pillars. Again, defaults values are provided in the s<strong>of</strong>tware <strong>and</strong><br />
should be used if the user plans to utilize NIOSH recommended StF’s.<br />
Input parameters for each <strong>of</strong> the case histories in the NIOSH database were used to compute<br />
StF’s for both successful <strong>and</strong> unsuccessful cases. The unsuccessful cases included pillar<br />
squeezes, massive pillar collapses (usually accompanied by air blasts) <strong>and</strong> coal bursts.<br />
According to NIOSH, pillar squeezes account for approximately two-thirds <strong>of</strong> the failures in the<br />
database. In addition, there were 14 sudden collapses <strong>and</strong> 17 bursts.<br />
Figure 42 - Illustration <strong>of</strong> ARMPS Input Related to Panel Geometry<br />
(after Chase et al. 15 )<br />
77
ARMPS StF’s, depth <strong>of</strong> cover, <strong>and</strong> outcomes (successful or unsuccessful) comprising the<br />
NIOSH database are illustrated in Figure 43. At depths below 650 feet, NIOSH noted that 88%<br />
<strong>of</strong> the failures occurred when the ARMPS stability factor was less than 1.5. In contrast, the<br />
ARMPS stability factor was greater than 1.5 in 78% <strong>of</strong> the successes. 6 They concluded that an<br />
ARMPS StF <strong>of</strong> 1.5 or greater is appropriate at these depths. At depths greater than 650 feet,<br />
Chase et al. (2002) 7 noted that StF's less than 1.5 can be employed successfully. The solid line<br />
drawn across Figure 43 represents minimum StF’s recommended by NIOSH for various depths<br />
<strong>of</strong> overburden. However, NIOSH’s analyses also noted that the use <strong>of</strong> large barrier pillars at<br />
depths greater than 1,000 feet substantially increased the likelihood <strong>of</strong> success. NIOSH<br />
incorporated this factor into their recommendations.<br />
Figure 43 - ARMPS Case History Data Base (Chase et al. 7 )<br />
In addition to calculating StF’s for “production” pillars that are recovered (PStF), ARMPS also<br />
determines stability factors for barrier pillars (BPStF) that separate pillar recovery sections from<br />
adjacent pillared workings (see Figure 42). Only one failure (out <strong>of</strong> 12 cases) in the NIOSH<br />
deep cover database occurred when the PStF was greater than 0.8 <strong>and</strong> the BPStF was greater<br />
than 2.0. Conversely, 30 case histories had a PStF less than 0.8 <strong>and</strong> a BPStF less than 2.0 <strong>and</strong><br />
60% <strong>of</strong> these cases were failed designs. Based on these data, NIOSH recommended the criteria<br />
shown in Table 4:<br />
ARMPS<br />
Stability Factor<br />
Pillar (PStF)<br />
Barrier Pillar<br />
(BPStF)<br />
Table 4 - NIOSH Pillar Design Considerations<br />
Overburden (H)<br />
Weak <strong>and</strong><br />
Intermediate Ro<strong>of</strong><br />
Strong Ro<strong>of</strong><br />
Strength<br />
650’ ≤ H ≤ 1,250’ 1.5 – (H- 650) / 1,000 1.4 – (H-650) / 1,000<br />
1,250’ ≤ H ≤ 2,000’ 0.9 0.8<br />
H › 1,000’ ≥ 2.0 ≥ 1.5 (Non-bump prone ground)<br />
≥ 2.0 (Bump prone ground)<br />
(see Appendix Y for definition <strong>of</strong> bump prone ground)<br />
78
The ARMPS stability factor for a given mining configuration represents the average value for<br />
pillars in an area near the pillar line, the active mining zone (AMZ – see Figure 42), rather than<br />
for individual pillars. NIOSH explains the rationale in a Help file in the ARMPS s<strong>of</strong>tware:<br />
ARMPS calculates the Stability Factor for the entire AMZ, rather than<br />
stability factors for individual pillars, because experience has shown that<br />
the pillars within the AMZ typically behave as a system. If an individual<br />
pillar is overloaded, it will normally transfer its excess load to adjacent<br />
pillars. If those pillars are adequately sized, the process ends there.<br />
With regard to barrier pillar stability (BPStF), the program calculates stability factors for barrier<br />
pillars on either side <strong>of</strong> the pillar line. Furthermore, since barrier dimensions can change due to<br />
barrier slabbing (see Figure 42), the program provides BPStF’s for locations outby (BPStF) <strong>and</strong><br />
inby the pillar line (remnant BPStF).<br />
Pillar Recovery Analyses at Cr<strong>and</strong>all Canyon <strong>Mine</strong>. Pillar recovery operations at Cr<strong>and</strong>all<br />
Canyon <strong>Mine</strong> were back-analyzed for the accident investigation using ARMPS. It is not possible<br />
to characterize the effectiveness <strong>of</strong> these operations in every instance (i.e., the conditions<br />
encountered during panel development <strong>and</strong> extraction are not fully known). Nonetheless,<br />
ARMPS stability factors for pillars <strong>and</strong> barriers provide a relative measure <strong>of</strong> the designs used in<br />
various areas <strong>of</strong> the mine. Back-analyses were performed in four pillar recovery areas: 1 st North<br />
Left block panels (continuous haulage panels between 1 st North <strong>and</strong> 1 st Right), the South Mains,<br />
the North Barrier section, <strong>and</strong> the South Barrier section. These analyses were conducted at<br />
specific locations <strong>of</strong> interest within each area (e.g. under high overburden or locations with<br />
known ground conditions).<br />
For each ARMPS analysis, input values related to mining geometry (e.g. number <strong>of</strong> entries, pillar<br />
dimensions, or overburden) were determined from mine maps. An 8-foot mining height <strong>and</strong><br />
20-foot entry width was assumed in all cases. Similarly, ARMPS default values for coal strength<br />
(900 psi), unit weight <strong>of</strong> overburden (162 lb/ft 3 ), abutment angle <strong>of</strong> gob (21º), <strong>and</strong> extent <strong>of</strong> the<br />
active mining zone were used in all cases.<br />
The use <strong>of</strong> default values in the analyses allows the output to be compared directly with stability<br />
factors in the NIOSH database where the default values also were employed. 7 This approach<br />
provides a relative comparison <strong>of</strong> mining scenarios at Cr<strong>and</strong>all Canyon <strong>Mine</strong> <strong>and</strong> direct<br />
consideration <strong>of</strong> NIOSH’s minimum recommended stability factors.<br />
1 st North Left Block Panels Pillar Recovery. In early 1992, continuous haulage panel<br />
development began to the west <strong>of</strong> the 1 st North main entries. Nine panels were developed <strong>and</strong><br />
extracted in sequence from north to south (see Appendix D). The continuous haulage panels<br />
were developed in a 5-entry configuration with 60º angle crosscuts. The typical panel was<br />
driven with five entries on 74-, 56-, 82- <strong>and</strong> 82-foot centers (spacing measured perpendicular to<br />
the center belt entry) <strong>and</strong> crosscuts on 80-foot centers. Multiple mining units were used <strong>and</strong>, as a<br />
result, development <strong>and</strong> extraction <strong>of</strong> a panel to the south lagged slightly behind the development<br />
<strong>and</strong> extraction <strong>of</strong> a panel positioned to the north.<br />
Overburden increased from east to west in the 1 st North panels <strong>and</strong> approached 1,800 feet near<br />
1 st Right. ARMPS analyses were done for four panels, 6 th to 9 th Left, under the deeper cover<br />
(Figure 44). Results <strong>of</strong> the ARMPS analyses are included in Table 5.<br />
79
Figure 44 - 1st North Mains Left Panel ARMPS Calculation Areas<br />
Table 5 - Pillar Stability Factors for Continuous Haulage Panel Back-Analysis<br />
Panel<br />
Development with Side Retreat with Side <strong>and</strong><br />
Overburden,<br />
Gob<br />
Active Gob<br />
ft<br />
BPStF PStF BPStF PStF<br />
6 th Left 1300 2.11 0.88 1.72 0.48<br />
7 th Left 1500 1.99 0.76 1.64 0.42<br />
8 th Left 1760 1.79 0.64 1.52 0.36<br />
9 th Left 1680 1.87 0.67 1.80 0.46<br />
Average 1560 1.94 0.74 1.67 0.43<br />
The four red squares in Figure 45 represent ARMPS stability factors associated with the<br />
1 st North continuous haulage system panels. Although no catastrophic failures were reported,<br />
pillar recovery was not trouble-free. Accident records indicate that two injuries resulted from<br />
bounces (one <strong>of</strong> which was a coal burst) during pillar recovery in late 1993 <strong>and</strong> early 1994 in the<br />
7 th Left continuous haulage panel. Also, pillars were ab<strong>and</strong>oned in each panel to alleviate some<br />
form <strong>of</strong> difficult ground condition. Ro<strong>of</strong> coal had been left during development <strong>of</strong> these panels<br />
<strong>and</strong> this practice may have contributed to the difficulties. Regardless <strong>of</strong> the reason for leaving<br />
the pillars, these unmined zones indicate that pillar recovery was not entirely successful.<br />
80
Barrier Stability Factor (BPStF)<br />
2.5<br />
2<br />
1.5<br />
1<br />
0.5<br />
0<br />
1 st North Panels 6 to<br />
9 Pillar Recovery<br />
NB Recovery using<br />
Different Calculation<br />
Methods at 2160 ft OB<br />
0 0.5 1 1.5 2<br />
Note: NB = North Barrier, SB = South Barrier, OB = Overburden<br />
NIOSH Minimum PStF<br />
South Mains Pillar<br />
Recovery<br />
Pillar Stability Factor (PStF)<br />
NIOSH Minimum BPStF<br />
1st North Panels 6 to 9 Recovery South Mains Pillar Recovery NB Failure Method 1 - 2160 OB<br />
NB Failure Method 2 - 2160 OB<br />
SB Recovery - 2000 OB<br />
NB Failure Method 3 - 2160 OB SB Recovery - 1640 OB<br />
Figure 45 - ARMPS Stability Factors at Cr<strong>and</strong>all Canyon <strong>Mine</strong><br />
South Mains Pillar Recovery. The South Mains pillaring process involved mining a series <strong>of</strong> 3-4<br />
rooms east <strong>and</strong>/or west from the original 5-entry main, typically 3 crosscuts deep into the<br />
adjacent longwall barrier pillars (see Figure 36). The newly formed pillars were typically the<br />
same dimensions as the original South Mains pillars (approximately 80 x 112-foot centers). The<br />
new pillars <strong>and</strong> the original South Mains pillars were then extracted. This process was repeated<br />
along the length <strong>of</strong> the South Mains, where overburden ranged from 700 to 1,520 feet.<br />
Four areas with relatively high overburden <strong>and</strong> minimal barrier width to the longwall gobs were<br />
selected for back-analysis using ARMPS. The areas were between longwall Panels 6 <strong>and</strong> 18,<br />
Panels 5 <strong>and</strong> 16, Panels 4 <strong>and</strong> 15, <strong>and</strong> Panels 3 <strong>and</strong> 13 (see Figure 46). At each <strong>of</strong> these<br />
locations, the maximum extraction area <strong>and</strong> minimum barrier widths were applied in the analysis<br />
to subject pillars <strong>and</strong> barriers surrounding the developing gob to the highest degree <strong>of</strong> loading.<br />
This approach was used to define the lower limit <strong>of</strong> the historical pillar stability factors<br />
associated with pillar recovery in the South Mains. Results <strong>of</strong> the ARMPS analyses are included<br />
in Table 6.<br />
The light blue triangles in Figure 45 represent stability factors associated with pillar recovery in<br />
the South Mains. Two <strong>of</strong> the cases satisfied the NIOSH criteria for minimum stability factors.<br />
Although no catastrophic failures were reported, miners described “heavy” conditions on the<br />
pillar line indicative <strong>of</strong> high stress <strong>and</strong> pillar bounces were reported. These conditions led the<br />
operator to adopt a pillar recovery sequence in which pillars were extracted exclusively in one<br />
direction rather than alternating the direction between successive rows. <strong>Report</strong>edly, less<br />
“thumping” was experienced on the pillar line when the pillars were extracted exclusively from<br />
west-to-east. Also, interview statements <strong>and</strong> documents indicate pillar “bouncing” occurred<br />
during pillar extraction in the South Mains. Two rows <strong>of</strong> pillars beneath a ridge near the center<br />
<strong>of</strong> South Mains (1520 feet <strong>of</strong> overburden) were not extracted.<br />
81
Figure 46 - South Mains ARMPS Calculation Areas<br />
Table 6 - Pillar Stability Factors for South Mains Back-Analysis for Areas with Side <strong>and</strong> Active Gobs<br />
Area <strong>Mine</strong>d<br />
Between Panels<br />
6 <strong>and</strong> 18<br />
Between Panels<br />
5 <strong>and</strong> 16<br />
Between Panels<br />
4 <strong>and</strong> 15<br />
Between Panels<br />
3 <strong>and</strong> 13<br />
Overburden<br />
(ft)<br />
Development with Side<br />
Gob<br />
Original Original<br />
West East PStF<br />
BPStF BPStF<br />
Retreat with Side <strong>and</strong> Active Gob<br />
BPStF,<br />
West<br />
Barrier<br />
BPStF,<br />
East<br />
Barrier<br />
Minimum<br />
BPStF<br />
PStF<br />
1330 7.35 2.12 1.53 5.36 2.10 2.10 0.94<br />
1300 7.00 7.03 1.43 1.59 2.02 1.59 0.72<br />
1200 7.84 7.81 1.55 2.28 2.03 2.03 0.87<br />
1130 8.64 12.55 1.72 5. 65 1.78 1.78 0.78<br />
Average 1240 7.71 7.38 1.56 1.88 0.83<br />
North Barrier Section. Recovery mining in the North Barrier section extracted the two southern<br />
pillars leaving the northernmost pillar intact for a bleeder system. Prior to December 2007, the<br />
ARMPS s<strong>of</strong>tware did not have the capability to model bleeder system geometry directly. At<br />
least three alternatives could be considered for determining stability factors in this scenario.<br />
82
1. Assume that the bleeder pillar is not developed. Using this approach, the section is<br />
modeled as a three entry system <strong>and</strong> the overall width <strong>of</strong> the barrier is the sum <strong>of</strong> the actual<br />
barrier width plus the bleeder pillar width.<br />
2. Assume that the entire pillar row is mined. In this model, the load bearing capacity <strong>of</strong> the<br />
bleeder pillar is not considered.<br />
3. Assume a greater barrier width than the actual dimension. In this approach, the load<br />
bearing capacity <strong>of</strong> the bleeder pillar is determined <strong>and</strong> a recalculated barrier dimension is<br />
used. The barrier dimension is chosen such that its load bearing capacity represents the<br />
combined strength <strong>of</strong> the actual barrier pillar <strong>and</strong> the bleeder pillar (see Appendix P).<br />
Each <strong>of</strong> these approaches uses a different assumed geometry (Figure 47) <strong>and</strong> provides a different<br />
result. The first method generates the highest PStF <strong>and</strong> the second <strong>and</strong> third methods generate<br />
lower <strong>and</strong> similar PStF values. Consequently, when compared to NIOSH pillar design criteria<br />
from the NIOSH database or pillar design from mine site back-analysis, the first method is more<br />
likely to overstate stability than the second or third method. The inappropriateness <strong>of</strong> Method 1<br />
is evident in the fact that StF’s calculated for a retreating section using this method are actually<br />
greater than StF’s calculated for development using actual pillar <strong>and</strong> barrier dimensions (see<br />
Table 7). When comparing the design to NIOSH or mine site specific design criteria, the second<br />
<strong>and</strong> third methods <strong>of</strong>fer the safest approach.<br />
Calculation<br />
Method<br />
1<br />
(215-foot barrier)<br />
2<br />
(135-foot barrier)<br />
3<br />
(147-foot barrier)<br />
Table 7 - Pillar Stability Factors for North Barrier Section<br />
Overburden<br />
at Failure<br />
(ft)<br />
Development with<br />
Side Gob<br />
BPStF,<br />
PStF<br />
North<br />
Barrier<br />
Retreat with Side <strong>and</strong><br />
Active Gob<br />
BPStF,<br />
North Barrier<br />
PStF<br />
2160 1.39 0.40<br />
2160 0.91 0.35 0.88 0.24<br />
2160<br />
0.96 0.22<br />
Since overburden at the location where the March 10, 2007, non-injury coal outburst accident<br />
occurred was 2,160 feet, that value was used in the back-analysis for pillar recovery to establish<br />
a minimum stability factor threshold for future pillar design. Results <strong>of</strong> the ARMPS analyses<br />
using all three assumptions for incorporating a bleeder pillar are included in Table 7.<br />
The magenta colored shapes in Figure 45 represent ARMPS stability factors for the North<br />
Barrier section determined using the three methodologies discussed earlier. They are grouped<br />
together in an oval to signify that all three correspond to the same mining scenario. Regardless<br />
<strong>of</strong> the methodology used, both the pillar stability factor <strong>and</strong> barrier pillar stability factor fall<br />
below the NIOSH recommended values for bump-prone <strong>and</strong> non-bump-prone ground. The low<br />
stability factors indicate that poor ground conditions <strong>and</strong>/or section failure would be anticipated<br />
during pillar recovery.<br />
83
Figure 47 - Methods <strong>of</strong> Incorporating a Bleeder Pillar in ARMPS Analyses<br />
South Barrier Section. Approximately 25% <strong>of</strong> the South Barrier section was developed in<br />
overburden exceeding 2,000 feet. Thus, analyses to assess the overall section design were based<br />
on that overburden depth. These calculated pillar stability values are summarized in Table 8.<br />
The table also includes PStF <strong>and</strong> BPStF values for 1,640 feet <strong>of</strong> overburden. This is the<br />
maximum cover that the retreating pillar line encountered in the South Barrier section prior to<br />
the August 6 accident.<br />
Method<br />
Overburden<br />
(ft)<br />
Table 8 - Pillar Stability Factors for South Barrier Section<br />
Development with Side Gob<br />
BPStF<br />
South<br />
Barrier<br />
PStF<br />
84<br />
Retreat with Side <strong>and</strong> Active Gob<br />
BPStF<br />
South<br />
Barrier<br />
PStF<br />
N/A 2000 0.91 0.46 0.76 0.23<br />
N/A 1640 1.18 0.73 1.00 0.35
The blue square <strong>and</strong> orange diamond in Figure 45 correspond to these two pillar recovery<br />
scenarios. Since the bleeder pillar in this section was not adjacent to the barrier along the<br />
Panel 13 gob, the ARMPS s<strong>of</strong>tware could consider the South Barrier width directly (i.e., without<br />
making adjustments like those for the North Barrier). Had the pillar line retreated to a point<br />
beneath the deepest cover, the PStF <strong>and</strong> BPStF would have been nearly the same or less than<br />
those associated with the March burst in the North Barrier (substantially lower than values<br />
determined using the method with the highest risk, Method 1, <strong>and</strong> lower than the NIOSH<br />
recommended values). Although longer pillars were employed in the South Barrier section, the<br />
thinner barrier towards Panel 13 <strong>and</strong> the slab cut into the barrier during pillar recovery result in<br />
larger calculated abutment loads <strong>and</strong> lower StF’s. As before, the low stability factors indicate<br />
that poor ground conditions <strong>and</strong>/or failure would be anticipated.<br />
Effects <strong>of</strong> Barrier Pillar Recovery on Main West Entries. ARMPS analyses typically are used to<br />
assess the stability <strong>of</strong> a single pillar recovery panel. Other approaches such as finite element <strong>and</strong><br />
boundary element modeling are better suited to evaluate a catastrophic pillar collapse like the<br />
one that occurred at Cr<strong>and</strong>all Canyon <strong>Mine</strong> on August 6, 2007. However, if the effects <strong>of</strong><br />
longwall mining north <strong>and</strong> south <strong>of</strong> the section are neglected entirely, ARMPS provides a<br />
simplified way <strong>of</strong> evaluating the overall stability <strong>of</strong> the Main West pillar system.<br />
The Main West can be represented as a developed section (no pillar recovery) bounded on either<br />
side by the North <strong>and</strong> South Barrier Section workings, as illustrated in Figure 48. On<br />
development, the Main West PStF is 0.86 (near borderline with respect to NIOSH<br />
recommendations) for the maximum Main West overburden <strong>of</strong> 2,160 feet. As the North Barrier<br />
is recovered, the PStF drops to 0.70, below the recommended level, <strong>and</strong> even further to 0.66 with<br />
extraction in the South Barrier. In fact, the actual StF’s are likely much lower given the age <strong>of</strong><br />
the workings (i.e., pillar degradation over time) <strong>and</strong> the influence <strong>of</strong> the adjacent longwall<br />
workings.<br />
NOT TO SCALE<br />
Figure 48 - ARMPS Layout for Simplified Main West Analysis<br />
85
Summary. ARMPS stability factors for Cr<strong>and</strong>all Canyon <strong>Mine</strong> pillar recovery scenarios are<br />
illustrated in Figure 45. In this figure the vertical <strong>and</strong> horizontal solid color lines represent<br />
NIOSH recommended minimum stability factors (0.8 PStF <strong>and</strong> 2.0 BPStF). The recommended<br />
NIOSH values (0.8 PStF <strong>and</strong> 2.0 BPStF) are for overburden deeper than 1,250 feet with strong<br />
ro<strong>of</strong> <strong>and</strong> bump prone ground. ARMPS stability factors that are above or below NIOSH<br />
recommended values do not ensure success or failure. However, when stability factors are<br />
maintained above the thresholds for both production <strong>and</strong> barrier pillars, experience (reflected in<br />
case studies in the NIOSH database) has demonstrated likelihood for success.<br />
With the exception <strong>of</strong> portions <strong>of</strong> the South Mains pillar recovery areas, stability factors at the<br />
mine were below NIOSH recommendations <strong>and</strong>, as would be expected, various ground control<br />
problems were experienced. The low stability factors in the North <strong>and</strong> South Barrier sections, as<br />
well as in the adjacent Main West entries, show a high potential for ground failure. The<br />
following finite element <strong>and</strong> boundary element analyses show similar results.<br />
Finite Element Analysis<br />
Dr. William Pariseau, Pr<strong>of</strong>essor <strong>of</strong> Mining Engineering at the University <strong>of</strong> Utah, performed an<br />
analysis <strong>of</strong> mining in the Main West barriers at Cr<strong>and</strong>all Canyon <strong>Mine</strong> using the finite element<br />
method (FEM). FEM analyses have been used widely in the field <strong>of</strong> civil <strong>and</strong> aerospace<br />
engineering <strong>and</strong> in a variety <strong>of</strong> geomechanics applications as well. In FEM analysis, the area to<br />
be studied is represented by a grid <strong>of</strong> discrete areas or elements. Properties <strong>and</strong> loadings are<br />
assigned to each element. A system <strong>of</strong> equations is constructed <strong>and</strong> solved to determine the<br />
stress, strain, <strong>and</strong> displacement <strong>of</strong> each element. Computer programs are utilized to prepare <strong>and</strong><br />
calculate results <strong>and</strong> to display the model output. To model Cr<strong>and</strong>all Canyon <strong>Mine</strong>, Dr. Pariseau<br />
elected to use a 2-dimensional FEM program, UT2 4 , which he had previously developed. The<br />
objective <strong>of</strong> this study was to develop a better underst<strong>and</strong>ing <strong>of</strong> the strata mechanics associated<br />
with the August 6, 2007, accident at the Cr<strong>and</strong>all Canyon <strong>Mine</strong>.<br />
A complete review <strong>of</strong> Dr. Pariseau’s FEM analysis is beyond the scope <strong>of</strong> this report. However,<br />
a report that he prepared is included in its entirety as Appendix Q. His report describes the study<br />
methodology <strong>and</strong> results in detail.<br />
In the FEM analysis, rock above <strong>and</strong> below the coal seam <strong>and</strong> the seam itself were modeled as<br />
linear elastic materials. The term linear elastic implies that the materials deform at a constant<br />
rate to an increasing or decreasing load. Generally, rock response to initial loading is considered<br />
elastic. However, at elevated load levels beyond the elastic limit <strong>of</strong> a given rock type, fracture<br />
<strong>and</strong> material flow lead to irreversible deformation or “yielding.” Although an elastic FEM<br />
analysis does not consider rock failure <strong>and</strong> yielding explicitly, the models can provide insight to<br />
ground stability by evaluating safety factors. <strong>Safety</strong> factors (SF) can be defined as follows:<br />
Strength<br />
SF = or<br />
Stress<br />
Load Carrying Capability at Elastic Limit<br />
Applied Load<br />
When the load applied to a model element is greater than that element’s load carrying capability,<br />
the SF is less than 1.0 <strong>and</strong> is considered to have failed. In reality, yielding <strong>and</strong> failure prevent<br />
applied loads from exceeding load bearing capacity <strong>and</strong>, therefore, SF cannot be less than 1.0.<br />
However, in an elastic model computed SF’s may be less than 1.0 <strong>and</strong> the distribution <strong>of</strong> these<br />
lower values provides a measure <strong>of</strong> the degree <strong>of</strong> failure likely in a given mining scenario.<br />
Elastic-plastic elements can be used in FEM analysis to model yielding behavior. However, post<br />
failure behavior <strong>of</strong> rock materials is difficult to resolve <strong>and</strong> the analyses are complex <strong>and</strong> time<br />
86
consuming. Generally, the effect <strong>of</strong> yielding in an elastic-plastic analysis is to “spread the load”<br />
in a model. Element yielding essentially creates a limit above which additional loading can no<br />
longer occur <strong>and</strong> excess loads must be transferred to adjacent elements. In contrast, an elastic<br />
model provides an optimistic analysis <strong>of</strong> stability since stress may exceed strength. Thus, if an<br />
unsafe condition is inferred from the results <strong>of</strong> an elastic analysis, then it is likely that any actual<br />
instability will be even more widespread.<br />
In the Cr<strong>and</strong>all Canyon <strong>Mine</strong> analysis, a model was prepared to examine stresses <strong>and</strong><br />
displacements in mine strata in a two-dimensional cross-section through the Main West<br />
workings. The cross-section measured 6,480 feet in an approximately north-south orientation<br />
<strong>and</strong> extended 2,609 feet vertically. These dimensions encompassed worked-out longwall panels<br />
north <strong>and</strong> south <strong>of</strong> Main West <strong>and</strong> overburden above the Hiawatha seam <strong>and</strong> 1,000 feet below<br />
the seam. The Hiawatha seam was modeled as an 8-foot thick unit.<br />
An overburden thickness <strong>of</strong> 1,601 feet was used in the FEM analysis to correspond with the<br />
length <strong>of</strong> a borehole that was used to characterize the stratigraphy <strong>of</strong> Cr<strong>and</strong>all Canyon <strong>Mine</strong>. In<br />
the FEM analysis, beds <strong>of</strong> similar rock type are represented as layers with specific material<br />
properties. These properties usually are developed from laboratory tests on rock samples<br />
obtained from coreholes. Using fundamental principles <strong>of</strong> engineering mechanics, the FEM<br />
computes stresses <strong>and</strong> strains induced in the rock mass by excavation.<br />
In the Cr<strong>and</strong>all Canyon <strong>Mine</strong> model, calculations were performed for four stages <strong>of</strong> excavation:<br />
(1) excavation <strong>of</strong> the Main West entries, (2) excavation <strong>of</strong> longwall panels on either side <strong>of</strong> the<br />
Main West entries, (3) excavation <strong>of</strong> entries in the north barrier pillar, <strong>and</strong> (4) excavation <strong>of</strong><br />
entries in the south barrier pillar. At each mining stage, stresses <strong>and</strong> strains were computed to<br />
illustrate the effects <strong>of</strong> mining.<br />
Main West Mining. Model results in the first stage <strong>of</strong> excavation, Main West development,<br />
suggest that the ro<strong>of</strong>, floor, <strong>and</strong> pillars would be stable. Pillar safety factors are greater than 2.2<br />
(i.e., strength is more than double the applied stress). <strong>Safety</strong> factors are even greater in the ro<strong>of</strong><br />
<strong>and</strong> floor due to the greater strength <strong>of</strong> the shale <strong>and</strong> s<strong>and</strong>stone materials.<br />
Longwall Mining. Model results in the second mining stage, longwall panel extraction, indicate<br />
that some areas have reached the elastic limit while others are well below (see Figure 49). For<br />
example, 25% <strong>of</strong> the barrier pillar separating the Main West from the longwall panels has<br />
yielded in this stage <strong>of</strong> mining. Although the remainder <strong>of</strong> the barrier adjacent to the Main West<br />
has not yielded, it is highly stressed. The gray elements in Figure 49 indicate mine openings in<br />
the Hiawatha seam <strong>and</strong> the black elements represent element safety factors less than 1.0.<br />
Dr. Pariseau stated that:<br />
“<strong>Safety</strong> <strong>and</strong> stability <strong>of</strong> an entry surrounded by an extensive zone <strong>of</strong> yielding<br />
would surely be threatened. A pillar with all elements stressed beyond the elastic<br />
limit would also be <strong>of</strong> great concern.”<br />
Although yielding is isolated to the longwall side <strong>of</strong> the barrier opposite Main West, longwall<br />
mining has had a significant effect on stress levels in the Main West pillars. The highest SF in<br />
the Main West pillars is 1.34 which is substantially less than the values on development. Ro<strong>of</strong><br />
<strong>and</strong> floor SF’s are in the 4 to 5 range suggesting that they continue to be stable.<br />
87
Figure 49 - Element <strong>Safety</strong> Factors about a Barrier Pillar after Longwall Mining<br />
North Barrier Section Development. Model results from the third stage <strong>of</strong> excavation,<br />
development in the North Barrier, indicate that most elements in the north side barrier pillar are<br />
now at yield (note the black elements on the right side <strong>of</strong> Figure 50 at seam level). Rib elements<br />
in pillars adjacent to the Main West entries are also at yield. The outside entry <strong>of</strong> Main West<br />
shows ribs yielding in the pillar between it <strong>and</strong> the new north side barrier pillar entry. The south<br />
outside entry ribs show yielding extending 10 feet into the ribs <strong>and</strong> the highest safety factor in<br />
any pillar element in Figure 50 is 1.2.<br />
South Barrier Section Development. The fourth <strong>and</strong> last stage <strong>of</strong> analysis is entry development<br />
in the South Barrier. The distribution <strong>of</strong> element safety factors at this stage is shown in Figure<br />
51. Almost all elements in the south side barrier pillar are now at yield <strong>and</strong> all pillar elements<br />
across the mining horizon are close to yield. Again, since purely elastic behavior leads to an<br />
underestimate <strong>of</strong> the extent <strong>of</strong> yielding, it is likely that yielding would spread further <strong>and</strong> affect<br />
portions <strong>of</strong> the pillars that have not yielded in the elastic model.<br />
Peak vertical stress in the barrier pillars exceeds 38,400 psi, over 9 times the unconfined<br />
compressive strength <strong>of</strong> the coal. Horizontal stress exceeds 7,300 psi. Even so, this high<br />
confining pressure is insufficient to prevent yielding. The lowest vertical pillar stress is about<br />
6,000 psi, almost half again greater than the unconfined compressive strength <strong>of</strong> the coal; the<br />
lowest horizontal pillar stress is about 1,500 psi. Any release <strong>of</strong> horizontal confinement would<br />
likely result in rapid destruction <strong>of</strong> pillars. Additionally, entries nearest to the mined panels are<br />
showing reduced ro<strong>of</strong> <strong>and</strong> floor safety factors. Overlying coal seams are also yielding or are<br />
very close to yielding over portions <strong>of</strong> the barrier pillars, as seen in Figure 51. These model<br />
results are indicative <strong>of</strong> unstable conditions.<br />
88
Figure 50 - Element <strong>Safety</strong> Factor Distribution after North Barrier Section Development<br />
89
Figure 51 - Element <strong>Safety</strong> Factor Distribution after South Barrier Section Development<br />
90
Conclusions <strong>of</strong> Finite Element Analysis. Dr. Pariseau’s FEM analysis <strong>of</strong> barrier pillar mining at<br />
Cr<strong>and</strong>all Canyon <strong>Mine</strong> “indicates a decidedly unsafe, unstable situation in the making.” It is<br />
noteworthy that the analyses used “optimistic” input values <strong>and</strong> assumptions that would tend to<br />
make the mine workings appear to be more stable as opposed to less. For example:<br />
• Models assumed overburden depth <strong>of</strong> about 1,600 feet even though the actual overburden<br />
exceeded 2,000 feet in some locations.<br />
• The 2-D analysis did not account for crosscuts that would increase the actual pillar stress.<br />
• The analysis did not account for pillar recovery that would further increase pillar stress.<br />
• Elastic material properties were used that limited stress transfer normally associated with<br />
yielding behavior.<br />
• Laboratory strength values were used in the analysis even though rock masses tend to be<br />
weaker.<br />
Despite the use <strong>of</strong> these “optimistic” input values <strong>and</strong> assumptions, the results indicate a<br />
potential for rapid destruction <strong>of</strong> the pillars with expulsion <strong>of</strong> the broken coal into the adjacent<br />
entries.<br />
Boundary Element Analysis<br />
The boundary element method using the displacement-discontinuity calculation is well suited to<br />
modeling thin, tabular deposits like coal seams (see Appendix R). In contrast to the twodimensional<br />
finite element model discussed in the previous section, BEM programs provide a<br />
quasi three-dimensional analysis capability. As illustrated in Figure 52, entries <strong>and</strong> pillars in a<br />
coal seam can be represented as a plane <strong>of</strong> elements bounded by a rock mass. Stress changes <strong>and</strong><br />
displacements associated with mining activity can be evaluated by comparing successive models<br />
in which elements are altered to correspond with the changing mine geometry.<br />
Figure 52 - Illustration <strong>of</strong> Boundary Element Model Components<br />
91
Like all numerical methods, BEM results are always dependent on the input values. In<br />
particular, properties that define the behavior <strong>of</strong> the coal seam, the gob, <strong>and</strong> the rock mass<br />
surrounding the seam are critical (see Figure 52). Furthermore, numerical models can only be<br />
considered to be reliable after they are adjusted (i.e., calibrated) so that they duplicate observed<br />
field behavior.<br />
Cr<strong>and</strong>all Canyon <strong>Mine</strong> Back-Analysis. Dr. Keith Heasley, Pr<strong>of</strong>essor <strong>of</strong> Mining Engineering at<br />
West Virginia University, performed an analysis <strong>of</strong> mining in the Main West area using the<br />
boundary element method. Dr. Heasley used LaModel, a BEM program which he had<br />
previously developed. One objective <strong>of</strong> this work was to use the best available information to<br />
back-analyze the August 6, 2007, pillar failure in order to better underst<strong>and</strong> the geometric <strong>and</strong><br />
geomechanical factors that contributed to the collapse. Another objective was to perform a<br />
parametric analysis <strong>of</strong> pertinent input parameters to assess the sensitivity <strong>of</strong> the LaModel results<br />
to the input values.<br />
A complete review <strong>of</strong> Dr. Heasley’s BEM analysis is beyond the scope <strong>of</strong> this report. However,<br />
a report that he prepared is included in its entirety as Appendix S. His report describes the study<br />
methodology <strong>and</strong> results in detail.<br />
LaModel Calibration Process. In the LaModel analyses, rock above <strong>and</strong> below the coal<br />
seam were modeled as frictionless layers <strong>of</strong> linear elastic materials. However, elements<br />
representing the coal were modeled using strain s<strong>of</strong>tening material properties. Strain s<strong>of</strong>tening<br />
properties simulate the failure process by defining an elastic threshold beyond which an<br />
element’s load bearing capacity decreases; in effect, at some predetermined peak load, the<br />
element yields <strong>and</strong> with further deformation, load bearing capacity generally decreases.<br />
Elements near an opening may actually shed load as a result <strong>of</strong> the yielding process. Elements<br />
further from openings yield at progressively higher peak loads <strong>and</strong> at some point may sustain the<br />
peak load with further deformation (i.e., plastic behavior).<br />
Numerical analyses that incorporate strain-s<strong>of</strong>tening or elastic-plastic behavior provide a means<br />
<strong>of</strong> assessing element failure <strong>and</strong> any associated stress redistribution. However, in geologic<br />
materials, these properties are not easily defined. Furthermore, the modeled behavior <strong>of</strong> pillars<br />
comprised <strong>of</strong> groups <strong>of</strong> these elements, is affected by other model parameters (e.g., rock mass<br />
<strong>and</strong> gob properties). The selection <strong>of</strong> appropriate material properties relies primarily on the<br />
model “calibration” process.<br />
Model calibration is an iterative process in which the analyst compares simulated results with<br />
known actual conditions (or in some instances, proven analytical solutions) to verify that model<br />
output is reasonable. The process, also referred to as “back-analysis,” essentially demonstrates<br />
that the model is capable <strong>of</strong> duplicating known historical outcomes before it is used to evaluate<br />
future scenarios.<br />
Dr. Heasley’s report provides an overview <strong>of</strong> calibration as it pertains specifically to the<br />
LaModel program. The most critical factors with regard to accurately calculating stresses <strong>and</strong><br />
loads, <strong>and</strong>, therefore, pillar stability <strong>and</strong> safety factors, are:<br />
• The Rock Mass Stiffness<br />
• The Gob Stiffness<br />
• The Coal Strength<br />
Each <strong>of</strong> these factors may comprise more than one input parameter (e.g., rock mass stiffness is<br />
defined by a lamination thickness <strong>and</strong> a rock mass modulus). Furthermore, a change in one<br />
92
factor <strong>of</strong>ten influences another. For this reason, model calibration is most efficient when it<br />
follows a systematic process <strong>and</strong> relies as much as possible on the best available information<br />
which may be measured, observed, or empirically or numerically derived. However, in<br />
calibrating the model, the user also needs to consider that the mathematics in LaModel are only a<br />
simplified approximation <strong>of</strong> the true mechanical response <strong>of</strong> the overburden. Because <strong>of</strong> the<br />
mathematical simplifications built into the program, the input parameters may need to be<br />
appropriately adjusted to account for the program limitations.<br />
Model Development. The major effort <strong>of</strong> the back-analysis was directed toward selecting the<br />
critical rock mass, gob <strong>and</strong> coal properties to provide the best LaModel simulation <strong>of</strong><br />
documented events at Cr<strong>and</strong>all Canyon <strong>Mine</strong>. Initially, the mine <strong>and</strong> overburden geometries <strong>of</strong><br />
the Main West area <strong>of</strong> the mine were developed into LaModel mine <strong>and</strong> overburden grids. Then,<br />
the rock mass stiffness was selected to obtain an abutment load distribution (i.e., extent)<br />
consistent with empirical averages <strong>and</strong> local experience. Next, the gob behavior was evaluated<br />
to provide reasonable abutment <strong>and</strong> gob loading magnitudes. For the coal properties, the peak<br />
strength was primarily determined from back analyzing the March 10 outburst accident in the<br />
North Barrier section, <strong>and</strong> the strain-s<strong>of</strong>tening behavior was optimized from the back-analysis <strong>of</strong><br />
the August 6, 2007, event. Throughout this process, a number <strong>of</strong> particular locations, situations,<br />
<strong>and</strong> conditions were used as distinct calibration points. Detailed discussions <strong>of</strong> this process are<br />
provided in Appendix S.<br />
Models were evaluated to select optimum input values for matching the observed mine behavior<br />
<strong>and</strong> to assess the sensitivity <strong>of</strong> the model results to the input values. These analyses provided a<br />
broad underst<strong>and</strong>ing <strong>of</strong> factors that affected ground conditions at Cr<strong>and</strong>all Canyon <strong>Mine</strong> <strong>and</strong><br />
culminated in the development <strong>of</strong> a model that simulates:<br />
• the March 2007 bursts,<br />
• the South Barrier section development, <strong>and</strong><br />
• the August 6 collapse.<br />
In this model, mine workings were represented in a grid <strong>of</strong> 10 x 10-foot elements that measured<br />
570 elements wide by 390 elements high. A separate grid was developed to incorporate the<br />
influence <strong>of</strong> topography in the model. Lamination thickness was set at 500 feet, the final<br />
modulus <strong>of</strong> the north gob was set at 250,000 psi, <strong>and</strong> the final modulus <strong>of</strong> the southern gob was<br />
set at 200,000 psi. The coal strength in the North <strong>and</strong> South Barrier sections was set at 1,300 psi<br />
<strong>and</strong> coal strength in the Main West was set at 1,400 psi. For the strain s<strong>of</strong>tening coal behavior,<br />
the residual stress was set with a 30% reduction from the peak stress. The safety factors<br />
presented were adjusted so that the peak pillar strength in the North Barrier pillars corresponded<br />
to a safety factor <strong>of</strong> 1.0. This same adjustment was made to all pillar safety factor plots shown.<br />
The model grid boundaries <strong>and</strong> calculated in situ overburden stress (i.e., stress levels due to<br />
overburden alone <strong>and</strong> without any influence <strong>of</strong> mining) are illustrated in Figure 53.<br />
93
Figure 53 - LaModel Grid Boundaries <strong>and</strong> Overburden Stress<br />
LaModel Results. The results from the optimum calibrated model for Cr<strong>and</strong>all Canyon <strong>Mine</strong><br />
are shown in Figure 54 <strong>and</strong> Figure 55. In these figures, “cooler” colors (green <strong>and</strong> blue)<br />
correspond to safety factors greater than 1.0. “Hotter” colors (yellow, orange, <strong>and</strong> red)<br />
correspond to safety factors less than 1.0 <strong>and</strong>, therefore, represent pillar failure. It is important to<br />
note that LaModel does not calculate any <strong>of</strong> the details <strong>of</strong> the coal or overburden failure<br />
mechanics. Since the program does not have any dynamic capabilities, it cannot distinguish<br />
between a gentle controlled pillar failure <strong>and</strong> a violent pillar burst. However, coal that bursts<br />
must be at, or very near, its ultimate strength at the time <strong>of</strong> the burst; therefore, it is reasonable in<br />
bump prone ground to associate the point <strong>of</strong> coal failure in LaModel simulations with coal<br />
bursts.<br />
In Figure 54A, model results correlate reasonably well with conditions observed after the March<br />
2007 bursts. For example, failure in the North Barrier section correlates well with observed<br />
damage. In this illustration, only one pillar appears to have failed in the Main West at the time<br />
<strong>of</strong> the burst. Figure 54B shows the development <strong>and</strong> retreat to crosscut 142 <strong>of</strong> the South Barrier<br />
section. In this illustration, safety factors for pillars in the South Barrier section remain above<br />
1.0, although 42 pillars have failed in the Main West. Figure 55 demonstrates the catastrophic<br />
pillar failure propagation consistent with the August 6 collapse. In this simulation, 106<br />
additional pillars fail in the Main West <strong>and</strong> 59 pillars fail in the South Barrier section. The failed<br />
area extends from crosscut 123 in the South Barrier section inby to crosscut 146 in the bleeder<br />
area. This optimum model simulates most <strong>of</strong> the critical observations <strong>of</strong> ground behavior at the<br />
Cr<strong>and</strong>all Canyon <strong>Mine</strong> reasonably well.<br />
94
Figure 54 - Optimum Model Before <strong>and</strong> After South Barrier Section Mining<br />
Figure 55 - Optimum Model after August 6 Failure<br />
In all <strong>of</strong> these models, once the coal strength was calibrated to the March 10, 2007, North Barrier<br />
section outburst, results indicate that the pillars in the Main West were also close to failure.<br />
Once the South Barrier was subsequently developed, the model showed that it was very likely for<br />
the entire Main West <strong>and</strong> South Barrier entries to collapse upon the South Barrier development,<br />
or just a small perturbation was needed to initiate the collapse.<br />
Modeling demonstrates that several actions could have triggered the collapse. Results<br />
demonstrate that if material properties <strong>and</strong> loading conditions are exactly uniform throughout the<br />
Main West area, then some stimulus is required to trigger the event with the mine configuration<br />
present on August 6. In the simulation depicted in Figure 55, for example, six pillars within the<br />
sealed area in Main West were simulated as having been mined <strong>and</strong> replaced with gob material<br />
to act as a triggering mechanism. This action simulates the possibility that isolated pillar failures<br />
(e.g., due to degradation over time <strong>and</strong> in the presence <strong>of</strong> abutment stress) initiated a collapse<br />
which swept through the Main West pillars <strong>and</strong> down through the South Barrier section.<br />
95
Similarly, a sudden change in stresses due to slip along a joint in the ro<strong>of</strong> within the collapse area<br />
could have been a factor in triggering the collapse. Model results also indicate that if the<br />
properties <strong>and</strong> loading conditions are not uniform (a reasonable geologic assumption), the event<br />
may have been triggered by pillar recovery in the active mining section.<br />
Conclusions. An extensive back-analysis <strong>of</strong> events at Cr<strong>and</strong>all Canyon <strong>Mine</strong> using the<br />
LaModel program suggests that the August 6 collapse resulted from the failure <strong>of</strong> a large area <strong>of</strong><br />
similar size pillars. Pillars in the North Barrier section <strong>and</strong> Main West are nearly the same size<br />
<strong>and</strong> strength. Also, the barrier pillars between the Main West <strong>and</strong> the North <strong>and</strong> South Barrier<br />
sections have a comparable strength (within 15%) to the pillars in the Main West <strong>and</strong> barrier<br />
sections. The pillars in the South Barrier section were stronger than the pillars in the North<br />
Barrier section <strong>and</strong> Main West, but only by about 16%. Once a failure initiated, the surrounding<br />
similar strength pillars were likely to fail in domino fashion.<br />
An imminent failure situation was created when pillars adequately sized for development mining<br />
were subjected to additional stress associated with retreat mining (longwall <strong>and</strong> pillar recovery).<br />
Development pillar safety factors below 1.4 indicate that high overburden (approximately<br />
2,200 feet) caused considerable development stress on the pillars in the middle <strong>of</strong> the Main West,<br />
North Barrier, <strong>and</strong> South Barrier sections. Abutment stresses associated with longwall mining<br />
north <strong>and</strong> south <strong>of</strong> the Main West contributed to even lower safety factors. Overall, the area was<br />
primed for collapse because equal size pillars in a large area were already near failure.<br />
Boundary element modeling alone cannot distinguish between the factors or combination <strong>of</strong><br />
factors that may have triggered the August 6 collapse. If conditions are assumed to be exactly<br />
uniform throughout the Main West area, modeling suggests that some stimulus such as pillar<br />
degradation in the sealed area or joint slip in the collapse area was required to trigger the<br />
collapse. However, the modeling also demonstrates that if material properties or loading<br />
conditions are not uniform, then the active mining may have triggered the collapse.<br />
Initially, Dr. Heasley modeled the Main West using coal <strong>and</strong> gob with identical properties.<br />
However, with this approach, he noted that the pillars in the Main West seemed to fail too soon<br />
(or too easy) while the pillars in the South Barrier section seemed to resist failure. Results were<br />
determined to be more consistent with known conditions when coal properties <strong>and</strong> applied load<br />
(adjusted through changes in gob property) were not uniform in the model.<br />
Boundary Element Analyses <strong>of</strong> GRI Mining<br />
Separate boundary element analyses were conducted by <strong>MSHA</strong> as part <strong>of</strong> the accident<br />
investigation in order to gauge the effects <strong>of</strong> three separate actions taken by GRI in the South<br />
Barrier:<br />
• The barrier between crosscut 139 <strong>and</strong> 142 was mined even though this activity was<br />
prohibited by the approved ro<strong>of</strong> control plan.<br />
• Bottom coal was mined from pillars <strong>and</strong> the barrier even though this activity was not<br />
addressed in the approved ro<strong>of</strong> control plan.<br />
• The widths <strong>of</strong> the barrier pillars north <strong>and</strong> south <strong>of</strong> the South Barrier section were<br />
inconsistent with the widths evaluated by AAI.<br />
Each <strong>of</strong> these actions had implications on ground stability during the development <strong>and</strong> recovery<br />
<strong>of</strong> pillars in the South Barrier section. BEM models were used to assess the degree to which<br />
GRI’s actions may have contributed to the August 6 accident. Dr. Heasley’s calibrated model<br />
was used as the basis for each analysis but some modifications were required to generate data for<br />
96
comparison (e.g., grids were changed to reflect conditions with <strong>and</strong> without barrier mining).<br />
Modifications required for the three analyses are discussed individually in the following sections.<br />
Effect <strong>of</strong> Barrier Mining. Dr. Heasley’s boundary element model was developed using the best<br />
available information to back-analyze the August 6, 2007, accident. In this model, the barrier<br />
pillar south <strong>of</strong> the No. 1 entry was considered to have been mined by taking 40-foot deep cuts<br />
between crosscuts 139 <strong>and</strong> 142. The accident investigation team modified Dr. Heasley’s model<br />
by incorporating an additional model step. This step simulated a condition in which the barrier<br />
was not mined in this area <strong>and</strong> provided a basis for comparison <strong>of</strong> model results (i.e., with <strong>and</strong><br />
without barrier mining).<br />
The impact <strong>of</strong> barrier mining was evaluated by observing the distribution <strong>of</strong> vertical stress in the<br />
vicinity <strong>of</strong> the August 6 mining location. Vertical stresses were determined for the section<br />
before <strong>and</strong> after mining the barrier (see Figure 56). As discussed in the Main West Ground<br />
Control History section <strong>of</strong> this report, eight pillars <strong>and</strong> the adjacent barrier between crosscuts 139<br />
<strong>and</strong> 142 were to remain unmined to protect the bleeder entry where it jogged around a sump in<br />
the Main West workings. The pillars were not mined but the barrier to the south was mined.<br />
Model results indicate that stress levels increased substantially in the pillars adjacent to the sump<br />
<strong>and</strong> were highest in the remnant barrier near the location where the South Barrier section crew<br />
was working at the time <strong>of</strong> the August 6 accident. These stress levels are similar in magnitude to<br />
those in the remnant barrier pillar inby crosscut 142 before barrier mining.<br />
Stress redistribution associated with barrier mining occurred over a relatively broad area but<br />
diminished with distance from the extracted area. Vertical stress changes throughout the model<br />
can be determined by subtracting model results in the grid representing an intact barrier (Figure<br />
56, top) from those in the grid that includes barrier mining (Figure 56, bottom). Negative values<br />
reflect stress decreases that result from either element removal (i.e., simulated mining) or<br />
yielding. Positive values represent stress increases.<br />
16000<br />
14400<br />
12800<br />
145<br />
142<br />
139<br />
136<br />
11200<br />
9600<br />
8000<br />
6400<br />
4800<br />
3200<br />
1600<br />
Barrier Mining<br />
0<br />
Vertical<br />
Stress,<br />
psi<br />
145<br />
142<br />
139<br />
136<br />
Figure 56 - Distribution <strong>of</strong> Vertical Stress in the South Barrier Section<br />
97
The magnitude <strong>and</strong> distribution <strong>of</strong> increased vertical stress in the vicinity <strong>of</strong> the Main West sump<br />
are illustrated in Figure 57. Model results indicate that the highest increases (over 4,000 psi)<br />
occurred in the remnant barrier <strong>and</strong> adjacent pillars <strong>and</strong> decreased substantially within a<br />
relatively short distance. Stress increased in the Main West <strong>and</strong> outby in the South Barrier.<br />
However, it is important to note that the vertical stress scale in Figure 57 has been exp<strong>and</strong>ed in<br />
the interval from 0 to 500 psi to provide more detail in this range. Modeled stress increase was<br />
less than 200 psi within five crosscuts (~500 feet) <strong>of</strong> crosscut 139. Also, it should be noted that<br />
these values represent increases in individual elements rather than in average pillar stress.<br />
4000<br />
3000<br />
2000<br />
145<br />
Barrier Mining<br />
142<br />
139<br />
136<br />
1000<br />
500<br />
400<br />
300<br />
200<br />
100<br />
0.01<br />
0<br />
Figure 57 - Vertical Stress Increases due to Barrier Mining<br />
As illustrated in Figure 58, average pillar stress decreased in the pillars immediately adjacent to<br />
the barrier mining. However, pillar yielding that caused these decreases contributed to load<br />
transfer <strong>and</strong> increased stress levels in adjacent pillars. Stress increases were largest in the<br />
vicinity <strong>of</strong> the bleeder entry. For example, model results indicate that vertical stress increased by<br />
24% in a portion <strong>of</strong> the barrier adjacent to the Main West sump. The approved ro<strong>of</strong> control plan<br />
excluded mining the barrier between crosscut 139 <strong>and</strong> 142 explicitly to protect the bleeder entry<br />
in this area. Model results indicate that mining in this area likely jeopardized the stability <strong>of</strong> the<br />
bleeder system inby crosscut 139. This activity also increased stress levels in the remnant barrier<br />
<strong>and</strong> pillars near the location where the South Barrier section crew was working at the time <strong>of</strong> the<br />
August 6 accident.<br />
7%<br />
6%<br />
4%<br />
1%<br />
2000<br />
0%<br />
1600<br />
4%<br />
24%<br />
15%<br />
10%<br />
5%<br />
1%<br />
DECREASE<br />
6%<br />
8%<br />
4%<br />
1%<br />
1%<br />
DECREASE<br />
DECREASE<br />
DECREASE<br />
2%<br />
1%<br />
1%<br />
Figure 58 - Effect <strong>of</strong> Barrier Mining on Average Pillar Stress<br />
98
Steps were added to Dr. Heasley’s model to simulate the planned pillar recovery outby crosscut<br />
139 (with the barrier intact between crosscuts 139 <strong>and</strong> 142). Pillar safety factors associated with<br />
pillar extraction in the rows between crosscuts 139 <strong>and</strong> 136 are shown in Figure 59. These<br />
results indicate that even if the barrier had not been mined between crosscuts 139 <strong>and</strong> 142, pillars<br />
in the South Barrier section likely would have failed if pillar mining continued in the next several<br />
pillar rows. After one row <strong>of</strong> pillars is recovered, pillar SF’s are still above 1.0 as indicated by<br />
the blue <strong>and</strong> green colors in Figure 59A. When the next row <strong>of</strong> pillars is recovered (Figure 59B),<br />
failure occurs near the pillar line (yellow <strong>and</strong> orange) <strong>and</strong> with recovery <strong>of</strong> the third row, failure<br />
propagates outby over a broad area as indicated by the red <strong>and</strong> orange colors in Figure 59C.<br />
A<br />
B<br />
C<br />
2.0<br />
1.8<br />
1.6<br />
1.4<br />
1.2<br />
1.0<br />
0.8<br />
0.6<br />
0.4<br />
0.2<br />
0<br />
Figure 59 - Pillar <strong>Safety</strong> Factors for Pillar Recovery Outby Crosscut 139<br />
Effect <strong>of</strong> Bottom Mining. Dr. Heasley’s boundary element model was also modified to evaluate<br />
the effects <strong>of</strong> bottom mining during pillar recovery inby crosscut 139 in the South Barrier<br />
section. Bottom mining refers to the recovery <strong>of</strong> coal that remains in the floor after development<br />
mining particularly in thick seams. In the western area <strong>of</strong> the South Barrier section, up to 5 feet<br />
or more <strong>of</strong> bottom coal remained after development. The continuous mining machine ramped<br />
into the floor to remove this coal as pillars <strong>and</strong> barriers were recovered, even though this had not<br />
been considered by AAI in the mine design. Bottom coal was not removed from the entries <strong>and</strong><br />
crosscuts, except when grading heaved bottom to maintain clearance for mining equipment.<br />
Bottom mining creates taller pillars, which are generally weaker than shorter pillars <strong>of</strong> the same<br />
length <strong>and</strong> width. In the South Barrier section, the affected areas were the remnant pillars <strong>and</strong><br />
the 80-foot wide remnant barrier labeled A <strong>and</strong> B, respectively, in Figure 60. Bottom mining in<br />
the pillars affected pillar stability as mining proceeded within each row. However, once a row<br />
99
was completed, this effect was negated as the ro<strong>of</strong> was intended to collapse after mining was<br />
completed.<br />
LW No. 1 No. 2 No. 3 No. 4<br />
120 ft Barrier<br />
Main West South Barrier section after development<br />
Taller Pillar from<br />
B<br />
Ramping into Floor A<br />
Bleeder<br />
80 ft Remnant Barrier No. 1 No. 2 No. 3 No. 4<br />
Main West South Barrier section after pillar recovery in the No. 1 entry<br />
B<br />
Taller Pillar from Ramping into Floor<br />
Bleeder<br />
80 ft Remnant Barrier No. 1 No. 2 No. 3 No. 4<br />
A<br />
Main West South Barrier section after pillar recovery in the No. 1 <strong>and</strong> 2 entries<br />
B<br />
Taller Pillar from Ramping into Floor<br />
Bleeder<br />
80 ft Remnant Barrier No. 1 No. 2 No. 3 No. 4<br />
Main West South Barrier section after pillar recovery in the No. 1, 2 <strong>and</strong> 3 entries<br />
Figure 60 - Cross-Section through South Barrier Section during Pillar Recovery<br />
As illustrated in Figure 61, the partial pillar between No. 1 <strong>and</strong> No. 2 entry separates the mining<br />
crew from the caved area. The stability <strong>of</strong> the work area relies largely on the stability <strong>of</strong> the<br />
partial pillar, particularly as mining progresses outby to the intersection. Bottom mining on the<br />
gob side <strong>of</strong> this pillar increases the pillar height <strong>and</strong> effectively reduces its strength. A similar<br />
situation occurs when mining moves to the No. 3 entry. Thus, bottom mining can impact local<br />
stability even though the pillars are intentionally being reduced in size <strong>and</strong> the ro<strong>of</strong> is expected to<br />
collapse. Also, bottom mining adjacent to the remnant barrier weakened the remnant barrier<br />
inby the pillar line <strong>and</strong> contributed to overall instability <strong>of</strong> the section as it retreated.<br />
100
Remnant<br />
Barrier<br />
Barrier Slab Cuts<br />
<strong>Mine</strong>d Pillar<br />
Caved Area<br />
Partial Pillar (A)<br />
Mining in No. 2 Entry<br />
X X’<br />
Bleeder Entry<br />
Barrier Pillar<br />
No. 1 Entry<br />
No. 2 Entry<br />
No. 3 Entry<br />
No. 4 Entry<br />
Plan view<br />
A<br />
No. 1<br />
Entry<br />
13 ft mined<br />
height<br />
No. 2<br />
Entry<br />
Cross-section X to X’<br />
Figure 61 - Effect <strong>of</strong> Bottom Mining on Pillar Geometry<br />
(e.g. inby crosscut 142)<br />
Dr. Heasley’s model was modified to evaluate the impact <strong>of</strong> bottom mining. As illustrated in<br />
Figure 62, one half <strong>of</strong> the remnant barrier was modeled using coal properties developed for a<br />
mining height <strong>of</strong> 8 feet, while the other half used a weaker coal strength <strong>and</strong> lower stiffness<br />
based on a mining height <strong>of</strong> 13 feet. Simulations with <strong>and</strong> without bottom mining were<br />
compared to measure the relative impact <strong>of</strong> the activity.<br />
101
B<br />
8 ft mined<br />
height<br />
80 ft Wide Remnant Barrier<br />
13 ft mined<br />
height<br />
B<br />
Element properties<br />
Based on 8 ft mined<br />
height<br />
Element properties<br />
Based on 13 ft mined<br />
height<br />
Figure 62 - Model Representation <strong>of</strong> Bottom Mining in the Remnant Barrier<br />
The impact <strong>of</strong> bottom mining in the barrier was evaluated by assessing vertical stress levels <strong>and</strong><br />
element safety factors in the vicinity <strong>of</strong> the August 6 mining location. The distributions <strong>of</strong><br />
vertical stress with <strong>and</strong> without bottom mining are presented in Figure 63.<br />
without bottom mining<br />
16000<br />
14400<br />
12800<br />
11200<br />
9600<br />
8000<br />
6400<br />
4800<br />
3200<br />
1600<br />
0<br />
Vertical<br />
Stress,<br />
psi<br />
with bottom mining<br />
Figure 63 - Distribution <strong>of</strong> Vertical Stress in the South Barrier Section<br />
102
Although there are subtle differences over a broad area, the primary impact <strong>of</strong> bottom mining is<br />
seen in the remnant barrier. The core <strong>of</strong> the 80-foot wide remnant barrier has a higher peak <strong>and</strong><br />
residual strength (Figure 63 top) when bottom mining is not conducted. With bottom mining,<br />
load that otherwise may have been supported by the barrier is redistributed to other elements.<br />
Stress redistribution was examined by subtracting model results in the two model grids shown in<br />
Figure 63. Negative values reflect stress decreases that result from lower element strength<br />
<strong>and</strong>/or yielding. Positive values represent stress increases. Since no additional mining was<br />
simulated, decreases between the models demonstrate the stress redistribution between elements.<br />
In effect, Figure 64 shows where stress increased <strong>and</strong> decreased as a result <strong>of</strong> bottom mining.<br />
Figure 64 - Differences in Vertical Stress due to Bottom Mining<br />
3000<br />
2000<br />
1000<br />
200<br />
0<br />
0<br />
-200<br />
-1000<br />
-3500<br />
-7000<br />
Vertical<br />
Stress<br />
Change,<br />
psi<br />
The element safety factors from the model results indicate that the remnant barrier would have<br />
failed even if the bottom coal had not been mined (Figure 65). Element stability factors below<br />
1.0 in Figure 65 indicate that the peak strength <strong>of</strong> elements was exceeded across the entire width<br />
<strong>of</strong> the barrier even though the modeled mining height was 8 feet. The primary effect <strong>of</strong> bottom<br />
mining inby the pillar line was to weaken an already undersized remnant barrier. Bottom mining<br />
in the barrier cuts between crosscuts 139 <strong>and</strong> 142 weakened the barrier near the last known<br />
location <strong>of</strong> the miners <strong>and</strong>, consequently, contributed to increased stress levels.<br />
Variation in Barrier Width from Design to Implementation. The South Barrier section was<br />
developed with four entries on 80-foot centers <strong>and</strong> crosscuts on 130-foot centers. AAI had<br />
evaluated this pillar system using both ARMPS <strong>and</strong> LaModel. However, their analyses<br />
considered system stability with a 55-foot wide barrier north <strong>of</strong> the section <strong>and</strong> a 135-foot wide<br />
barrier to the south. When the South Barrier section was developed, barrier widths were actually<br />
75 feet (55 feet minimum from the Main West notches) <strong>and</strong> 121 feet, respectively. Dr. Heasley’s<br />
calibrated Cr<strong>and</strong>all Canyon <strong>Mine</strong> model was modified <strong>and</strong> rerun to consider the effects <strong>of</strong><br />
varying barrier widths. Since the model uses 10-foot wide elements, the “as designed” barriers<br />
were represented as being 60 <strong>and</strong> 140 feet wide to the north <strong>and</strong> south, respectively. The “as<br />
mined” model used 80 <strong>and</strong> 120-foot wide barriers to the north <strong>and</strong> south, respectively. With the<br />
exception <strong>of</strong> these grid modifications, the two models were identical to one another.<br />
103
2.0<br />
without bottom mining<br />
with bottom mining<br />
1.8<br />
1.6<br />
1.4<br />
1.2<br />
1.0<br />
0.8<br />
0.6<br />
0.4<br />
0.2<br />
0<br />
Element<br />
<strong>Safety</strong><br />
Factor<br />
Figure 65 - Element <strong>Safety</strong> Factors<br />
Figure 66 illustrates pillar safety factors calculated for the Main West region as it was actually<br />
developed <strong>and</strong> recovered prior to the August 6 accident. These model results are consistent with<br />
Dr. Heasley’s results that show some pillar failure in the sealed portion <strong>of</strong> Main West but stable<br />
pillars in the section after development <strong>and</strong> after the pillar recovery prior to the August 6<br />
accident. Although broad pillar failure can be triggered by one <strong>of</strong> several mechanisms, the<br />
model demonstrates a general reluctance for the Main West failure to propagate south past the<br />
104
75-foot wide barrier pillar (modeled as 80 feet wide) <strong>and</strong> into the South Barrier Section. In<br />
contrast, when the north side barrier width is reduced to 55 feet (modeled as 60 feet), Main West<br />
pillar failure propagates southward into the section during development mining.<br />
Figure 66 – Pillar <strong>Safety</strong> Factors Modeled with a 120-foot Southern Barrier<br />
2.0<br />
1.8<br />
1.6<br />
1.4<br />
1.2<br />
1.0<br />
0.8<br />
0.6<br />
0.4<br />
0.2<br />
0<br />
Pillar<br />
<strong>Safety</strong><br />
Factor<br />
Figure 67 illustrates pillar safety factors for three model steps that represent development mining<br />
in the South Barrier section modeled with a 60-foot north side <strong>and</strong> a 140-foot south side barrier.<br />
In Figure 67A, pillars in the South Barrier section are stable as indicated by the blue colors. In<br />
Figure 67B, one additional crosscut has been developed. The South Barrier section remains<br />
stable but several additional pillar failures are noted in the Main West. In Figure 67C, another<br />
crosscut has been developed <strong>and</strong> failure is widespread throughout the South Barrier section as<br />
noted by the yellow <strong>and</strong> orange colors. A wider barrier south <strong>of</strong> the section (137-foot versus the<br />
121-foot actually mined) may have decreased the likelihood <strong>of</strong> failure from Panel 13 longwall<br />
extraction abutment stress. However, model results suggest that pillar failure may have occurred<br />
in the section during development as a result <strong>of</strong> the corresponding reduction <strong>of</strong> barrier width to<br />
the north (55 feet initially planned versus 75 feet as mined measured outside the Main West<br />
notches).<br />
105
A<br />
2.0<br />
B<br />
C<br />
1.8<br />
1.6<br />
1.4<br />
1.2<br />
1.0<br />
0.8<br />
0.6<br />
0.4<br />
0.2<br />
0<br />
Pillar<br />
<strong>Safety</strong><br />
Factor<br />
Figure 67 – Pillar <strong>Safety</strong> Factors Modeled with a 140-foot Southern Barrier for Development Mining<br />
Skipping Pillars during South Barrier Retreat. After the March 10 non-injury coal outburst<br />
accident in the North Barrier section, AAI <strong>and</strong> the mine operator concluded that the method <strong>of</strong><br />
mining in that area had contributed to the event. Pillar recovery had been discontinued at<br />
crosscut 137 <strong>and</strong> resumed outby between crosscuts 134 <strong>and</strong> 135 (i.e., pillars were “skipped”).<br />
When the March 10 accident occurred, several pillars had been removed outby crosscut 135 but<br />
good caving conditions had not been established. Hanging, cantilevered strata inby the new<br />
pillar line were thought to have caused additional loading on the surrounding pillars. Thus, AAI<br />
<strong>and</strong> GRI attributed the event in part to the operator’s decision to reestablish the pillar line under<br />
deep cover <strong>and</strong> in the abutment zone <strong>of</strong> the original pillar line <strong>and</strong>, to a lesser extent, the<br />
abutment load from the Panel 12 longwall gob to the north. As a result, AAI cautioned against<br />
skipping pillars in the South Barrier.<br />
Although the mine operator skipped pillars between crosscuts 139 <strong>and</strong> 142 in the South Barrier<br />
section, this decision did not contribute to the August 6 accident. The North Barrier section burst<br />
experience raised concerns with abutment stress as a pillar line was reestablished. However, the<br />
South Barrier section scenario is distinctly different <strong>and</strong> similar stress conditions were not<br />
present for several reasons:<br />
• First, on August 6, a new pillar line had not yet been created. Mining was limited to the<br />
barrier pillar south <strong>of</strong> the No.1 entry; no pillars had been recovered. Thus, the amount <strong>of</strong><br />
potentially cantilevered strata created by the barrier cuts <strong>and</strong> available to generate<br />
additional abutment load was minimal.<br />
106
• Second, the August 6 mining location was about 400 feet outby the last South Barrier<br />
pillar line. At this distance, abutment stress from the active gob would also be minimal.<br />
• Finally, overburden was 1,760 feet versus more than 2,000 feet in the area affected by the<br />
North Barrier outburst accident. AAI recommended against skipping pillars “particularly<br />
under the deepest cover.” In February 2008, AAI indicated that “the deepest cover”<br />
could apply to the ridge crest over the area (2,000 to 2,200 feet) or may be interpreted<br />
more broadly (e.g., 1,800 to 1,900 ft). AAI stated that GRI did not seek clarification <strong>of</strong><br />
this term.<br />
The skipped pillars between crosscuts 139 <strong>and</strong> 142 in the South Barrier section did not cause or<br />
compound the pillar collapse that occurred on August 6. Conversely, these pillars likely reduced<br />
the severity <strong>of</strong> the event in the vicinity <strong>of</strong> the working section.<br />
Summary - Analyses <strong>of</strong> Collapse<br />
Three types <strong>of</strong> analyses were conducted to evaluate ground behavior at Cr<strong>and</strong>all Canyon <strong>Mine</strong>.<br />
Although the approaches are substantially different, the results <strong>and</strong> conclusions are similar.<br />
• ARMPS stability factors below NIOSH’s recommended minimums do not necessarily<br />
ensure failure. However, stability factors for the North Barrier section were below<br />
recommended values <strong>and</strong> lower than any previous experience at the mine. GRI<br />
ab<strong>and</strong>oned the North Barrier section due to difficult ground conditions <strong>and</strong> bursts, yet<br />
they employed a design with still lower stability factors in the South Barrier section.<br />
• ARMPS is not directly capable <strong>of</strong> evaluating the exact geometry <strong>of</strong> the entire area<br />
affected by the August 6 collapse. However, if the effects <strong>of</strong> longwall mining are<br />
neglected entirely, ARMPS provides insight to overall Main West stability. This<br />
approach demonstrates that the Main West pillar stability is below NIOSH<br />
recommendations even without the additional influence <strong>of</strong> longwall abutment stress.<br />
• Despite the use <strong>of</strong> optimistic input values (e.g., consideration <strong>of</strong> development mining<br />
only), FEM model results indicate the strong potential for a rapid catastrophic failure <strong>of</strong><br />
the North <strong>and</strong> South Barrier sections <strong>and</strong> the Main West pillars between them.<br />
• BEM analyses confirm that the Main West was vulnerable to wide-spread failure because<br />
a large area <strong>of</strong> pillars was developed with marginal safety factors <strong>and</strong> similar strength<br />
barrier pillars. Analyses indicate that one or more events or conditions may have been<br />
the trigger which actually initiated the pillar failure. However, model results are more<br />
consistent with known conditions at the accident site when coal properties <strong>and</strong> applied<br />
load (adjusted through changes in gob property) are not uniform in the model.<br />
All <strong>of</strong> the analyses conducted as part <strong>of</strong> this accident investigation indicate that the mining plan<br />
employed to extract barriers on either side <strong>of</strong> the Main West was inadequate to maintain stability<br />
during pillar recovery. The design created a large area <strong>of</strong> similar sized <strong>and</strong> marginally stable<br />
pillars. When one pillar or group <strong>of</strong> pillars failed, the rest were destined to fail in domino<br />
fashion.<br />
Seismic analyses <strong>and</strong> subsidence information developed in the accident investigation indicate<br />
that the collapse initiated near the South Barrier section pillar line <strong>and</strong> the greatest surface<br />
displacements were located 500 feet outby the last known location <strong>of</strong> the miners. These<br />
observations suggest that loading conditions were more extreme near the working face <strong>and</strong><br />
provide further clarification that the collapse was most likely initiated by the mining activity.<br />
107
Critique <strong>of</strong> <strong>Mine</strong> Design<br />
The engineering analyses discussed in the previous sections demonstrate that the August 6, 2007,<br />
accident was caused by the rapid collapse <strong>of</strong> a large area <strong>of</strong> pillars. Overburden in excess <strong>of</strong><br />
2,000 feet <strong>and</strong> abutment stresses from adjacent mined-out longwall panels <strong>and</strong> active pillar<br />
recovery combined to create a high stress environment that the pillar system was incapable <strong>of</strong><br />
supporting. Initially both GRI <strong>and</strong> <strong>MSHA</strong> recognized the potential for high stress. Although<br />
recent pillar recovery operations had been conducted in the South Mains without the assistance<br />
<strong>of</strong> a ground control consultant, GRI retained these services for the design <strong>of</strong> the North <strong>and</strong> South<br />
Barrier sections. Similarly, previous pillar recovery operations had been conducted at the mine<br />
under the existing ro<strong>of</strong> control plan without the benefit <strong>of</strong> site-specific provisions. For the North<br />
<strong>and</strong> South Barrier sections, <strong>MSHA</strong> required such site-specific plans for both development <strong>and</strong><br />
pillar recovery.<br />
GRI implemented <strong>and</strong> <strong>MSHA</strong> approved a mine design based largely on the results <strong>of</strong> engineering<br />
analyses performed by AAI. These analyses used two <strong>of</strong> the approaches discussed in the<br />
previous section <strong>of</strong> this report, ARMPS <strong>and</strong> LaModel. AAI generated an overburden map for<br />
these analyses, which was determined to be accurate by comparing it to the overburden map<br />
independently generated by the <strong>MSHA</strong> accident investigation team. AAI’s analyses concluded<br />
that proposed pillars should function adequately for short-term mining in the North Barrier.<br />
After this design failed, AAI modified the design. Their further analyses indicated that pillar<br />
dimensions proposed for South Barrier mining would “provide a reliable level <strong>of</strong> protection<br />
against problematic bumping for retreat mining under cover reaching 2,200 feet.” However,<br />
pillar recovery operations had retreated beneath overburden <strong>of</strong> only about 1,640 feet at crosscut<br />
142 (barrier slabbing to 1,760 feet at crosscut 139) when the August 6 collapse occurred.<br />
While mining in the South Barrier section, GRI deviated from the design analyzed by AAI <strong>and</strong><br />
the approved ro<strong>of</strong> control plan (e.g., GRI mined bottom coal, varied the barrier pillar dimensions,<br />
<strong>and</strong> mined the barrier between crosscuts 139 <strong>and</strong> 142). These actions affected barrier pillar<br />
strength <strong>and</strong> pillar stress levels in the vicinity <strong>of</strong> the last known location <strong>of</strong> the miners. They<br />
were also part <strong>of</strong> the active pillar recovery operations the cumulative effect <strong>of</strong> which was the<br />
August 6 collapse. However, the Main West <strong>and</strong> adjacent North <strong>and</strong> South Barrier sections were<br />
primed for a catastrophic pillar failure independent <strong>of</strong> these activities because the mine design<br />
created a large area <strong>of</strong> equal size <strong>and</strong> marginally stable (near unity safety factors) pillars. This<br />
failure mechanism was not apparent in the results <strong>of</strong> some <strong>of</strong> the AAI analyses conducted prior<br />
to the accident because overly optimistic design assumptions <strong>and</strong>/or inappropriate input<br />
parameters or procedures were used. Other analyses were done properly but results indicative <strong>of</strong><br />
failure were either misinterpreted or were not acted upon.<br />
Previous Ground Control Studies at Cr<strong>and</strong>all Canyon <strong>Mine</strong><br />
Prior to mining in the North <strong>and</strong> South Barrier sections, GRI contracted AAI to evaluate ground<br />
conditions <strong>and</strong> entry stability associated with GRI’s plan for room <strong>and</strong> pillar mining in the<br />
barriers. AAI’s proposal for this work indicated that “Concern exists for potentially high stress<br />
conditions caused by a combination <strong>of</strong> deep cover <strong>and</strong> side-abutment loads from the adjacent<br />
longwall gobs, <strong>and</strong>, to a lesser extent, load transferred onto the barriers by time dependent pillar<br />
convergence in Main West.” To evaluate these concerns, AAI elected to use a numerical model<br />
to assess vertical stress, convergence, <strong>and</strong> pillar yielding (see Appendix F).<br />
GRI had used AAI’s services on several occasions prior to the analysis <strong>of</strong> Main West. AAI had<br />
developed numerical models <strong>of</strong> ground behavior at Cr<strong>and</strong>all Canyon <strong>Mine</strong> prior to 1996. These<br />
108
models were used to make preliminary evaluations <strong>of</strong> pillar design configurations, even though<br />
at that time model accuracy could not be verified.<br />
Between June 1995 <strong>and</strong> January 1996, Neil & Associates (NAA) conducted field studies in the<br />
6 th Right yield-abutment longwall pillars at the mine. Subsequently, GRI contracted AAI to<br />
refine the model for Cr<strong>and</strong>all Canyon <strong>Mine</strong> using the now available field data. AAI’s calibration<br />
to the 6 th Right data in 1997 improved their confidence in accurately representing ground<br />
behavior at the mine.<br />
AAI developed the calibrated model <strong>of</strong> Cr<strong>and</strong>all Canyon <strong>Mine</strong> ground behavior using a<br />
boundary element computer code called EXPAREA (see Appendix R). This s<strong>of</strong>tware <strong>and</strong> the<br />
calibrated model were used in 2000 to evaluate the effect <strong>of</strong> barrier pillar width on future bleeder<br />
entry stability. The mine location modeled in this study (bleeder entries west <strong>of</strong> Panel 15) was<br />
less than 2,500 feet from the Main West South Barrier <strong>and</strong> several aspects <strong>of</strong> the study (e.g.<br />
evaluations <strong>of</strong> abutment load distribution) were relevant to the subsequent Main West South<br />
Barrier study (see Appendix E).<br />
Barrier Pillar Design<br />
In coal mining, the term barrier pillar refers to a block <strong>of</strong> coal left in place to isolate or protect<br />
mine structures from potentially harmful interactions. For example, barriers could be required to<br />
isolate workings in adjacent properties from one another or to separate active <strong>and</strong> ab<strong>and</strong>oned<br />
workings within the same mine. In these contexts, barriers function primarily to prevent an<br />
influx <strong>of</strong> impounded water or gasses. However, in retreat mining applications (both pillar<br />
recovery <strong>and</strong> longwall), barrier pillars typically are used to protect mine workings from high<br />
vertical stress concentrations near the boundaries <strong>of</strong> extracted areas <strong>of</strong>ten referred to as gobs.<br />
A variety <strong>of</strong> rules <strong>of</strong> thumb, mathematical formulas, <strong>and</strong> design methods have been developed to<br />
establish minimum widths <strong>of</strong> barrier pillars. A USBM publication 8 summarizes nine <strong>of</strong> these<br />
approaches <strong>and</strong> provides an overview <strong>of</strong> performance evaluation techniques that can be used to<br />
optimize barriers. Each <strong>of</strong> the nine formulas is included in Table 9 even though some <strong>of</strong> them<br />
were developed especially for water impoundment. The formula names indicated by bold font<br />
are applicable to barriers used in longwall <strong>and</strong> pillar recovery operations.<br />
Table 9 also includes a minimum barrier width corresponding to each barrier design equation.<br />
Input parameters used to generate these results are pertinent to the Cr<strong>and</strong>all Canyon <strong>Mine</strong><br />
accident site. For example, an 8-foot mining height, 2,160 feet maximum overburden, <strong>and</strong><br />
800-foot panel width were used. A maximum convergence value <strong>of</strong> 3.7 inches was used in the<br />
Holl<strong>and</strong> Convergence Method. Using the six bolded equations in Table 9, these parameters<br />
generate minimum barrier pillar widths ranging from 202 to 384 feet.<br />
AAI had considered four <strong>of</strong> these equations in a 2000 project which evaluated the effects <strong>of</strong><br />
barrier pillar widths on future bleeder entry stability for Panel 15, south <strong>of</strong> Main West (see<br />
Appendix E). Results <strong>of</strong> AAI’s analyses in that study are illustrated in Figure 68 ‡ . AAI stated<br />
that this figure “gives a summary <strong>of</strong> recommended barrier pillar widths by various empirical<br />
‡ Calculated values in Table 9 <strong>and</strong> Figure 68 are dissimilar because input values (e.g. mined<br />
height <strong>and</strong> overburden depth) vary between the two scenarios.<br />
109
methods. The design widths shown here might be helpful as an additional source on which to<br />
base decisions. For a depth <strong>of</strong> 1000 ft, all the methods support a barrier pillar <strong>of</strong> 260 ft or less.<br />
At 1500 ft <strong>of</strong> cover, three <strong>of</strong> four methods suggest a barrier pillar <strong>of</strong> less than 260 ft.” AAI<br />
refers to this work as an “additional source” since it was presented as confirmation <strong>of</strong> the<br />
conclusions drawn from numerical models.<br />
Name<br />
Table 9 - Barrier Pillar Design Formulas<br />
110<br />
Formula<br />
( 180)<br />
1 Dunn’s Rule W = D − + 15<br />
20<br />
Old English Barrier Pillar<br />
( H × T )<br />
2<br />
W = + 5T<br />
Law<br />
100<br />
3<br />
4<br />
Pennsylvania <strong>Mine</strong><br />
Inspector’s Formula<br />
Ash <strong>and</strong> Eaton Impoundment<br />
Formula<br />
Barrier Width (ft)<br />
under 2,160 ft<br />
overburden<br />
114<br />
212<br />
W = 20 + 4T<br />
+ 0. 1D<br />
268<br />
W = 50 + 0. 426D<br />
970<br />
⎛ ⎞<br />
5 Pressure Arch Method W 〉 A = 3⎜<br />
D + 20⎟ ⎝ 20 ⎠<br />
6<br />
British Coal Rule <strong>of</strong><br />
Thumb<br />
7 North American Method<br />
⎛ ⎞<br />
W = ⎜<br />
D ⎟<br />
⎝10 ⎠<br />
+ 45<br />
( D × P)<br />
W = 7000 − D<br />
8 Holl<strong>and</strong> Rule <strong>of</strong> Thumb W = D + 105<br />
22.2<br />
9<br />
Holl<strong>and</strong> Convergence<br />
Method<br />
5(log50.8C)<br />
W =<br />
+ 15<br />
( E log e)<br />
where:<br />
W = barrier pillar width, ft<br />
D = depth <strong>of</strong> mining (or height <strong>of</strong> hydrostatic head in #3 above), ft<br />
H = hydrostatic head or depth below drainage (ft)<br />
T = coal seam thickness (ft)<br />
A = minimum width <strong>of</strong> the maximum pressure arch, ft<br />
P = width <strong>of</strong> adjacent panel, ft<br />
C = estimated convergence on high-stress side <strong>of</strong> barrier pillar, in<br />
E = coefficient <strong>of</strong> extraction adjacent to barrier (E = 0.09 for complete caving)<br />
AAI used numerical models in their 2006 studies <strong>of</strong> Main West barrier development <strong>and</strong> pillar<br />
recovery. Despite the relatively close proximity <strong>and</strong> similar study objectives, results <strong>of</strong> the 2000<br />
<strong>and</strong> 2006 model studies differ substantially. These numerical analyses will be discussed in detail<br />
in a later section <strong>of</strong> this report. The 2006 results also conflict with output from the empirical<br />
formulas in Table 9. Unlike, the 2000 study, AAI did not use barrier pillar formulas to confirm<br />
384<br />
261<br />
357<br />
202<br />
290
the 2006 model results. One <strong>of</strong> a series <strong>of</strong> written questions posed to AAI during the accident<br />
investigation addressed the use <strong>of</strong> barrier pillar equations:<br />
AAI designed barriers for longwall panels at Cr<strong>and</strong>all Canyon <strong>and</strong> it appears that<br />
several methods were used to estimate barrier widths (North American method,<br />
Holl<strong>and</strong> Rule <strong>of</strong> Thumb, Holl<strong>and</strong> Convergence method, PA <strong>Mine</strong> Inspectors<br />
formula). How were these formulas considered when evaluating mining in the<br />
existing barriers or why were they not considered<br />
AAI responded, “These methods are limited to cover less than 2,000 ft.”<br />
Figure 68 - Barrier Pillar Sizes from Empirical Methods<br />
Figure 4 in AAI’s May 5, 2000, <strong>Report</strong><br />
As indicated in Figure 68, AAI had previously used the North American method to determine<br />
barrier width in overburden depths up to 2,500 feet. This method is the only one <strong>of</strong> the four that<br />
accounts for the width <strong>of</strong> the adjacent panel in determining the barrier width. AAI’s results in<br />
Figure 68 were based on using two longwall panel widths (~1,560 feet) <strong>and</strong>, even at lower depths<br />
<strong>of</strong> cover, this method recommends wider barrier widths than the other three methods. This is a<br />
reasonable assumption, given the caving characteristics <strong>of</strong> strata in the Wasatch Plateau (i.e.,<br />
maximum subsidence may not be achieved with the extraction <strong>of</strong> a single panel – see Appendix<br />
L). However, if one panel width is used (~800 feet), the calculated barrier widths are much more<br />
consistent with the other methods (i.e., 130 feet wide at 1,000 feet <strong>of</strong> overburden, 210 feet wide<br />
at 1,500 feet <strong>of</strong> overburden, 310 feet wide at 2,000 feet <strong>of</strong> overburden, <strong>and</strong> 430 feet wide at<br />
2,500 feet <strong>of</strong> overburden). As indicated in Table 9, the recommended barrier width using this<br />
approach is 357 feet for 2,160 feet <strong>of</strong> overburden (the depth at which pillar recovery was<br />
ab<strong>and</strong>oned in the North Barrier section). Although this approach generates a narrower barrier<br />
width than what AAI had calculated in 2000, the recommended width is still nearly three times<br />
larger than the 130-foot width determined through numerical modeling in AAI’s 2006 studies.<br />
111
Also, the 130-foot dimension is approximately half the width that the barrier design equations<br />
would recommend for a depth <strong>of</strong> 2,000 feet. This is significant since about 25% <strong>of</strong> the Main<br />
West North <strong>and</strong> South Barriers have overburden exceeding 2,000 feet. Whereas the numerical<br />
model results for barrier design in the May 2000 study were consistent with empirical design<br />
equations, the 2006 results were not.<br />
AAI did not consider the empirical equations in 2006 because they considered them less relevant<br />
to the North <strong>and</strong> South Barrier mining scenarios. Similarly, they discounted the relevance <strong>of</strong> the<br />
May 2000 study since it addressed barriers to protect a two-entry bleeder system (i.e., to limit the<br />
effects <strong>of</strong> longwall mining-induced stresses) rather than a pillar recovery section. However, a<br />
comparison to either <strong>of</strong> these results would have indicated that AAI’s 2006 model results were<br />
flawed. AAI’s report on the 2000 barrier design project concludes that “To minimize any<br />
potential for stress overloading resulting from panel mining, or to minimize maintenance <strong>and</strong> to<br />
provide long term stability (greater than three years), a barrier pillar <strong>of</strong> 400 ft would be<br />
required.” Regardless <strong>of</strong> the relevance <strong>of</strong> the scenario, this conclusion contradicts the 2006<br />
conclusion that “For the current geometry, stress levels taper to near pre-mining (in situ) stress<br />
levels approximately 100 ft into the barrier, indicating that the proposed 130-ft-wide barrier will<br />
limit exposure <strong>of</strong> the planned entries <strong>and</strong> pillars to most <strong>of</strong> the abutment.”<br />
Abutment stresses are transferred from extracted areas to adjacent workings (see Figure 35). The<br />
stresses are highest near pillared areas (referred to as “gob”) <strong>and</strong> diminish with distance. Rules<br />
<strong>of</strong> thumb used to estimate abutment stress transfer distance are discussed in Appendix T.<br />
However, longer transfer distances have been observed in some mines in the Wasatch Plateau.<br />
In a paper titled “Long load transfer distances at the Deer Creek <strong>Mine</strong>,” Goodrich et al. 9 wrote:<br />
Load transfer distances at the Deer Creek mine (including other mines in the<br />
Wasatch <strong>and</strong> Book Cliff Coal Fields) have been generally greater than predicted<br />
using empirical design methods (Koehler & Tadolini 1995 8 , Abel 1988 10 ,<br />
Barrientos & Parker 1974 11 ). The long load transfer distances observed in the<br />
case <strong>of</strong> the 5 th <strong>and</strong> 4 th West panels is believed to be due to the strong <strong>and</strong> stiff<br />
s<strong>and</strong>stone/siltstone strata in the overburden, including the Upper Blackhawk<br />
strata <strong>and</strong> the Castlegate S<strong>and</strong>stone.”<br />
Similar long abutment stress transfer distances are implicit in a discussion <strong>of</strong> barrier sizing in a<br />
paper titled “Interpanel Barriers for Deep Western U.S. Longwall Mining 12 .” Although<br />
numerical models described in the paper address a longwall mining scenario, they demonstrate<br />
that wide barriers (e.g., 390 feet wide at depths <strong>of</strong> 2,600 feet) are required between panels to<br />
minimize abutment stress override. Cantilevered or overhanging strata are typically associated<br />
with high abutment stresses. The authors state that “Overhanging is likely in the Wasatch<br />
Plateau-Book Cliffs coal fields given the abundance <strong>of</strong> massive overburden strata, such as the<br />
Castlegate S<strong>and</strong>stone.”<br />
The authors or coauthors <strong>of</strong> each <strong>of</strong> the aforementioned papers were employees <strong>of</strong> AAI when the<br />
papers were written. Since the Upper Blackhawk <strong>and</strong> Castlegate s<strong>and</strong>stone units (see Figure 23)<br />
discussed in these papers are present at Cr<strong>and</strong>all Canyon <strong>Mine</strong>, AAI’s institutional knowledge<br />
should have indicated that the short abutment load transfer distance from the model results was<br />
not accurate. Similarly, since interpanel barriers are used at another UEI mine in the area, GRI<br />
also had pertinent institutional knowledge.<br />
112
Agapito Associates, Inc. Analyses<br />
AAI used LaModel to analyze room <strong>and</strong> pillar workings in the North Barrier section. The initial<br />
analyses focused on development mining in the area <strong>and</strong> calibration <strong>of</strong> the model to historical<br />
conditions in the 1 st North pillar panels, which were developed in a herringbone pattern <strong>and</strong><br />
retreated using a continuous haulage system. Results <strong>of</strong> this work were reported in a<br />
July 20, 2006, draft letter report to Laine Adair (see Appendix F). AAI concluded that the<br />
section design should function adequately for short-term mining in the barriers. Model results<br />
indicated that side-abutment stress from the adjacent longwall would be limited in extent (about<br />
130 feet) <strong>and</strong>, thus, stress conditions would be controlled by the depth <strong>of</strong> cover <strong>and</strong> not by<br />
abutment loads.<br />
AAI subsequently was contracted to do additional LaModel analyses to evaluate pillar recovery<br />
in the North Barrier section. These results were reported in an email dated August 9, 2006, from<br />
Leo Gilbride to Laine Adair (see Appendix G). In this instance, ARMPS was used to<br />
supplement the LaModel analysis. AAI reported that “Conclusions from LAMODEL<br />
corroborate the ARMPS results, principally that convergence can be adequately controlled with<br />
the proposed mine plan <strong>and</strong> that ground conditions should be generally good on retreat in the<br />
barriers, even under the deepest cover (2,200 ft ).”<br />
AAI concluded that the ground conditions they observed on December 1, 2006, agreed with their<br />
analytical predictions (i.e., LaModel results). However, the predictions themselves were<br />
inaccurate <strong>and</strong> misleading. Both the LaModel <strong>and</strong> ARMPS analyses used either inappropriate<br />
input values or an overly optimistic design approach that negatively affected the reliability <strong>of</strong> the<br />
results, as discussed below.<br />
Boundary Element Modeling. The July 20, 2006, report prepared by AAI describes the<br />
procedures used to develop a numerical model for mining in the North Barrier section. The<br />
report also includes two tables that list input parameters that were used in the final, “calibrated”<br />
model. The first table lists coal material properties developed using equations included in the<br />
report. The second table lists additional parameters that reportedly were “based principally on<br />
previous modeling studies for the Cr<strong>and</strong>all Canyon <strong>Mine</strong>.” However, examination <strong>of</strong> the actual<br />
LaModel input files demonstrates that many <strong>of</strong> the input parameters were much different than<br />
those shown in the report <strong>and</strong> were not consistent with those used in previous Cr<strong>and</strong>all Canyon<br />
<strong>Mine</strong> models.<br />
Coal Properties. AAI used both strain s<strong>of</strong>tening <strong>and</strong> elastic coal properties in their Cr<strong>and</strong>all<br />
Canyon <strong>Mine</strong> models. Strain s<strong>of</strong>tening implies that an element <strong>of</strong> coal will carry increasing<br />
loads up to a peak value before it then fails. At failure, the element loses strength <strong>and</strong>,<br />
subsequently, it is only able to carry a lesser, “residual,” load. The methodology for using strain<br />
s<strong>of</strong>tening properties described in AAI’s July 20 report is very similar to that used by <strong>MSHA</strong><br />
Technical Support (see Appendix U). The methodology assumes that elements farther away<br />
from an entry will fail at progressively higher peak loads <strong>and</strong> also maintain higher residual loads.<br />
This approach is based largely on the premise that coal strength increases with lateral<br />
confinement <strong>and</strong> lateral confinement increases with distance from the pillar edge.<br />
Traditionally, the effect <strong>of</strong> confinement on pillar strength has been incorporated into BEM<br />
models by representing an individual pillar as a series <strong>of</strong> concentric rings (Figure 69A). Letter<br />
codes are used to represent various material properties <strong>and</strong> the codes are deployed such that<br />
material strength increases toward the pillar center. In reality, pillar corners experience less<br />
confinement <strong>and</strong>, consequently, have lower peak strengths. The LaModel preprocessing<br />
113
program, LamPre, <strong>of</strong>fers a utility to calculate coal properties to account for the weakening at<br />
pillar corners <strong>and</strong> another to deploy them (automatic yield zone application) as illustrated in<br />
Figure 69B. The preprocessor provides a user-friendly interface to facilitate the construction <strong>of</strong><br />
model grids; letter codes (material properties) can be arranged manually in any configuration.<br />
The automatic yield zone application available in LamPre provides a convenient means <strong>of</strong><br />
distributing codes as illustrated in Figure 69B. However, the material properties assigned to the<br />
letter codes must be determined specifically for this configuration (i.e., they must be calculated<br />
to represent side <strong>and</strong> corner elements).<br />
AAI correctly calculated coal properties as indicated in their report using the methodology<br />
described in Appendix F. The results <strong>of</strong> these calculations are listed in Table 10. Each <strong>of</strong> the<br />
eight sets <strong>of</strong> values listed in Table 10 corresponds to coal strengths at successively deeper<br />
distances into the pillar on 5-foot intervals. The values were then entered manually into the<br />
LaModel preprocessor program, LamPre. These values are consistent with a model constructed<br />
as shown in Figure 69A. AAI entered the material properties manually <strong>and</strong> then used the<br />
automatic yield zone application to deploy them as shown in Figure 69B. As a result, the<br />
distribution <strong>of</strong> lettered elements used to represent the material properties was incorrect.<br />
Table 10 - Coal Properties Calculated by AAI<br />
A<br />
B<br />
Figure 69 – Plan View <strong>of</strong> Pillars showing Coal Property Elements<br />
as Indicated in AAI <strong>Report</strong> vs. Those Actually Deployed in AAI Modeling<br />
114
The significance <strong>of</strong> this error was that modeled pillars up to 40 feet wide appear to be much<br />
stronger than they actually are (approximately 60% greater peak strength <strong>and</strong> 160% greater<br />
residual strength). Furthermore, pillars over 40 feet wide contain elastic elements with no limit<br />
on their load carrying capability. Elastic elements are infinitely strong.<br />
Elastic elements are used routinely in boundary element models. However, Karabin <strong>and</strong> Evanto<br />
pointed out in a 1999 publication 13 , “Known or potentially yielding pillars should not contain<br />
linear-elastic elements which could erroneously affect the stress transfer to adjacent areas.”<br />
The implication <strong>of</strong> using elastic elements in the Cr<strong>and</strong>all Canyon <strong>Mine</strong> model was that the cores<br />
<strong>of</strong> modeled pillars in the North <strong>and</strong> South Barrier sections <strong>and</strong> in the sealed portion <strong>of</strong> the Main<br />
West entries would never fail regardless <strong>of</strong> the applied load. Elastic conditions (unlimited<br />
strength) is inconsistent with the known conditions discussed in AAI’s May 3, 2006, project<br />
proposal for the Main West Barrier mining study, which stated that “time-dependent pillar<br />
convergence existed in the sealed portion <strong>of</strong> the Main West.” The model, as constructed with the<br />
associated rock mass <strong>and</strong> gob properties, was incapable <strong>of</strong> demonstrating pillar failure,<br />
subsequent yielding, <strong>and</strong> stress transfer (domino failure) over a broad area.<br />
Rock Mass Properties. One significant difference between EXPAREA, the program<br />
originally used to develop a calibrated Cr<strong>and</strong>all Canyon <strong>Mine</strong> model, (see Appendix R) <strong>and</strong><br />
LaModel relates to the representation <strong>of</strong> the rock above <strong>and</strong> below the seam (rock mass). In<br />
EXPAREA <strong>and</strong> most other boundary element models, the rock mass is comprised <strong>of</strong> a single<br />
(homogeneous elastic) unit <strong>of</strong> material. In LaModel, the rock mass is represented as a stack <strong>of</strong><br />
layers piled atop one another. The layered formulation used in LaModel provides an additional<br />
parameter that can be adjusted to allow more flexible <strong>and</strong> realistic strata behavior. Rock mass<br />
behavior in this model is controlled by both the assigned material properties <strong>and</strong> layer thickness.<br />
In selecting parameters for the laminated rock mass in LaModel, AAI evaluated two lamination<br />
thicknesses (25 <strong>and</strong> 50 feet). AAI concluded there was no difference between the two values <strong>and</strong><br />
the smaller value was selected.<br />
In his doctoral thesis, Dr. Heasley included equations that could be used to estimate properties<br />
that would equate the laminated strata behavior with the homogeneous rock mass used in other<br />
boundary element programs (see Appendix V). Equating the parameters used in the calibrated<br />
EXPAREA model to LaModel suggests that a 115-foot thickness would have been more<br />
appropriate than the 25-foot value that AAI used. The implication <strong>of</strong> using thin laminations is<br />
that the ro<strong>of</strong> tends to sag readily into the mine openings <strong>and</strong> load the edges <strong>of</strong> the pillars.<br />
Conversely, the rock mass is less apt to span across openings or failing pillars <strong>and</strong> transfer loads<br />
over a longer distance.<br />
Gob Properties. The last <strong>of</strong> the three critical components <strong>of</strong> a boundary element model is the<br />
gob. Gob properties are extremely important in these models because they influence the amount<br />
<strong>of</strong> abutment load transferred from a gob area to adjacent structures. However, there are few<br />
established guidelines for selecting them. In the absence <strong>of</strong> field data, modelers <strong>of</strong>ten rely on a<br />
fundamental underst<strong>and</strong>ing <strong>of</strong> the influence <strong>of</strong> gob parameters <strong>and</strong> various rules <strong>of</strong> thumb based<br />
on personal experience.<br />
With regard to gob modulus (an input parameter), Michael Hardy (AAI Principal) stated in an<br />
interview with the investigation team that “it's very important because it controls the load<br />
transfer through the gob…we tweak that a lot to try <strong>and</strong> get the right load transfer through the<br />
gob. And this is a very important parameter. It's a very difficult parameter because we have<br />
115
very little feedback from the field that says this is the stress on the gob. It's the biggest --- quite<br />
possibly the biggest parameter that's used in interpreting load transfer from a gob into the<br />
barrier pillars <strong>and</strong> surrounding area.” The EXPAREA model that AAI had previously<br />
calibrated to Cr<strong>and</strong>all Canyon <strong>Mine</strong> conditions used a bilinear gob model. Although a bilinear<br />
gob model is available for use in LaModel, AAI elected to use the default material, strainhardening<br />
gob, instead.<br />
The LaModel preprocessor, LamPre, includes a utility to assist users in selecting a final gob<br />
modulus for the strain-hardening gob element. As written in the program Help file, this utility<br />
“is intended to simplify the task <strong>of</strong> determining gob material properties <strong>and</strong> to allow the user to<br />
obtain fairly accurate gob properties in the initial model run.” Typically, the user inputs the<br />
width <strong>of</strong> the gob area <strong>and</strong> the estimated peak stress on the gob, <strong>and</strong> the utility returns a final gob<br />
modulus which provides a starting point for calibration.<br />
The parameters that AAI used in the LamPre gob property utility are not available since these<br />
data are not retained in the LaModel input files. Furthermore, given the number <strong>of</strong> variables that<br />
can affect the utility’s output, it is impossible to replicate the process. However, it appears that<br />
the effects <strong>of</strong> thin lamination thickness <strong>and</strong> perhaps a very wide gob resulted in a very low final<br />
gob modulus value.<br />
The effects <strong>of</strong> a very low gob modulus are readily apparent in the LaModel convergence results.<br />
In models <strong>of</strong> the North <strong>and</strong> South Barrier sections that used this value, LaModel convergence<br />
results actually exceeded the height <strong>of</strong> the mined openings over broad areas <strong>of</strong> the model. The<br />
modeled entry height was 8 feet but maximum convergence in some <strong>of</strong> the models exceeded 20<br />
feet, which is physically impossible. Although the excessive convergence values are evident in<br />
the LaModel postprocessor, LamPost, they are not evident in illustrations provided in AAI’s<br />
reports due to the manner in which the output data were scaled.<br />
Scale Selection for Illustration. Each <strong>of</strong> the reports that AAI prepared for GRI included<br />
numerous illustrations. Typically, color figures were provided to illustrate the distribution <strong>of</strong><br />
vertical stress, convergence, <strong>and</strong> yield condition in plan view. The July 20, 2006, report<br />
(Appendix F), for example, included 21 colored plan view figures, two cross-section views, <strong>and</strong><br />
one mine map. All <strong>of</strong> the vertical stress figures included a key that ranged from 0 to 10,000 psi.<br />
However, one <strong>of</strong> the cross-section figures shows that peak stresses in excess <strong>of</strong> 30,000 psi occur<br />
near the barrier rib adjacent to the longwall gob. Thus, a more appropriate label for the key in<br />
the plan view figure would indicate that the highest color range includes all vertical stress levels<br />
greater than 9,000 psi.<br />
It is common practice to scale numerical model results to highlight particular points or ranges <strong>of</strong><br />
interest. For example, even though safety factors may range from near 0 to 6 in a given<br />
(hypothetical) model, it may be beneficial to illustrate the range between 0 <strong>and</strong> 2. Since safety<br />
factors below one indicate failure, this range would show the most critical areas. Similarly, AAI<br />
focused on a range <strong>of</strong> convergence from 0 to 2 inches because they associated 2 inches <strong>of</strong><br />
convergence with difficult ro<strong>of</strong> conditions. Although this scale highlighted a range <strong>of</strong> interest,<br />
another implication was that the scale masked unreasonably high levels <strong>of</strong> convergence that were<br />
present elsewhere in the model. The range used in the vertical stress plan views had a similar<br />
effect. Vertical stress levels in these plots appeared to be reasonable even though peak values in<br />
some <strong>of</strong> the models actually exceeded 90,000 psi.<br />
116
Model Calibration. In the initial proposal to model Main West Barrier mining, AAI<br />
indicated that two previous pillar recovery areas would be used for calibration purposes. One<br />
area was South Mains, which was recovered between August 2005 <strong>and</strong> October 2006. The<br />
second was the 1 st North panels that were recovered between February 1992 <strong>and</strong> August 1994.<br />
Ultimately, however, AAI opted to calibrate the model based only on the 1 st North Left Panels.<br />
In a paper titled “Experience with the Boundary Element Method <strong>of</strong> Numerical Modeling as a<br />
Tool to Resolve Complex Ground Control Problems” Karabin <strong>and</strong> Evanto 14 outlined a procedure<br />
for creating <strong>and</strong> using effective boundary element models. Their recommended simulation<br />
process flow chart is illustrated in Figure 70. The first four steps <strong>of</strong> the flow chart in Figure 70<br />
represent the model calibration portion <strong>of</strong> the simulation process. The authors emphasize that<br />
underground observations are an essential first step in any modeling effort. They recommend<br />
that several areas be evaluated <strong>and</strong> they describe a system <strong>of</strong> mapping that can be used to<br />
quantify various observed ground conditions for later use in model validation. The authors stress<br />
that verifying model accuracy (i.e., validation) is the most critical step in the entire simulation<br />
process. If model results do not correlate reasonably well with observed conditions, the<br />
calibration process must continue (i.e., material properties must be adjusted).<br />
Figure 70 - Simulation Process Flow Chart<br />
117
AAI’s LaModel model was calibrated to Cr<strong>and</strong>all Canyon <strong>Mine</strong> ground conditions by adjusting<br />
input parameters until model results were consistent with mining conditions reported to have<br />
existed in the 1 st North Left panels. AAI personnel could not make underground observations in<br />
these inaccessible panels, but relied instead on descriptions <strong>of</strong> the ground conditions provided by<br />
GRI.<br />
AAI claimed that they calibrated the LaModel program using three criteria: vertical stress,<br />
convergence, <strong>and</strong> yielding condition. Lamination thicknesses <strong>and</strong> coal strength were varied to<br />
gauge the sensitivity <strong>of</strong> model results, reportedly to calibrate to all three input criteria. In their<br />
written response to the accident investigation team, AAI indicated that this activity resulted in a<br />
calibrated model that simultaneously fit all three criteria. However, interview statements <strong>of</strong> the<br />
AAI engineer that did the modeling reveal that the calibration process relied exclusively on an<br />
evaluation <strong>of</strong> pillar yield condition. Coal strength was adjusted until pillars in the first pillar row<br />
<strong>of</strong> the 1 st North, 9 th Left Panel (immediately north <strong>of</strong> Main West crosscut 99) yielded during<br />
panel retreat while the outby rows did not (Figure 71).<br />
Figure 71 - Modeled Yield Condition - Partial Retreat in 9th Left Panel<br />
While mining the 9 th Left panel, difficult ro<strong>of</strong> conditions were encountered (i.e., “peeling top<br />
coal”) on the pillar line. AAI noted that 2.0 inches or more <strong>of</strong> convergence was associated with<br />
the yielded pillar row in their “calibrated” model. Thus, 2.0 inches <strong>of</strong> convergence was<br />
considered a site-specific indicator <strong>of</strong> potential ro<strong>of</strong> <strong>and</strong> rib instability for subsequent predictive<br />
models.<br />
118
AAI also interpreted abutment stress transfer from their model <strong>of</strong> the completed 9 th Left Panel.<br />
As illustrated in Figure 72, AAI’s model included mining that was done north <strong>of</strong> the Main West<br />
entries. This northward extension <strong>of</strong> Main West (labeled “Area A” in Figure 72) was developed<br />
intermittently between 2003 <strong>and</strong> 2005 <strong>and</strong> approached to within about 145 feet <strong>of</strong> the 9 th Left<br />
Panel. AAI interpreted model results to show “no significant side abutment stress override<br />
across the barrier on the main pillars, consistent with actual conditions.” Since this<br />
interpretation appears in a report section titled “1 st North Left Panels Back-Analysis,” it appears<br />
to be intended to support the validity <strong>of</strong> AAI’s model. However, the interpretation actually does<br />
little to verify that abutment stress transfer in AAI’s model is reasonable.<br />
Underground observations made by the accident investigation team (in Area A, Figure 72)<br />
confirmed that there were no significant effects <strong>of</strong> abutment stress transfer from the adjacent<br />
9 th Left Panel. However, this observation does not validate AAI’s model results. Given the<br />
geometry, substantial abutment stress effects would not be anticipated to occur in Area A. The<br />
center <strong>of</strong> this area is bounded by unrecovered pillars in the 9 th Left Panel. One end <strong>of</strong> the area is<br />
bounded by solid coal <strong>and</strong> the other by a barrier <strong>and</strong> unmined pillars <strong>of</strong> the 1 st Right Mains. A<br />
more appropriate method <strong>of</strong> validating model behavior is to correlate model results with stress<br />
damage (e.g., ro<strong>of</strong> or rib deterioration) rather than a lack <strong>of</strong> damage.<br />
Area A<br />
Figure 72 - Modeled Vertical Stress – Retreat Completed in 9th Left Panel<br />
119
After the initial calibration process based on 1 st North Panels, AAI had two opportunities to<br />
verify that model results were consistent with actual observed conditions at the mine. The first<br />
opportunity was in December 2006 when AAI personnel visited the site specifically to view<br />
ground conditions under deep cover. At that time, AAI viewed conditions as being “consistent<br />
with analytical predictions.” Mining had not advanced into the deepest overburden at the time <strong>of</strong><br />
the site visit. No modifications were made to the Cr<strong>and</strong>all Canyon <strong>Mine</strong> model as a result <strong>of</strong><br />
AAI’s December 1, 2006, visit.<br />
The second opportunity was after the March 10 pillar burst. AAI was notified by GRI <strong>of</strong> the<br />
event <strong>and</strong> Hardy <strong>and</strong> Gilbride traveled to the site on March 16. When asked “What conclusions<br />
did AAI personnel draw from the conditions observed on the North Barrier section regarding the<br />
adequacy <strong>of</strong> the design process (e.g,. models) that had been used,” AAI responded that “The<br />
bump occurrence in the North Barrier was limited to six or seven pillars <strong>and</strong> did not extend<br />
outby. The observation <strong>of</strong> this condition seemed to be consistent with the modeling results, i.e.<br />
bump occurred only around the edges <strong>of</strong> the pillars. Based on the observations in the North<br />
Barrier, further analysis was completed using the established models <strong>and</strong> a change in the plan<br />
for mining the South Barrier was recommended to reduce bump risk.”<br />
Photographs, sketches, <strong>and</strong> interview statements <strong>of</strong> others indicate that the area affected by the<br />
burst was not limited to six or seven pillars <strong>and</strong> did extend outby. BLM’s Falk noted, for<br />
example, that “Entry ways outby two breaks from the face had extensive rib coal thrown into the<br />
entry way. Stress overrides outby the face were very concerning.” AAI’s field notes also<br />
suggest that the damage was more widespread (see Figure 73). The remnants <strong>of</strong> damaged pillars<br />
are sketched inside the original pillar boundaries as indicated by the orange lines in the figure.<br />
Photographs taken in this area during AAI’s March 16 visit are included in Appendix O.<br />
Figure 73 - Notes Made by AAI on March 16, 2007<br />
(orange lines added for emphasis)<br />
120
AAI attributed the March burst to a lagging cave inby crosscut 138 <strong>and</strong> the start-up cave between<br />
crosscuts 134 <strong>and</strong> 135 based on their onsite observations. The model grid was changed to reflect<br />
this condition. Open entries (as opposed to gob material) were used to represent the areas<br />
between crosscuts 134 to 135 <strong>and</strong> 138 to 139. However, this change had a negligible effect on<br />
the model results. Since the gob modulus used in both models was very low, the amount <strong>of</strong> load<br />
transmitted to the gob (rather than transferred to adjacent pillars) was small in either case.<br />
Models run by the accident investigation team indicated that peak stress in the gob only<br />
increased by approximately 7 psi when the lagging cave was replaced with AAI’s low gob<br />
modulus.<br />
Models that AAI developed after the March bursts indicated that high stresses were concentrated<br />
in the area between these two partially caved or un-caved gobs (see Figure 74). A comparison <strong>of</strong><br />
Figure 73 <strong>and</strong> Figure 74 indicates that, even with the lagging cave incorporated into the model,<br />
high vertical stresses do not coincide with the extent <strong>of</strong> damage observed in the mine. Modeled<br />
vertical stresses in pillars between crosscuts 136 <strong>and</strong> 137 appear to be quite similar to stress<br />
levels in pillars outby crosscut 133. Furthermore, the pillars outby 133 appear to be largely<br />
unaffected by stress transfer from either the longwall gob to the north or the un-caved pillared<br />
area between crosscuts 135 <strong>and</strong> 134. AAI postulated that a dynamic failure (a localized burst) <strong>of</strong><br />
these pillars could have propagated to pillars over a much wider area.<br />
Figure 74 - AAI Model Results <strong>of</strong> Vertical Stress in March 2007 Burst Area<br />
The changes that AAI made to their numerical model after the March bursts did not constitute a<br />
recalibration <strong>of</strong> the model to the observed ground conditions. Had the disparity between field<br />
conditions <strong>and</strong> model results prompted a careful examination <strong>of</strong> model input <strong>and</strong> model<br />
recalibration, a properly constructed model would have shown that the South Barrier section<br />
mine design was destined to fail. The following section illustrates the output that can be derived<br />
by a properly constructed model using AAI’s reported parameters.<br />
BEM Using AAI Model Constructed as <strong>Report</strong>ed. LaModel analyses were conducted with<br />
coal properties distributed as outlined in the text <strong>of</strong> AAI’s July 20 report (Appendix F). Results<br />
indicate that pillars in the North <strong>and</strong> South Barrier sections would have failed over a relatively<br />
121
oad area (Figure 75). In this figure, red <strong>and</strong> yellow represent elements with a safety factor less<br />
than 1 (i.e., the element is considered to have failed).<br />
Figure 75 - Element <strong>Safety</strong> Factors with Coal Properties Distributed as Indicated in AAI <strong>Report</strong><br />
Figure 76 illustrates element safety factors from a simulation in which AAI’s model was further<br />
modified to reflect gob properties <strong>and</strong> lamination thicknesses more consistent with their<br />
calibrated EXPAREA model. In this case, a bilinear gob model was used rather than strain<br />
hardening <strong>and</strong> lamination thickness was increased to 115 feet rather than 25 feet. The greater<br />
thickness was established using an equation provided by Heasley 5 . Also, rather than modeling a<br />
single scenario as AAI had, mining in the North <strong>and</strong> South Barriers was modeled as three steps:<br />
(A) North Barrier pillar recovery to crosscut 133, (B) South Barrier development <strong>and</strong> (C) South<br />
Barrier pillar recovery to about crosscut 131. Results <strong>of</strong> these model steps are illustrated in<br />
Figure 76. Both models (Figure 75 <strong>and</strong> Figure 76) show widespread pillar failure.<br />
Element safety factors based on the modified model show pillar failure near the site <strong>of</strong> the March<br />
10 outburst accident (Figure 76 A). Pillar rib elements fail under the deepest cover but pillars<br />
remain stable as the South Barrier is developed (Figure 76 B). However, as pillars are recovered<br />
in the South Barrier, failure propagates outby the face <strong>and</strong> extends into the Main West <strong>and</strong> North<br />
Barrier section workings. Although the model does not match the observed damage as well as<br />
Dr. Heasley’s model, it is generally consistent with the failures that occurred in March <strong>and</strong><br />
August 2007 at Cr<strong>and</strong>all Canyon <strong>Mine</strong>. The modeling results illustrate that a properly<br />
constructed <strong>and</strong> calibrated model will depict that the South Barrier section pillar design is<br />
unstable <strong>and</strong> destined to wide spread failure.<br />
122
Figure 76 - Element <strong>Safety</strong> Factors using Modified Coal Strength Property<br />
Distribution, Gob Properties, <strong>and</strong> Lamination Thickness<br />
123
South Barrier Design. After the March burst, AAI changed their model to reflect a lagging<br />
cave but this change had very little impact on model results. The model used to evaluate designs<br />
for the South Barrier section was essentially the same as the model used to design the North<br />
Barrier section. Proposed design changes including longer crosscut spacing were evaluated.<br />
AAI had modeled the effects <strong>of</strong> longer crosscut spacing early in the Main West Barrier Mining<br />
project. Their earlier conclusion was that “increasing crosscut spacing does not significantly<br />
improve conditions.” Increased pillar length (reported as a 20-foot increase, but modeled as a<br />
10-foot increase from 70 to 80 feet) “only incrementally reduces rib yielding, corresponding to a<br />
modest decrease in entry convergence.” In the South Barrier section models, however, pillar<br />
length was increased by 37 feet (72 to 109 feet). AAI noted that modeled stresses in the<br />
projected South Barrier workings were similar to those experienced at the March burst site when<br />
crosscuts <strong>of</strong> similar length were used (see h<strong>and</strong>written notes, Figure 77). However, AAI<br />
concluded that the longer crosscut spacing “increases the size <strong>and</strong> strength <strong>of</strong> the pillars’<br />
confined cores, which helps to isolate bumps to the face <strong>and</strong> reduce the risk <strong>of</strong> larger bumps<br />
overrunning crews in outby locations.”<br />
Figure 77 - AAI Notation on Plot <strong>of</strong> Model Results<br />
Text boxes reflect h<strong>and</strong>written notes <strong>and</strong> were added for clarity.<br />
AAI’s model results with two different crosscut spacing distances are shown in Figure 78. The<br />
images are similar in the sense that high stresses are concentrated in pillar ribs adjacent to the<br />
exp<strong>and</strong>ing gob area. With longer pillars, the concentration appears to be reduced in the vicinity<br />
<strong>of</strong> the outby intersection. It is important to note, however, that the models did not evaluate pillar<br />
recovery on a cut-by-cut basis. When pillar cuts remove coal from the inby ends, the pillars in<br />
124
the active mining area are reduced in size. Consequently, some <strong>of</strong> the benefit <strong>of</strong> longer pillars in<br />
the active mining area is diminished as pillar recovery proceeds. The stress concentration will<br />
migrate towards the outby intersection as the pillar in the active mining area is reduced.<br />
Although the larger (i.e., longer) pillars used in the South Barrier were stronger than those used<br />
in the North Barrier, they were not sufficient to ensure the stability <strong>of</strong> these workings during<br />
pillar recovery. Given the aforementioned deficiencies, the models provided no insight into the<br />
“risk <strong>of</strong> larger bumps overrunning crews in outby locations.”<br />
Figure 78 – AAI Modeled Vertical Stress Results Comparing Effects <strong>of</strong> Crosscut Spacing<br />
ARMPS Analyses. As part <strong>of</strong> their evaluation <strong>of</strong> proposed mining in the North Barrier section,<br />
AAI performed calculations using NIOSH’s Analysis <strong>of</strong> Retreat Mining Pillar Stability<br />
(ARMPS) s<strong>of</strong>tware. Model procedures <strong>and</strong> results described in an August 9, 2006, email from<br />
Leo Gilbride to Laine Adair provide insight to these analyses. The available information<br />
demonstrates that much <strong>of</strong> AAI’s ARMPS analysis was consistent with NIOSH’s recommended<br />
use <strong>of</strong> the program. However, several assumptions led to overstated estimates <strong>of</strong> stability. In<br />
addition, calculations indicating extremely low pillar stability factors for the South Barrier<br />
analysis were either misinterpreted or not acted upon.<br />
ARMPS Input. AAI calculated stability factors (StF’s) for the 1 st North Panels <strong>and</strong> for the<br />
North Barrier section. The calculations were performed using default values available in<br />
ARMPS. For example, the analyses relied on default values for in situ coal strength (900 psi),<br />
unit weight <strong>of</strong> overburden (162 lb/ft 3 ), abutment angle <strong>of</strong> gob (21º) <strong>and</strong> extent <strong>of</strong> the active<br />
mining zone (AMZ). Using these values <strong>and</strong> the geometries illustrated in Figure 79, AAI<br />
determined that the minimum pillar stability factor (PStF) in the 1 st North Panels was 0.37.<br />
125
Minimum PStF in the North Barrier section was 0.53 at 2,000 feet <strong>of</strong> overburden. These values<br />
(0.37 <strong>and</strong> 0.53) are generally consistent with the PStF values discussed earlier in Table 5 <strong>and</strong><br />
Table 7 (Method 1 – 215-foot barrier). However, it is important to note that Method 1 overstates<br />
the benefit <strong>of</strong> leaving a row <strong>of</strong> bleeder pillars. More conservative estimates <strong>of</strong> PStF at 2,000 feet<br />
<strong>of</strong> overburden, obtained using Methods 2 <strong>and</strong> 3, are 0.29 <strong>and</strong> 0.27, respectively.<br />
Figure 79 - ARMPS Analysis Geometries used by AAI<br />
Back-Analysis. NIOSH provides the following guidance for developing site-specific criteria<br />
in one <strong>of</strong> the resource files 15 provided in the ARMPS Help file:<br />
“ARMPS appears to provide good first approximations <strong>of</strong> the pillar sizes<br />
required to prevent pillar failure during retreat mining. In an operating mine,<br />
past experience can be incorporated directly into ARMPS. ARMPS stability<br />
factors can be back-calculated for both successful <strong>and</strong> unsuccessful areas. Once<br />
a minimum ARMPS stability factor has been shown to provide adequate ground<br />
conditions, that minimum should be maintained in subsequent areas as changes<br />
126
occur in the depth <strong>of</strong> cover, coal thickness, or pillar layout. In this manner,<br />
ARMPS can be calibrated using site-specific experience.”<br />
Back-analysis is considered an acceptable practice for mines with a proven track record <strong>of</strong> retreat<br />
mining experience. However, site-specific criteria used in lieu <strong>of</strong> NIOSH’s recommendations<br />
should be developed cautiously using multiple case histories with known conditions at a given<br />
mine. In these cases, proper examinations <strong>of</strong> individual mine data may demonstrate that stability<br />
factors above or below NIOSH’s recommended values are warranted. Proper examination must<br />
entail an analysis <strong>of</strong> the broad experience at a mine site rather than a focus on isolated case(s)<br />
that represent the extreme.<br />
AAI used default input parameters (including 900 psi coal strength) in their ARMPS analyses.<br />
Therefore, the resulting stability factors could be compared directly to those comprising the<br />
NIOSH database. AAI considered the database <strong>and</strong> observed that:<br />
“The ARMPS database shows that industry experience is mixed for mines<br />
reporting similar SFs (0.16 to 1.05) at comparable depths (1,500 to 2,000 ft). Of<br />
these cases, slightly more than half were successful, while the remainder<br />
encountered ground control problems.”<br />
This observation is accurate. Eleven <strong>of</strong> 21 cases at depths greater than 1500 feet were deemed to<br />
be satisfactory designs. Difficult ground conditions were attributed to the remaining ten.<br />
Similarly, five <strong>of</strong> ten cases with PStF’s less than 0.53 (i.e., the PStF value they determined for<br />
the proposed North Barrier section) were satisfactory <strong>and</strong> the other five experienced difficulties<br />
(see Figure 80). It is noteworthy that in all <strong>of</strong> the “failed” cases, NIOSH indicated some degree<br />
<strong>of</strong> pillar “bumping” was involved.<br />
Figure 80 - Pillar Stability Factors from NIOSH ARMPS Database for Depths Over 1,500’<br />
NOTE: NIOSH ARMPS Database only contains case histories at or below 2,000’ overburden.<br />
127
AAI recognized that the North Barrier section pillar stability factors they had calculated were<br />
below the NIOSH recommended minimum. AAI reasoned that since the 1 st North Left block<br />
panels had been mined successfully with a PStF <strong>of</strong> 0.37, the North Barrier section with a PStF <strong>of</strong><br />
0.53 should be acceptable:<br />
“At GENWAL [Cr<strong>and</strong>all Canyon <strong>Mine</strong>] good success has been achieved at SFs<br />
below 0.90. Retreat conditions in the 1st North Left block were generally<br />
successful with a SF <strong>of</strong> 0.37, suggesting that a SF <strong>of</strong> about 0.40 is a reasonable<br />
lower limit for retreat mining at GENWAL…The lowest SF for the proposed<br />
retreat sequence in Main West barriers is 0.53 under the deepest cover, which is<br />
approximately 43% higher than the "satisfactory" SF <strong>of</strong> 0.37 for the 1st North<br />
Left block. Implications are that the proposed retreat sequence in Main West will<br />
be successful in terms <strong>of</strong> ground control, even under the deepest cover (2,200 ft).”<br />
However, AAI’s back-analysis was flawed in several ways. First, the panels in 1 st North Panels<br />
were considered to be satisfactory designs despite the fact that pillar rows were skipped in each<br />
<strong>of</strong> the last four panels near the deepest cover. This assumption was made even though AAI, <strong>and</strong><br />
GRI personnel who provided information to AAI, did not have personal experience with mining<br />
in these areas. <strong>Mine</strong> personnel related problems associated with ro<strong>of</strong> coal <strong>and</strong> AAI considered<br />
this from the st<strong>and</strong>point that similar problems would not be anticipated in the North <strong>and</strong> South<br />
Barrier sections:<br />
“…occasional problems with peeling top coal were encountered in the 1st North<br />
Left block. This required skipping pillars on retreat in some locations. Top coal<br />
is currently mined to minimize this risk <strong>and</strong> is not expected to be a problem in<br />
Main West.”<br />
It is highly speculative to conclude that additional problems would not have been encountered<br />
had the top coal been mined in these areas. Furthermore, reports indicate that ground control<br />
problems were not limited to spalling top coal. Two injuries caused by ground failures (a burst<br />
<strong>and</strong> a rib roll associated with a bounce) were reported during pillar recovery in the 1 st North<br />
7 Left panel.<br />
Second, AAI’s analysis considered GRI’s pillar recovery experience in the 1 st North Left Block<br />
panels but did not consider recovery work in the South Mains. GRI had much more recent<br />
experience <strong>and</strong> first h<strong>and</strong> knowledge <strong>of</strong> ground conditions during pillar recovery in this area<br />
since mining was not completed until October 2006. Although the South Mains pillars <strong>and</strong><br />
barriers were recovered in a different manner than the Main West Barriers, back-analysis would<br />
have demonstrated that PStF’s in the North <strong>and</strong> South Barrier sections were far lower than those<br />
associated with difficult conditions in the South Mains. Rather than anticipating ground<br />
conditions better than those encountered in the 1 st North Left Block panels, GRI <strong>and</strong> AAI should<br />
have expected conditions worse than those encountered in the deepest cover in the South Mains.<br />
Third, AAI’s analysis did not consider barrier pillar stability factors. In formulating their<br />
recommendations for stability factors in deep cover mining operations, NIOSH noted that the use<br />
<strong>of</strong> large barrier pillars in conjunction with reasonably sized pillars substantially increased the<br />
likelihood <strong>of</strong> successful pillar recovery in overburden greater than 1,000 feet. Minimum<br />
BPStF’s for panels in 1 st North <strong>and</strong> for recovery in the South Mains were 1.52 <strong>and</strong> 1.59,<br />
respectively. The back-analysis showed that pillar recovery at Cr<strong>and</strong>all Canyon <strong>Mine</strong><br />
historically had been conducted with barrier pillar stability factors (BPStF) exceeding 1.5, as<br />
shown in Figure 81. The minimum BPStF calculated for the North Barrier section varies from<br />
0.98 to 1.54. Method 1, representing the effect <strong>of</strong> combining the bleeder pillar <strong>and</strong> barrier pillar<br />
128
in ARMPS (i.e., assume the pillar is not developed) yielded the 1.54 BPStF value that is<br />
consistent with BPStF’s in the historical previously mined areas. However, Method 1 overstates<br />
the benefit <strong>of</strong> leaving bleeder pillars. Methods 2 <strong>and</strong> 3, which <strong>of</strong>fer more realistic approaches,<br />
both show that BPStF in the North Barrier design is well below those calculated for past Cr<strong>and</strong>all<br />
Canyon <strong>Mine</strong> pillar recovery areas.<br />
Finally, after the March 10 outburst accident, AAI again used ARMPS to evaluate several<br />
potential pillar designs for use in the South Barrier section. The analyses included a design<br />
similar to the one that was actually implemented. The ARMPS pillar stability factor for this<br />
design is 0.26 <strong>and</strong> the barrier pillar stability factor is 0.87 (yellow square in Figure 81). There<br />
are no indications that these values were included in any written report or email to GRI. AAI’s<br />
StF’s were based on a barrier width <strong>of</strong> 137 feet between the section <strong>and</strong> the worked out longwall<br />
Panel 13. When it was actually developed, the barrier width was reduced to 121 feet. For this<br />
scenario, the pillar <strong>and</strong> barrier pillar stability factors are 0.23 <strong>and</strong> 0.76, respectively. The South<br />
Barrier section PStF’s are below AAI’s mine-specific stability threshold <strong>of</strong> 0.4 <strong>and</strong> below the<br />
values associated with the March 10 outburst accident. Also, Figure 80 illustrates that the PStF<br />
values for the implemented South Barrier section pillar design at 2,000 feet <strong>of</strong> overburden are<br />
below all successful cases in the data base <strong>and</strong> equivalent to two failed cases. None <strong>of</strong> these<br />
ARMPS results were presented in the April 2007 AAI report for the South Barrier section design<br />
that <strong>MSHA</strong> considered in the plan approval process (see Appendix I).<br />
2.5<br />
Barrier Stability Factor (BPStF)<br />
2<br />
1.5<br />
1<br />
0.5<br />
0<br />
1 st North Panels 6 to<br />
9 Pillar Recovery<br />
NB Recovery Burst<br />
OB using Different<br />
Calculation Methods<br />
AAI South Barrier Pillar<br />
Recovery Calculation<br />
NIOSH Minimum PStF<br />
South Mains Pillar<br />
Recovery<br />
0 0.5 1 1.5 2<br />
Pillar Stability Factor (PstF)<br />
NIOSH Minimum BPStF<br />
Note: NB = North Barrier, SB = South Barrier, OB = Overburden<br />
1st North Panels 6 to 9 Recovery South Mains Pillar Recovery NB Burst OB Method 1 - 2160 OB<br />
NB Burst OB Method 2 - 2160 OB NB Burst OB Method 3 - 2160 OB AAI SB Recovery Calc - 2000 OB<br />
Figure 81 – Cr<strong>and</strong>all Canyon <strong>Mine</strong> ARMPS Stability Factors showing AAI South Barrier Calculations<br />
129
Ro<strong>of</strong> Control Plan<br />
Section 30 CFR 75.220(a)(1) requires each mine operator to develop <strong>and</strong> follow a ro<strong>of</strong> control<br />
plan, approved by the district manager, that is suitable to the prevailing geological conditions <strong>and</strong><br />
the mining system to be used at the mine. After reviewing the plan, the mine operator is notified<br />
in writing <strong>of</strong> the approval or denial <strong>of</strong> the proposed ro<strong>of</strong> control plan or proposed revision. At<br />
the time <strong>of</strong> the August 2007 accidents, the relevant portions <strong>of</strong> the approved ro<strong>of</strong> control plan<br />
consisted <strong>of</strong> the following:<br />
• A base plan approved July 3, 2002.<br />
• Added pages 21 through 94 concerning pillar recovery, approved September 5, 2003.<br />
• A site-specific plan for extraction <strong>of</strong> pillars in South Barrier section, dated May 16, 2007,<br />
<strong>and</strong> approved June 15, 2007.<br />
Several previous site specific ro<strong>of</strong> control plans had been approved for mining the North <strong>and</strong><br />
South Barrier sections. At the time <strong>of</strong> the August accidents, these plans had been terminated<br />
because mining had been completed in the affected areas:<br />
• A site-specific plan for development <strong>of</strong> North Barrier section, dated November 11, 2006,<br />
<strong>and</strong> approved November 21, 2006.<br />
• A site-specific plan for leaving ro<strong>of</strong> coal during development <strong>of</strong> North Barrier section,<br />
dated January 10, 2007, <strong>and</strong> approved January 18, 2007.<br />
• A site specific plan for pillar recovery in North Barrier section, dated December 20,<br />
2006, <strong>and</strong> approved February 2, 2007.<br />
• A site-specific plan for development <strong>of</strong> South Barrier section, dated February 20, 2007,<br />
<strong>and</strong> approved March 8, 2007.<br />
On July 20, 2006, a draft report <strong>of</strong> a geotechnical analysis for developing the North <strong>and</strong> South<br />
Barrier sections was sent from Gilbride to Adair (see Appendix F). The report concluded “that<br />
the proposed Main West 4-entry layout with 60-ft by 72-ft (rib-to-rib) pillars should function<br />
adequately for short-term mining in the barriers (i.e., less than 1 year duty)”. AAI conducted<br />
another geotechnical analysis, dated August 9, 2006, for recovering the pillars in the North <strong>and</strong><br />
South Barrier sections. The report for this analysis stated that “ground conditions should be<br />
generally good on retreat in the barriers, even under the deepest cover (2,200 feet)”. On<br />
September 8, 2006, GRI provided these reports to <strong>MSHA</strong> District 9 to justify approval <strong>of</strong> their<br />
proposed plans to mine the North <strong>and</strong> South Barrier sections. As part <strong>of</strong> the plan review <strong>of</strong> the<br />
AAI ARMPS analysis, <strong>MSHA</strong> District 9 conducted a back-analysis <strong>of</strong> the 1 st North 9 th Left<br />
Panel. The <strong>MSHA</strong> analysis determined that the pillar stability factor (PStF) should exceed 0.42<br />
for the proposed North <strong>and</strong> South Barrier recovery plans. No assessment was made for the<br />
required barrier pillar stability factor (BPStF). The <strong>MSHA</strong> ARMPS analysis is described in<br />
Appendix W.<br />
<strong>MSHA</strong>’s review <strong>of</strong> the August 9, 2006, AAI analysis for pillar recovery in the North <strong>and</strong> South<br />
Barrier sections raised several questions. On November 21, 2006, <strong>MSHA</strong> sent a letter to GRI<br />
stating that the pillar recovery plan could not be approved <strong>and</strong> listed the following deficiencies:<br />
1. In situ coal strength was estimated at 1640 psi. An explanation <strong>of</strong> how this strength was<br />
determined should be included. Typical coal strength values are much lower.<br />
2. The elastic modulus <strong>of</strong> coal was estimated at 500 ksi. An explanation <strong>of</strong> how this<br />
modulus was determined should be included. If experimental analysis <strong>of</strong> test samples<br />
130
was conducted, an explanation <strong>of</strong> the number <strong>of</strong> samples, the size <strong>of</strong> samples, <strong>and</strong> the<br />
testing method employed should be included in the submittal.<br />
3. The mine geometry employed in the computer model differs from the physical map<br />
geometry. This observation applies to the ARMPS model geometry employed in the<br />
analysis <strong>of</strong> the historical section <strong>and</strong> the projected sections.<br />
4. The LAMODEL analysis shows, that during pillaring, surrounding pillars exhibit<br />
yielding zones. This could indicate a violent outburst since the in-situ coal strength is<br />
stated as 1640 psi.<br />
5. A stability factor <strong>of</strong> 0.37 was determined by analyzing the pillars <strong>of</strong> 1 st North 9 th Left<br />
Panel. The analysis <strong>of</strong> this area was employed to determine the minimum stability factor<br />
for favorable retreat mining. This stability factor appears to be determined from where<br />
mining ceased due to poor ground control conditions. Therefore, a higher stability factor<br />
should be employed that ensures an adequate factor <strong>of</strong> safety.<br />
There was no written response from GRI to <strong>MSHA</strong>’s letter. However, Billy Owens discussed<br />
these inconsistencies with GRI in December 2006. Owens recalled that GRI provided the<br />
following explanations to address the deficiencies:<br />
1. Studies indicate that coal strengths for the Hiawatha seam range from 1,800 to<br />
4,000 psi <strong>and</strong>, therefore, the operator felt that the 1,640 psi coal strength was<br />
appropriate.<br />
2. AAI had instrumented the coal Hiawatha coal seam <strong>and</strong> determined that the elastic<br />
modulus <strong>of</strong> 500 ksi was typical.<br />
3. The ARMPS program is not designed to simulate a section that is recovering pillars but<br />
leaving an unmined pillar to establish a bleeder. AAI’s model incorporated the bleeder<br />
pillar as part <strong>of</strong> the barrier pillar. Also, the geometry that AAI used was from actual<br />
survey data provided by the operator.<br />
4. As long as the core was not overstressed, there was no bounce potential.<br />
5. The minimum stability factor <strong>of</strong> 0.40 was used, which was above the 0.37 threshold<br />
determined by back-analysis in 1 st North.<br />
Based on this information, Owens agreed with AAI’s analysis. However, approval <strong>of</strong> the North<br />
<strong>and</strong> South Barrier section recovery plans would only be granted if favorable conditions were<br />
observed during development.<br />
North Barrier Section - Development Plan. GRI submitted a ro<strong>of</strong> control plan for developing<br />
through the North Barrier section, dated November 11, 2006, which was approved by <strong>MSHA</strong> on<br />
November 21, 2006. The plan showed development <strong>of</strong> four entries through the barrier. The plan<br />
specified a minimum <strong>of</strong> 80 x 90-foot centers, which could vary depending upon conditions<br />
encountered. The plan required a minimum 130-foot barrier to the north. The width was not<br />
specified for the barrier to the south.<br />
Density <strong>of</strong> the primary ro<strong>of</strong> support during development <strong>of</strong> the North Barrier section was six<br />
bolts per row with a maximum distance <strong>of</strong> five feet between rows. This bolting pattern had been<br />
used routinely for many years even though it had not been specified previously in the ro<strong>of</strong><br />
131
control plan. The entries <strong>and</strong> crosscuts were to be mined a maximum <strong>of</strong> 20 feet wide. No ro<strong>of</strong><br />
coal was to be left in this area.<br />
Owens <strong>and</strong> Peter Del Duca visited the developing North Barrier section on January 9, 2007, to<br />
assess <strong>and</strong> investigate the conditions for the pillar recovery plan, dated December 20, 2006. At<br />
that time, the section had advanced past the deepest overburden to about crosscut 141 which was<br />
beneath approximately 2,000 feet <strong>of</strong> overburden. This inspection was purposely scheduled so<br />
that conditions could be observed under the deepest cover prior to approval <strong>of</strong> the pillar recovery<br />
plan. Owens considered pillar yielding that he observed to be acceptable. However, weak ro<strong>of</strong><br />
rock was falling out during mining. He discussed with GRI the possibility <strong>of</strong> leaving ro<strong>of</strong> coal to<br />
prevent this. Prior experience had shown that ro<strong>of</strong> coal would help support the weak rock. The<br />
plan was revised on January 18, 2007, to permit leaving ro<strong>of</strong> coal. Where ro<strong>of</strong> coal was left, the<br />
minimum length <strong>of</strong> bolt was required to be six feet.<br />
Owens also observed that there was a need for ro<strong>of</strong>-to-floor support in the crosscut between the<br />
Nos. 3 <strong>and</strong> 4 entries. Since the No. 4 entry was the future bleeder entry after pillar recovery<br />
started, he informed GRI that additional ro<strong>of</strong> support would be needed in this crosscut for<br />
approval <strong>of</strong> the submitted pillar recovery plan. GRI submitted a revised pillar recovery plan that<br />
required a double row <strong>of</strong> timbers in the crosscuts adjacent to the bleeder entry.<br />
North Barrier Section - Pillar Recovery Plan. Based on information furnished by GRI, AAI’s<br />
ground control analysis, <strong>and</strong> visual observations during development, the pillar recovery plan for<br />
the North Barrier section (dated December 20, 2006) was approved on February 2, 2007. The<br />
plan showed the sequence <strong>of</strong> removing pillars from west to east <strong>and</strong> specified where coal was not<br />
permitted to be mined. The rows <strong>of</strong> pillars were to be extracted from south to north. Pillars<br />
between the Nos. 3 <strong>and</strong> 4 entries were not mined to establish a bleeder entry. Barrier mining was<br />
not permitted. A double row <strong>of</strong> ro<strong>of</strong>-to-floor support, on four-foot maximum centers, was<br />
required to be installed outby the pillar line at the entrance to the crosscuts in the No. 4 entry.<br />
<strong>MSHA</strong> personnel did not visit the North Barrier section during pillar recovery. Coal outburst<br />
accidents occurred on this section on March 7 <strong>and</strong> 10. GRI did not immediately contact <strong>MSHA</strong><br />
at once without delay <strong>and</strong> within 15 minutes at the toll-free number, 1-800-746-1553, following<br />
both <strong>of</strong> these accidents as required by 30 CFR 50.10. On March 12, 2007, GRI contacted <strong>MSHA</strong><br />
District 9 personnel by telephone to request approval to move the bleeder measurement point<br />
location outby. The proposed location was in the No. 4 entry, adjacent to the pillar line, because<br />
the bleeder entry had been damaged by the coal outburst accident. An <strong>MSHA</strong> inspection was not<br />
conducted in the area affected by the accident. <strong>MSHA</strong> denied the request because the bleeder<br />
could not be properly evaluated at the proposed measurement point location. The section was<br />
ab<strong>and</strong>oned <strong>and</strong> sealed.<br />
South Barrier Section - Development Plan. On March 8, 2007, prior to the accident that stopped<br />
pillar recovery in the North Barrier section, a plan for developing the South Barrier section<br />
(dated February 20, 2007) was approved. The plan allowed development <strong>of</strong> four entries through<br />
the barrier. The plan specified a minimum <strong>of</strong> 80-foot entry centers <strong>and</strong> 90-foot crosscut centers,<br />
which could vary depending upon conditions. A 55-foot barrier was required to the north. No<br />
width was specified for the barrier to the south.<br />
Density <strong>of</strong> the primary ro<strong>of</strong> support during development <strong>of</strong> the South Barrier section was six<br />
bolts per row with a maximum distance <strong>of</strong> five feet between rows. The entries <strong>and</strong> crosscuts<br />
132
would be mined a maximum <strong>of</strong> 20 feet wide. Ro<strong>of</strong> coal could be left in areas where weak<br />
immediate ro<strong>of</strong> was encountered.<br />
At the end <strong>of</strong> March 2007, development mining began in the South Barrier section under the<br />
approved ro<strong>of</strong> control plan. The North Barrier coal outburst accidents had prompted the operator<br />
to have AAI reevaluate mining <strong>of</strong> the South Barrier section. While AAI was performing their<br />
analysis, mining was conducted in relatively shallow overburden in the vicinity <strong>of</strong> crosscuts 108<br />
to 115. Although AAI considered designs based on 35 feet (measured from the Main West<br />
notches) <strong>and</strong> 137 feet wide barriers, mining in this area established the barrier widths at 55 <strong>and</strong><br />
121 feet. AAI completed their analysis as mining progressed to crosscut 118. AAI’s<br />
recommendations for pillar recovery were: to increase pillar centers from 80 x 92 feet to<br />
80 x 129 feet, to recover the pillars as completely as is safe, to slab the south side barrier, <strong>and</strong> to<br />
avoid skipping pillars under the deepest cover (refer to Appendix I). Based on these<br />
recommendations, development mining to the west <strong>of</strong> crosscut 118 was established on 80 x 130-<br />
foot centers.<br />
South Barrier Section - Pillar Recovery Plan. On May 16, 2007, GRI submitted site-specific<br />
amendments to the ro<strong>of</strong> control <strong>and</strong> ventilation plans to permit pillar recovery <strong>of</strong> the South<br />
Barrier section. They also provided <strong>MSHA</strong> with a copy <strong>of</strong> the AAI report for pillar recovery in<br />
the South Barrier section. Maps included with both proposed plans were consistent in showing<br />
that no pillars would be recovered immediately adjacent to the bleeder entry. In the three-entry<br />
portion <strong>of</strong> the section between crosscuts 139 <strong>and</strong> 142, both proposed plans showed slab cuts from<br />
the barrier pillar south <strong>of</strong> the No. 1 entry, as well as recovery from those pillars between the<br />
No. 1 <strong>and</strong> No. 2 entries.<br />
On May 22, 2007, Owens <strong>and</strong> Gary Jensen visited the South Barrier section to observe<br />
conditions <strong>and</strong> evaluate the adequacy <strong>of</strong> the proposed ro<strong>of</strong> control plan amendment. Owens<br />
determined that pillars were yielding closer to the face <strong>and</strong> that pillars outby appeared to be more<br />
stable than he had observed during his visit to the North Barrier section. He interpreted these<br />
observations to be favorable. However, he expressed concern that any pillar recovery in the area<br />
between crosscuts 139 to 142 could jeopardize bleeder stability <strong>and</strong> suggested that no pillar<br />
recovery be conducted in this area. The following day, GRI submitted a revised ro<strong>of</strong> control<br />
plan for recovering the South Barrier section. The revised plan showed that no pillars would be<br />
recovered between crosscuts 139 <strong>and</strong> 142, <strong>and</strong> no slab cuts would be mined from the barrier<br />
pillar south <strong>of</strong> the No. 1 entry. The proposed ventilation plan for recovering the South Barrier<br />
section was not revised, resulting in differences between the maps in the proposed plans (see<br />
Figure 82). However, the ventilation plan addendum did contain a provision stating: “This plan<br />
is for the ventilation for the pillar recovery <strong>of</strong> the developed area <strong>of</strong> the south barrier block…The<br />
pillar recovery proposed by this plan will be done in accordance with the approved Ro<strong>of</strong> Control<br />
Plan.” Accordingly, the pillar recovery sequence was not shown on the map included with the<br />
site-specific ventilation plan, giving preference to relevant portions <strong>of</strong> the ro<strong>of</strong> control plan. The<br />
ventilation plan for South Barrier pillar recovery was approved on June 1, 2007.<br />
The revised ro<strong>of</strong> control plan for pillar recovery <strong>of</strong> the South Barrier section was approved on<br />
June 15, 2007 (see Appendix J). Measurements from the scaled map included with this ro<strong>of</strong><br />
control plan addendum indicated that the pillars were to be mined on 80 x 130-foot centers. The<br />
plan also showed the sequence <strong>of</strong> removing pillars from west to east <strong>and</strong> specified where coal<br />
was to be left unmined. The rows <strong>of</strong> pillars were to be extracted from south to north. To protect<br />
the No. 4 bleeder entry, the northern-most pillars were not recovered.<br />
133
A 55-foot barrier between the South Barrier section No. 4 entry <strong>and</strong> the sealed Main West<br />
notches was also required to be left unmined. The ro<strong>of</strong> control plan permitted a maximum<br />
40-foot cut from the last row <strong>of</strong> ro<strong>of</strong> bolts into the barrier south <strong>of</strong> the No. 1 entry. A double row<br />
<strong>of</strong> ro<strong>of</strong>-to-floor support (timbers) was also required to be installed at the entrance to crosscuts in<br />
the No. 4 entry for additional bleeder protection. These timbers were required to be set a<br />
maximum <strong>of</strong> four feet apart with a minimum <strong>of</strong> four per row.<br />
Figure 82 - Comparison <strong>of</strong> South Barrier Ro<strong>of</strong> Control <strong>and</strong> Ventilation Plans<br />
<strong>Mine</strong> management was made aware <strong>of</strong> the approved ro<strong>of</strong> control plan requirements by the UEI<br />
engineering staff, who routinely provided the mine with 1":100' scaled section maps <strong>of</strong> projected<br />
mining. This map (referred to as a “mark up map”) was posted in the records room <strong>and</strong><br />
additional copies were provided to section foremen. Section foremen placed temporary notations<br />
on the posted mark up map showing mining progress at the end <strong>of</strong> each shift. Periodically,<br />
engineers would exchange new mark up maps for older copies, from which they would<br />
incorporate the temporary notations into the up-to-date map <strong>of</strong> the entire mine.<br />
The initial South Barrier section mark up map showed the pillar recovery sequence from crosscut<br />
149 to crosscut 142. On July 31, 2007, as pillar recovery approached crosscut 143, Gary<br />
Peacock emailed David Hibbs (manager <strong>of</strong> engineering), “We need an updated mark up map at<br />
Cr<strong>and</strong>all showing the pillars that will be left in the area were there is only 3 entries.” Hibbs<br />
replied, “Gary, I feel we need to leave all rows in the area <strong>of</strong> 3 entries <strong>and</strong> also delete the<br />
barrier. Do you have any thoughts” Peacock answered, “I think we should take the barrier.”<br />
Hibbs responded to Peacock: “Gary, This is the drawing in approved Ro<strong>of</strong> Control Plan for that<br />
134
area.” Hibbs attached a copy <strong>of</strong> the pillar extraction map from the approved ro<strong>of</strong> control plan<br />
<strong>and</strong> included Shane Vasten (surveyor) in his email response to Peacock. Later that evening,<br />
Vasten emailed Peacock <strong>and</strong> Hibbs: “Gary, Here is a mark up map for you to look at based on<br />
the latest approvals forwarded to me from Dave. If you have any questions/concerns, get with<br />
Mr. Hibbs. Ace <strong>and</strong> I will be there tomorrow doing month end. I will check with you then to see<br />
if any changes need to be made. I will also plot more maps for you then. I just wanted to send<br />
you this one so you can be looking it over.” Between crosscuts 142 <strong>and</strong> 139, the attached mark<br />
up map (see Figure 83) correctly showed that no pillars were to be recovered <strong>and</strong> the barrier was<br />
to remain unmined south <strong>of</strong> the No. 1 entry (as indicated by the st<strong>and</strong>ard symbol X in the pillars)<br />
in accordance with the approved ro<strong>of</strong> control plan. Interview statements, belt scale records, shift<br />
foremen’s reports, <strong>and</strong> production records revealed that the barrier south <strong>of</strong> the No. 1 entry<br />
between crosscuts 139 <strong>and</strong> 142 was, nonetheless, mined.<br />
Figure 83 - Mark Up Map Provided to <strong>Mine</strong> Management on July 31, 2007<br />
Ro<strong>of</strong> control plans as required by 30 CFR 220(a) (1) must be developed <strong>and</strong> followed by the<br />
mine operator <strong>and</strong> be suitable for the prevailing geologic conditions <strong>and</strong> the mining system to be<br />
used at the mine. <strong>MSHA</strong> approved site specific ro<strong>of</strong> control plans for pillar recovery in the<br />
North <strong>and</strong> South Barrier sections by considering observed mining conditions <strong>and</strong> AAI’s analyses<br />
<strong>of</strong> mine stability provided to <strong>MSHA</strong> by GRI. Although no adverse conditions were observed<br />
when <strong>MSHA</strong> ro<strong>of</strong> control specialists visited the sections during development mining, adverse<br />
conditions were encountered during pillar recovery on both sections, including coal burst<br />
accidents on at least three occasions: March 7, March 10, <strong>and</strong> August 3. Prior to the March 10<br />
<strong>and</strong> August 6 accidents, miners were struck by coal, ventilation was impaired, regular mining<br />
was disrupted, <strong>and</strong> equipment was damaged, indicating that the ro<strong>of</strong> control plan was not suitable<br />
for controlling the ro<strong>of</strong>, face, ribs, or coal bursts. While recovering pillars in the South Barrier<br />
135
section, miners recognized that ground conditions were similar to those that forced ab<strong>and</strong>onment<br />
<strong>of</strong> the North Barrier section. Although these similar conditions indicated that the ro<strong>of</strong> control<br />
plan was inadequate, revisions to the plan were not proposed by GRI <strong>and</strong> mining was allowed to<br />
continue until the August 6 accident.<br />
Summary – Critique <strong>of</strong> <strong>Mine</strong> Design<br />
ARMPS <strong>and</strong> LaModel analyses were conducted by AAI to evaluate the stability <strong>of</strong> mine designs<br />
proposed for development <strong>and</strong> recovery <strong>of</strong> pillars in the North <strong>and</strong> South Barrier sections.<br />
Although AAI concluded that the designs should function adequately, mining in each area ended<br />
in failure. A review <strong>of</strong> input files, model results, notes, <strong>and</strong> various types <strong>of</strong> correspondence<br />
indicates that the analyses were flawed <strong>and</strong> relied on overly optimistic assumptions.<br />
Furthermore, the South Barrier section was evaluated using essentially the same models that had<br />
proved to be unreliable in the North Barrier section analyses. An AAI ARMPS analysis that<br />
showed the design was inadequate was not included in the report that GRI furnished to <strong>MSHA</strong>.<br />
The ro<strong>of</strong> control plan, developed by GRI using AAI’s mine design, was not suitable to the<br />
prevailing burst prone ground conditions <strong>and</strong> the pillar recovery system used in the North <strong>and</strong><br />
South Barrier sections. Accident experience at the mine included at least three coal outburst<br />
accidents in the North <strong>and</strong> South Barrier sections prior to August 6. The accident on August 3,<br />
2007, showed that conditions on the South Barrier section were similar to those preceding the<br />
March 10 accident. Following the August 3 accident, GRI did not propose revisions to the ro<strong>of</strong><br />
control plan when conditions <strong>and</strong> accident experience indicated the plan was inadequate <strong>and</strong> not<br />
suitable for controlling coal bursts on the South Barrier section. Instead, GRI resumed mining in<br />
a manner that did not comply with the approved ro<strong>of</strong> control plan. Continued pillar recovery<br />
prior to taking corrective actions following the August 3 accident exposed miners to hazards<br />
related to coal bursts.<br />
An analysis <strong>of</strong> <strong>MSHA</strong>’s ro<strong>of</strong> control plan review process is beyond the scope <strong>of</strong> this report.<br />
<strong>MSHA</strong>’s procedures for determining if mine operators are complying with relevant requirements<br />
<strong>of</strong> 30 CFR <strong>and</strong> the <strong>Mine</strong> Act will be addressed in the findings <strong>of</strong> an independent review team.<br />
<strong>Mine</strong> Ventilation<br />
<strong>Mine</strong> Ventilation System<br />
Figure 84 depicts a simplified schematic <strong>of</strong> the mine ventilation system based on air<br />
measurements recorded during the week prior to the accident. The mine was ventilated by<br />
exhausting fans. <strong>Mine</strong> openings consisted <strong>of</strong> five drift openings. From left to right, the first drift<br />
served as the entrance to an underground bath house <strong>and</strong> provided a small amount <strong>of</strong> intake air.<br />
The second drift served as the main intake <strong>and</strong> travelway. The third drift contained the belt<br />
conveyor. Return air exited the mine through the fourth drift. A stopping was erected in the fifth<br />
drift to separate the return air course from the surface.<br />
According to the weekly examination record book, in the week preceding the August 6, 2007,<br />
accident, 220,806 cfm <strong>of</strong> air was entering the mine through the main intake. An air quantity <strong>of</strong><br />
252,216 cfm was exiting the mine through the return drift <strong>and</strong> main fans. The quantity entering<br />
the belt haulage entry <strong>and</strong> the bath house entrance were not recorded in the weekly examination<br />
book. A revised ventilation map received on July 2, 2007, indicated that 31,036 cfm <strong>of</strong> air<br />
entered the mine through the belt drift <strong>and</strong> 5,200 cfm entered through the bathhouse.<br />
136
Figure 84 - Ventilation System before August 6 Accident<br />
137
The main fan installation consisted <strong>of</strong> four main fans. Two parallel sets <strong>of</strong> two fans in series<br />
were utilized. Documents provided by the operator indicate that an original installation <strong>of</strong> two<br />
fans in parallel had been upgraded by installing additional fans in series resulting in the four fan<br />
system. The fan system capacity was stated in the ventilation plan as 300,000 cfm, with 150,000<br />
cfm being provided by each set <strong>of</strong> fans. The actual operating point <strong>of</strong> the fan system prior to the<br />
accident was 252,216 cfm at a pressure <strong>of</strong> 6.5 inches <strong>of</strong> water gauge.<br />
At the time <strong>of</strong> the accident, the ventilation system consisted <strong>of</strong> three main air splits: the 3 rd North<br />
section, the completed South Mains pillar recovery section, <strong>and</strong> the South Barrier section. Only<br />
the South Barrier section was active. A minimum <strong>of</strong> 15,000 cfm <strong>of</strong> air was required by the mine<br />
ventilation plan at the intake end <strong>of</strong> the pillar line. Records indicate that 51,340 cfm was<br />
provided. A discussion <strong>of</strong> the ventilation plan is included in Appendix X.<br />
Post-Accident <strong>Mine</strong> Ventilation<br />
The effect <strong>of</strong> the August 6, 2007, accident on the mine ventilation system was significant. The<br />
initial air blast <strong>and</strong> burst coal pillars destroyed or damaged stoppings from the accident site outby<br />
to crosscut 93 <strong>and</strong> the overcasts at crosscut 90 <strong>and</strong> 91. The damage short-circuited ventilation<br />
inby that point.<br />
The short circuiting <strong>of</strong> air affected the main fan pressure. Figure 85 shows the fan pressure<br />
recorded by the mine monitoring system for the time period immediately before <strong>and</strong> after the<br />
accident. Also, the daily fan examination record book indicated 6.5 inches <strong>of</strong> water gauge (w.g.)<br />
for fans 1 <strong>and</strong> 2 <strong>and</strong> 6.25 inches w.g. for fans 3 <strong>and</strong> 4 on the previous day. A pressure <strong>of</strong><br />
5.25 inches w.g. for fans 1 <strong>and</strong> 2 <strong>and</strong> 5.5 inches w.g. for fans 3 <strong>and</strong> 4 was recorded after the<br />
accident. This was an average decrease <strong>of</strong> 1.0 inches w.g. after the accident.<br />
Figure 85 - Fan Pressure at the Time <strong>of</strong> the August 6 Accident<br />
Curtains were installed in place <strong>of</strong> the damaged permanent ventilation controls up to the rescue<br />
work site in the hours following the August 6 accident. The subsequent burst at 1:13 a.m. on<br />
138
August 7 damaged many <strong>of</strong> these temporary ventilation controls. The temporary controls were<br />
then replaced with permanent stoppings. These permanent stoppings were completed prior to<br />
resuming rescue efforts. Figure 86 shows the locations <strong>of</strong> stoppings damaged in the August 6<br />
accident <strong>and</strong> the stopping configuration after the August 16 accident.<br />
Figure 86 - Ventilation Controls after Accidents<br />
139
Originally, the South Barrier section No. 3 entry was in common with the belt entry. As<br />
ventilation controls were reestablished, the No. 3 entry was utilized as a return air course.<br />
Stoppings were erected between the No. 2 <strong>and</strong> 3 entries. A feeder was set in the No. 2 entry<br />
between crosscuts 119 <strong>and</strong> 120. The stoppings between the intake <strong>and</strong> belt entries (No. 1 <strong>and</strong><br />
No. 2) were reestablished up to crosscut 120. Crosscut 120 was left open to serve as the haul<br />
road to the feeder. A stopping was built across the No. 2 entry inby crosscut 120. Inby that<br />
point, the No. 1 entry served as the intake <strong>and</strong> the Nos. 2, 3, <strong>and</strong> 4 entries served as returns.<br />
As material was loaded <strong>and</strong> the rescue operation advanced, ventilation controls were erected in<br />
the crosscuts between the No. 1 <strong>and</strong> No. 2 entries. The last crosscut outby the clean-up area was<br />
left open to serve as a connection to the return air course. Line curtain was used to ventilate to<br />
the clean-up area during the rescue operation.<br />
Ventilation in Area <strong>of</strong> Entrapment<br />
It was unlikely that any ventilation was reaching the working area <strong>of</strong> the South Barrier section<br />
immediately after the August 6 accident. When boreholes were drilled into the South Barrier<br />
section, outside air entered the holes due to the negative pressure <strong>of</strong> the exhausting ventilation<br />
system. This indicated that some borehole air could be drawn through the collapse area. Later,<br />
air was injected into some holes to provide breathable air to potential survivors. Initially the<br />
other holes continued to intake. However, when the injected air volume was increased, air exited<br />
from the other boreholes. The air being injected (2,000 to 3,000 cfm) exceeded the air quantity<br />
returning to the mine ventilation system. This observation shows that the rubble from the<br />
collapse severely restricted air flow to the South Barrier section.<br />
On the morning <strong>of</strong> August 6, rescuers attempted to pump breathable air to the section from<br />
underground. A compressor was used to force air through the fresh water pipeline running along<br />
the South Barrier section belt. Since the pipeline was likely damaged by burst material between<br />
crosscut 120 <strong>and</strong> the working section, the air may not have reached the work area.<br />
Air Quality in South Barrier Section Pillar Recovery Area<br />
Before the accident, preshift examination records for the South Barrier section indicated air<br />
quality <strong>of</strong> 20.9% oxygen (O 2 ), 0% methane (CH 4 ), <strong>and</strong> 0 ppm carbon monoxide (CO). After the<br />
accident, oxygen deficiency as low as 16% was encountered. Samples from Borehole No. 1<br />
taken at 9:57 p.m. on August 10, 2007, indicated 7.46% O 2 , no detectable amount <strong>of</strong> CH 4 , 141<br />
ppm CO, <strong>and</strong> 0.58% CO 2 . Exposure to this atmosphere will result in vomiting, unconsciousness,<br />
<strong>and</strong> death. Higher oxygen concentrations were detected in Borehole Nos. 3 <strong>and</strong> 4. However, no<br />
evidence <strong>of</strong> the miners was observed in these boreholes. It is likely the entrapped miners were<br />
exposed to an atmosphere similar to that observed in Borehole No. 1.<br />
Had the miners survived the initial catastrophic ground failure, oxygen deficiency would have<br />
contributed to their deaths. Table 11 16 lists effects <strong>of</strong> exposure to reduced oxygen. These effects<br />
would occur at increased oxygen concentrations at higher altitudes. Figure 87 16 shows the time<br />
<strong>of</strong> useful consciousness versus oxygen concentration. At 7.5% O 2 , the time <strong>of</strong> useful<br />
consciousness is just over one minute. The time <strong>of</strong> useful consciousness is the time after<br />
exposure to oxygen deficiency during which a person can effectively take corrective action such<br />
as donning an SCSR before impairment or unconsciousness occurs.<br />
140
Table 11 - Effect Thresholds for Exposure to Reduced Oxygen<br />
% O 2<br />
by<br />
Volume<br />
Effect<br />
17 Night Vision Reduced, Increased Breathing Volume, Accelerated Heartbeat<br />
16 Dizziness<br />
15<br />
12<br />
Impaired Attention, Impaired Judgment, Impaired Coordination, Intermittent<br />
Breathing, Rapid Fatigue, Loss <strong>of</strong> Muscle Control<br />
Very Faulty Judgment, Very Poor Muscular Coordination, Loss <strong>of</strong><br />
Consciousness, Permanent Brain Damage<br />
10 Inability to Move, Nausea, Vomiting<br />
6 Spasmatic Breathing, Convulsive Movements, Death in 5-8 Minutes<br />
Figure 87 – Approx. Time <strong>of</strong> Useful Consciousness vs. Oxygen Concentration<br />
For Seated Subjects at Sea Level. Adapted from Miller <strong>and</strong> Mazur 16<br />
141
Three sources <strong>of</strong> the oxygen deficiency detected in the South Barrier section after the accident<br />
were considered:<br />
• Release <strong>of</strong> in situ gasses from the coal seam,<br />
• Oxidation <strong>of</strong> the coal during the initial catastrophic pillar failure, <strong>and</strong><br />
• Breaching <strong>of</strong> one or both <strong>of</strong> the barrier pillars to the north <strong>and</strong> south <strong>of</strong> the<br />
section.<br />
At other mines, low oxygen concentration has been reported to have occurred after coal bursts.<br />
However, reports <strong>of</strong> these accidents also indicated that the oxygen was displaced by a release <strong>of</strong><br />
methane gas. Several samples taken from boreholes after the August 6 accident contained<br />
methane concentrations below 0.1%. The remaining samples contained no detectable amount.<br />
No report <strong>of</strong> oxygen deficiency was recorded for the preshift examination conducted after the<br />
March 10, 2007, outburst accident, nor was there any indication <strong>of</strong> oxygen deficiency from<br />
interview statements.<br />
During development <strong>of</strong> Main West, approximately between crosscuts 73 <strong>and</strong> 78 <strong>and</strong> at the mouth<br />
<strong>of</strong> 1 st North, gasses were liberated during mining that created a detectable amount <strong>of</strong> oxygen<br />
deficiency. The gasses present were unknown <strong>and</strong> appeared to be related to a change in the<br />
immediate ro<strong>of</strong> confined to that area. The oxygen deficiency was detectable only by placing a<br />
detector directly against a freshly exposed coal rib <strong>and</strong> it did not affect normal mining. This<br />
phenomenon was not reported to have been observed in any other part <strong>of</strong> the mine. The accident<br />
site was located approximately one mile west <strong>of</strong> this area. It is unlikely that the oxygen<br />
deficiency resulted from gasses released from the coal at the August 6 accident site. No<br />
incidents <strong>of</strong> oxygen deficiency were reported during the development or pillar recovery <strong>of</strong> that<br />
area or immediately after the March 10, 2007, outburst accident in the North Barrier section.<br />
It is also unlikely the oxygen deficiency was caused by oxidation <strong>of</strong> coal during the initial<br />
catastrophic pillar failure. The oxygen level dropped from 20.9% to approximately 7.5%. Any<br />
rapid oxidation would have generated high levels <strong>of</strong> carbon monoxide (CO) <strong>and</strong> carbon dioxide<br />
(CO 2 ). Gas analysis <strong>of</strong> samples collected from boreholes indicated concentrations <strong>of</strong><br />
approximately 140 ppm CO <strong>and</strong> 0.6% CO 2 . While these concentrations are above normal levels,<br />
they cannot account for a 13% drop in oxygen levels. Also, no reports were made <strong>of</strong> any other<br />
products <strong>of</strong> oxidation or combustion detected by instruments or smell during rescue efforts.<br />
The areas to the north <strong>and</strong> south <strong>of</strong> the South Barrier section were both sealed at the time <strong>of</strong> the<br />
accident. Mining had been completed <strong>and</strong> the areas were sealed for several years. Oxygen<br />
deficiency was known to exist behind the seals in these areas, based on samples collected during<br />
previous examinations.<br />
During the rescue attempt, the Main West No. 1 seal was breached. Air samples were collected<br />
<strong>of</strong> the atmosphere in the sealed area. Air samples were also collected from the Panel 13 sealed<br />
area atmosphere at crosscut 107, the South Barrier section during the rescue attempt, <strong>and</strong> from<br />
boreholes drilled into the inby end <strong>of</strong> the section. Table 12 shows selected results from gas<br />
chromatograph analysis <strong>of</strong> the air samples.<br />
142
Location<br />
Main West<br />
Seal 1<br />
Main West<br />
Seal 1<br />
Main West<br />
Inby Seal 1<br />
Panel 13 xc<br />
107 seal<br />
Panel 13 xc<br />
107 seal<br />
126 xc#4<br />
Entry<br />
126 xc#4<br />
Entry<br />
No 2 Entry<br />
50 feet inby<br />
xc 123<br />
65 feet inby<br />
xc 119<br />
Borehole<br />
No. 1<br />
Borehole<br />
No. 1<br />
Borehole<br />
No. 1<br />
Borehole<br />
No.3<br />
Borehole<br />
No.4<br />
Date &<br />
Time<br />
08/12/07<br />
20:30<br />
08/14/07<br />
15:00<br />
08/16/07<br />
14:40<br />
01/00/00<br />
00:00<br />
01/00/00<br />
00:00<br />
08/10/07<br />
14:00<br />
08/10/07<br />
15:58<br />
08/10/07<br />
19:15<br />
08/10/07<br />
19:20<br />
08/10/07<br />
19:25<br />
08/10/07<br />
16:04<br />
08/10/07<br />
16:07<br />
08/10/07<br />
21:57<br />
08/16/07<br />
06:00<br />
08/18/07<br />
19:15<br />
Table 12 - Results <strong>of</strong> Air Sample Analysis<br />
H 2<br />
ppm<br />
O 2<br />
%<br />
N 2<br />
%<br />
CH 4<br />
%<br />
CO<br />
ppm<br />
CO 2<br />
%<br />
C 2 H 2<br />
ppm<br />
C 2 H 4<br />
ppm<br />
C 2 H 6<br />
ppm<br />
4 7.78 89.46 NDA 152 1.81 NDA NDA NDA 0.93<br />
5 6.14 90.94 0.01 186 1.96 NDA NDA NDA 0.93<br />
5 4.27 92.57 0.01 204 2.19 NDA NDA NDA 0.93<br />
NDA 19.45 79.02 NDA 4 0.6 NDA NDA NDA 0.93<br />
NDA 19.39 79.07 NDA 5 0.61 NDA NDA NDA 0.93<br />
2 20.95 78.02 NDA 7 0.1 NDA NDA NDA 0.93<br />
2 20.95 78.02 NDA 8 0.1 NDA NDA NDA 0.93<br />
1 20.95 78.04 NDA 6 0.08 NDA NDA NDA 0.93<br />
2 20.95 78.03 NDA 10 0.09 NDA NDA NDA 0.93<br />
2 20.95 78.04 NDA 8 0.08 NDA NDA NDA 0.93<br />
88 7.61 90.86 NDA 146 0.56 NDA NDA NDA 0.93<br />
78 7.58 90.90 NDA 140 0.56 NDA NDA NDA 0.93<br />
79 7.46 91.00 NDA 141 0.58 NDA NDA NDA 0.93<br />
2 16.88 81.86 0.02 21 0.3 NDA NDA 40 0.93<br />
3 11.97 86.52 0.04 31 0.53 NDA NDA 30 0.93<br />
NDA = No Detectable Amount<br />
Ar<br />
%<br />
Before <strong>and</strong> after the August 6 accident, h<strong>and</strong>held gas detectors were used to monitor gas<br />
concentrations in the Panel 13 sealed area to the south <strong>and</strong> the Main West sealed area to the<br />
north. Samples were drawn from pipes installed through seals. Measurements were also made<br />
by h<strong>and</strong>held gas detectors inby the breached seal in Main West during the rescue operation.<br />
These concentrations are shown in Table 13.<br />
143
Table 13 - H<strong>and</strong>held Gas Detector Concentrations<br />
Location Date O 2 CH 4 CO<br />
Gas<br />
Direction<br />
Crosscut 107 Seal (Panel 13) 6/18/2007 1.2 0.0 - out<br />
Crosscut 107 Seal (Panel 13) 6/19/2007 20.9 0.0 - in<br />
Crosscut 107 Seal (Panel 13) 6/20/2007 20.9 0.0 - in<br />
Crosscut 107 Seal (Panel 13) 6/21/2007 1.1 0.0 - out<br />
Crosscut 107 Seal (Panel 13) 6/27/2007 0.7 0.0 - out<br />
Crosscut 107 Seal (Panel 13) 7/4/2007 2.6 0.0 - out<br />
Crosscut 107 Seal (Panel 13) 7/11/2007 0.0 0.0 - out<br />
Crosscut 107 Seal (Panel 13) 7/18/2007 0.8 0.0 - out<br />
Crosscut 107 Seal (Panel 13) 7/25/2007 0.4 0.0 - out<br />
Crosscut 107 Seal (Panel 13) 8/1/2007 0.4 0.0 - out<br />
Crosscut 107 Seal (Panel 13) 8/8/2007 20.9 0.0 - in<br />
Crosscut 107 Seal (Panel 13) 8/15/2007 7.0 0.0 - out<br />
Crosscut 107 Seal (Panel 13) 8/29/2007 20.9 0.0 - in<br />
Crosscut 118 Center (Main West) 6/18/2007 20.9 0.0 - in<br />
Crosscut 118 Center (Main West) 6/19/2007 20.9 0.0 - in<br />
Crosscut 118 Center (Main West) 6/20/2007 20.9 0.0 - in<br />
Crosscut 118 Center (Main West) 6/21/2007 10.1 0.0 - out<br />
Crosscut 118 Center (Main West) 6/27/2007 20.9 0.0 - in<br />
Crosscut 118 Center (Main West) 7/4/2007 20.8 0.0 - in<br />
Crosscut 118 Center (Main West) 7/11/2007 20.9 0.0 - in<br />
Crosscut 118 Center (Main West) 7/18/2007 20.9 0.0 - in<br />
Crosscut 118 Center (Main West) 7/25/2007 20.9 0.0 - in<br />
Crosscut 118 Center (Main West) 8/1/2007 20.9 0.0 - in<br />
Crosscut 118 Center (Main West) 8/8/2007 20.6 0.0 - out<br />
Behind #1 Seal (Main West) 8/6/07 13:30 6.8 0.0 57 -<br />
#1 Seal (Main West) 8/6/07 15:15 8.0 - - out<br />
Gas concentrations measured at the seals varied due to the pressure differential. This is typical<br />
<strong>of</strong> sealed areas. The change in pressure differential direction is related to normal changes in<br />
barometric pressure. All seals leak some amount <strong>and</strong> during a rise in barometric pressure air will<br />
typically leak into the sealed area <strong>and</strong> samples will indicate higher oxygen content than<br />
representative <strong>of</strong> the atmosphere in the sealed area. When the barometric pressure decreases, the<br />
differential will reverse <strong>and</strong> out-gassing will occur. After enough time, samples will more<br />
accurately reflect the atmosphere behind the seal.<br />
The results <strong>of</strong> bottle sample analyses <strong>and</strong> h<strong>and</strong>held detector gas concentrations indicated that the<br />
South Barrier section was bounded on both sides by sealed areas with oxygen deficient<br />
atmospheres. Leakage <strong>of</strong> normal air from the active areas into <strong>and</strong> out <strong>of</strong> the sealed areas can<br />
only increase the oxygen levels. Based on this fact, the most reliable samples were those with<br />
the lowest oxygen levels taken while the sealed areas were out-gassing. Oxygen concentrations<br />
in the Panel 13 <strong>and</strong> Main West sealed areas before the accident were near zero percent <strong>and</strong> four<br />
percent, respectively.<br />
144
The level <strong>of</strong> oxygen in Borehole No. 1 drilled into the South Barrier section was approximately<br />
7.5%. Earlier samples indicated higher concentrations. This was due to problems with the<br />
sample collection (i.e., plugged bit).<br />
The oxygen concentrations from Boreholes Nos. 3 <strong>and</strong> 4 were approximately 17% <strong>and</strong> 12%,<br />
respectively. These holes were drilled into the bleeder entry at the back <strong>of</strong> the section. The<br />
higher concentration <strong>of</strong> oxygen indicated that a pocket <strong>of</strong> less contaminated air existed there.<br />
Borehole No. 3 was drilled in that location anticipating that such a pocket <strong>of</strong> breathable air might<br />
exist <strong>and</strong> provide a refuge for the entrapped miners. Although Borehole Nos. 3 <strong>and</strong> 4 contained<br />
high enough oxygen concentrations to sustain life, video images taken from the boreholes<br />
showed no indications that the miners had traveled to this area.<br />
The most likely cause <strong>of</strong> the oxygen deficiency was a breach in the barriers separating the South<br />
Barrier section from the sealed Panel 13 area to the south <strong>and</strong> the Main West sealed area to the<br />
north. This conclusion is based on several factors. First, damage to the southern barrier was<br />
observed as a rib displacement <strong>of</strong> up to 10 feet into the No. 1 entry during the rescue work.<br />
Second, InSAR data indicates subsidence occurred over the barriers to the north <strong>and</strong> south.<br />
Third, the rapid convergence that occurred during the August 6 accident that created the air blast<br />
felt outby in the South Barrier section would have likely caused a similar flow <strong>of</strong> air from the<br />
sealed areas through the damaged barriers into the South Barrier section work area.<br />
GRI <strong>and</strong> AAI did not give proper design consideration to implications <strong>of</strong> a barrier breach inby<br />
the working section. AAI’s analysis focused on pillar stability at the pillar line. While it was<br />
apparent that the need for a ventilation barrier was recognized, the remnant barriers were not<br />
designed to be stable inby the pillar line. Interview statements by AAI engineers indicated that<br />
no consideration was given to maintaining the integrity <strong>of</strong> the remnant barrier as a ventilation<br />
separation between the gob <strong>and</strong> the sealed area. They acknowledged that the structural<br />
component <strong>of</strong> the remnant barrier was questionable <strong>and</strong> that it was not designed to carry the<br />
entire load. The stability <strong>of</strong> the barriers was critical to ensure that the miners were protected<br />
from lethally oxygen deficient atmospheres that were present in sealed workings to either side <strong>of</strong><br />
the section.<br />
Attempt to Locate <strong>Mine</strong>rs with Boreholes<br />
A decision to drill boreholes into the mine was made early on August 6. Seven boreholes were<br />
drilled from the surface to the mine workings. The goal for drilling the boreholes was to locate<br />
the entrapped miners <strong>and</strong> assess conditions in the affected area. If miners were located, the<br />
boreholes could be used to provide communication, fresh air, <strong>and</strong> sustenance until they were<br />
rescued. GRI <strong>and</strong> <strong>MSHA</strong> jointly decided the location for each borehole.<br />
Boreholes Drilled Prior to August 16<br />
Three boreholes were completed <strong>and</strong> a fourth borehole was started prior to the August 16<br />
accident. The location chosen for Borehole No. 1 was near the kitchen/transformer area<br />
(crosscut 138 in No. 3 entry) in the South Barrier section. This was the designated location that<br />
miners were to gather in the event <strong>of</strong> an emergency <strong>and</strong> the location <strong>of</strong> the pager phone. The<br />
drill rig for this borehole did not have directional controls <strong>and</strong>, as a result, intersected the mine<br />
opening at crosscut 138 in the No. 2 entry, which was 85 feet south <strong>of</strong> its intended location.<br />
Although the goal for this borehole was not met, the information obtained from it was useful.<br />
This small drill rig was used to drill Borehole No. 1 because it was immediately available <strong>and</strong><br />
could be transported quickly to the drill site by helicopter. The mine void was 5.5 feet high at<br />
this location. The drill rod had a 2.25-inch outside diameter <strong>and</strong> 1.875-inch inside diameter. The<br />
145
drill rod <strong>and</strong> bit were left in the hole so that air samples could be taken through the rod’s hollow<br />
drill stem.<br />
Initial air samples collected from Borehole No. 1, at 12:00 a.m. on August 10, 2007, showed<br />
20.73% oxygen. It was later discovered that the holes in the bit were clogged <strong>and</strong> the sample did<br />
not represent the true air quality in the mine. After the bit was flushed with water, another air<br />
sample was collected at 1:45 a.m. which indicated 8.17% oxygen. This concentration <strong>of</strong> oxygen<br />
would cause unconsciousness in about two minutes. Two down-hole cameras were on site. One<br />
was a four-inch diameter camera <strong>and</strong> the other a 2.5-inch diameter. Due to the small borehole<br />
diameter <strong>of</strong> 2.4 inches, neither camera was used.<br />
The projected mine location for Borehole No. 2 was the No. 2 belt entry at crosscut 137, in the<br />
intersection outby the section feeder. The location for this borehole was chosen because it could<br />
be drilled from the same drill pad as Borehole No. 1 <strong>and</strong>, therefore, could be started immediately.<br />
This hole was one crosscut outby the location <strong>of</strong> Borehole No. 1. The mine void was determined<br />
to be 5.7 feet. Air was entering this borehole from the surface <strong>and</strong> therefore air quality analysis<br />
was not done at that time. Because <strong>of</strong> its proximity to the Borehole No. 1, the air quality was<br />
likely similar at the two locations. A compressor was used to pump fresh air through the<br />
borehole after video examination was completed.<br />
On August 12, a camera lowered into Borehole No. 2 showed that the intersection was mostly<br />
open. A canvas bag was observed hanging from the mine ro<strong>of</strong> <strong>and</strong> the intersection was largely<br />
free <strong>of</strong> rubble. This visual evidence reinforced the assumption that the entrapped crew might<br />
have made their way into an area where they could survive. It was also thought that open entries<br />
might exist inby the blockage at crosscut 126. However, additional observations on August 21<br />
using brighter lighting <strong>and</strong> computer enhancements on August 22 revealed that while the<br />
intersection was open, severe damage was observed in the entries. Boreholes completed after<br />
August 16 <strong>and</strong> InSAR subsidence analyses also indicate that the collapse was more extensive<br />
than envisioned when Borehole No. 2 penetrated the mine level. It is now concluded that in<br />
areas <strong>of</strong> pillar collapse, the intersections may have some voids while the adjoining entries <strong>and</strong><br />
crosscuts were rubble filled. There was little chance for a miner to survive at the Borehole No. 2<br />
location because <strong>of</strong> the low oxygen content observed in Borehole No.1 <strong>and</strong> because the entries<br />
<strong>and</strong> crosscuts were partially filled with rubble from the collapse.<br />
Irrespirable air sample results from Borehole No. 1 prompted rescue drilling in an area <strong>of</strong> the<br />
mine where the entrapped miners could have barricaded to survive these conditions. The<br />
location chosen for Borehole No. 3 was in the No. 4 bleeder entry <strong>of</strong> the South Barrier section at<br />
crosscut 147 because it was considered a likely location for barricading. Also, the position for<br />
this hole was under the area <strong>of</strong> lower cover (1,400 feet) where collapsed ground was less likely<br />
to occur. The full entry height <strong>of</strong> 8 feet was encountered at this location. A camera lowered into<br />
this borehole revealed that the pillars had sloughed but the entries <strong>and</strong> crosscut were open.<br />
Analysis <strong>of</strong> an initial air sample showed 16.88% oxygen. The air quality <strong>and</strong> mine condition<br />
indicated that a miner could survive at this location, which encouraged further rescue efforts<br />
underground <strong>and</strong> from the surface. Borehole No. 3 also reinforced the concept that open entries<br />
existed inby the blockage at crosscut 126. A later attempt to lower a robot into the mine through<br />
Borehole No. 3 was unsuccessful because the borehole became blocked.<br />
Boreholes Drilled After August 16<br />
After underground rescue efforts were suspended, the focus turned to searching for the entrapped<br />
miners solely by drilling boreholes. If miners were found, a special drill rig, large enough to drill<br />
146
a 30-inch diameter hole, would be acquired to drill a hole <strong>of</strong> sufficient diameter for the mine<br />
rescue capsule.<br />
Borehole No. 4 was being drilled at the time <strong>of</strong> the August 16 accident. The location for<br />
Borehole No. 4 was in the No. 4 bleeder entry, crosscut 142, <strong>of</strong> the South Barrier section, five<br />
crosscuts outby Borehole No. 3. This location was chosen because a pattern <strong>of</strong> noise was<br />
detected by <strong>MSHA</strong>’s seismic location system. Although this noise was considered too strong to<br />
be signals from the entrapped miners, to be certain, the borehole was drilled at the location <strong>of</strong> the<br />
noise. After penetrating the mine on August 18, the miners were signaled by striking the drill<br />
steel <strong>and</strong> setting <strong>of</strong>f explosive charges. No response was detected. The mine void was 4 feet at<br />
this location. Analysis <strong>of</strong> the initial air sample showed 11.97% oxygen in the mine. A camera<br />
lowered into the borehole revealed that the entries <strong>and</strong> crosscut were partially filled with rubble.<br />
The air quality <strong>and</strong> mine condition indicated that there would be a very low possibility <strong>of</strong><br />
survival at this location. Therefore, it was concluded that the noises detected by the <strong>MSHA</strong>’s<br />
seismic system were not made by entrapped miners.<br />
On August 30, 2007, a robot was lowered into the mine through Borehole No. 4. The prototype<br />
robot lacked vertical clearance <strong>and</strong> was only able to travel a short distance in the mine. It was<br />
unable to explore the area around the borehole. No information useful to the rescue efforts was<br />
gained from the robot.<br />
The location for Borehole No. 5 was in the No.1 intake escapeway entry <strong>of</strong> the South Barrier<br />
section at crosscut 133. This location was chosen because it is an area where the entrapped<br />
miners could have tried to escape after the accident. The mine void was 0.5 feet at this location.<br />
An attempt to lower a camera to the mine level was aborted because the borehole was blocked<br />
with mud <strong>and</strong> water at 511 feet, more than 1,500 feet above the mine level. There would have<br />
been no chance <strong>of</strong> survival at this location because the entry was filled with rubble.<br />
The location chosen for Borehole No. 6 was near the last known area where mining was taking<br />
place in the South Barrier section. The borehole intersected the mine in the No. 1 entry between<br />
crosscuts 138 <strong>and</strong> 139. There was no mine void at this location. Based on the material<br />
encountered during drilling, these conditions appeared to rescue workers to be similar to the<br />
packed rubble encountered near crosscut 124 where the barrier had shifted violently into the<br />
No. 1 entry. The material at mine level was so compacted that water flowing down the borehole<br />
could not flow into the mine <strong>and</strong> backed up approximately 100 feet into the borehole.<br />
Consequently, when a camera was lowered into the borehole, it encountered mud <strong>and</strong> water<br />
approximately 100 feet from the mine level <strong>and</strong> could not be lowered any further. There would<br />
have been no chance <strong>of</strong> survival at this location.<br />
The location chosen for Borehole No. 7 was in the kitchen/transformer area <strong>of</strong> the South Barrier<br />
section, No. 3 entry between crosscuts 138 <strong>and</strong> 139. This was near the area in which Borehole<br />
No. 1 was intended to intercept the mine. A 7-foot rubble depth <strong>and</strong> a 2.7-foot void height were<br />
encountered. An attempt to lower a camera into this borehole was stopped because water <strong>and</strong><br />
mud had blocked the hole approximately 9 feet from the mine level. The material at mine level<br />
was so compacted that water flowing down the borehole could not flow into the mine <strong>and</strong> backed<br />
up into the borehole. There would have been no chance <strong>of</strong> survival at this location because the<br />
entry was nearly filled with rubble. After drilling the seventh borehole, a decision was made to<br />
discontinue all drilling.<br />
147
It was feasible to acquire a special drill rig <strong>and</strong> drill a 30-inch diameter rescue hole. However,<br />
the rubble seen through Borehole Nos. 5, 6, <strong>and</strong> 7 showed that pillar failure was extensive in the<br />
South Barrier section from crosscut 139 to where rescue operations began at crosscut 120.<br />
Rescue workers lowered into the region with the rescue capsule would be forced to clear material<br />
by h<strong>and</strong> wearing a breathing apparatus <strong>and</strong> that process could trigger another burst. The strata<br />
above the mine were considered to be unstable with a high probability that the hole could<br />
collapse. Evidence <strong>of</strong> the strata instability was demonstrated by the fact that some <strong>of</strong> the 8-inch<br />
boreholes collapsed. Consequently, the rescue capsule option was considered to be too<br />
dangerous <strong>and</strong> constituted an unacceptable risk to rescue personnel.<br />
Decision makers at the accident site relied on limited information available from boreholes to<br />
determine conditions in the affected area. Only one rig was used to drill boreholes after<br />
Borehole No. 1 intersected the mine. If two directional drill rigs had been used after completion<br />
<strong>of</strong> Borehole No. 1, five boreholes would have been completed before the August 16 accident. If<br />
three directional drill rigs had been used, all seven boreholes would have been completed before<br />
the August 16 accident. Greater drilling resources would have provided information sooner for<br />
evaluating the potential success <strong>of</strong> continuing rescue efforts. Similarly, if better lighting <strong>and</strong><br />
camera resolution (e.g., zoom capability) had been available, decision makers would have had<br />
more accurate <strong>and</strong> timely information.<br />
<strong>MSHA</strong>’s Seismic Location Systems<br />
<strong>MSHA</strong>’s seismic location system was deployed <strong>and</strong> arrived at the mine site 32 hours after the<br />
accident. The system was operational within another twelve hours. At the Cr<strong>and</strong>all Canyon<br />
<strong>Mine</strong>, the system was near its operational limit. The depth <strong>of</strong> the mine near the accident site was<br />
1,760 feet. The greatest depth the system has ever detected a signal was approximately<br />
2,000 feet. This was during a test over an idle mine with ideal conditions.<br />
The activity associated with rescue drilling interfered with the seismic location system. The<br />
steep terrain required extensive development <strong>of</strong> roads <strong>and</strong> drill pads to support the drilling. The<br />
earthwork <strong>and</strong> the drilling itself generated too much seismic noise to effectively monitor for any<br />
signals from the miners. At the sensitivity required to detect miners at that depth, even vehicular<br />
<strong>and</strong> pedestrian traffic interfered with the system. However, due to the fact that the system<br />
response to signals is primarily vertical, the underground rescue operations, 2,400 to 1,600 feet<br />
away horizontally, were not believed to be interfering with the system.<br />
Because <strong>of</strong> the priority given to completion <strong>of</strong> the rescue boreholes, monitoring was essentially<br />
limited to the quiet times established after the completion <strong>of</strong> each borehole. Drilling <strong>and</strong> surface<br />
operations were not stopped to establish additional quiet times. A noise, which was interpreted<br />
as not characteristic <strong>of</strong> miners, was a factor in determining the location <strong>of</strong> Borehole No. 4. No<br />
other signals were detected. Other than the previously mentioned event, the system did not play<br />
a role in the rescue.<br />
A portable seismic system was used underground. The range <strong>of</strong> the system is approximately<br />
200 feet. The trapped miners were over 2,400 feet away. The system was deployed on a water<br />
pipe that extended towards the section in an attempt to exp<strong>and</strong> the operational range. No signals<br />
were detected.<br />
The extent <strong>of</strong> the collapse <strong>and</strong> the atmospheric analyses from boreholes indicated that the miners<br />
were likely incapable <strong>of</strong> signaling. If they survived the collapse, the atmosphere would have<br />
rendered the miners unconscious unless they immediately donned their SCSR units <strong>and</strong> retreated<br />
148
to the breathable air in the bleeder entry near Borehole Nos. 3 <strong>and</strong> 4. These boreholes did not<br />
indicate any evidence <strong>of</strong> the miners.<br />
Emergency Response Plan<br />
Section 2 <strong>of</strong> the <strong>Mine</strong> Improvement <strong>and</strong> New Emergency Response Act <strong>of</strong> 2006 (MINER Act)<br />
requires underground coal mine operators to have an Emergency Response Plan (ERP), which is<br />
to be approved by <strong>MSHA</strong>. The ERP in effect at the time <strong>of</strong> the accident was approved on<br />
June 13, 2007.<br />
<strong>MSHA</strong> emphasizes that, in the event <strong>of</strong> a mine emergency, every effort must be made by miners<br />
to evacuate the mine. Barricading should be considered an absolute last resort <strong>and</strong> should be<br />
considered only when evacuation routes have been physically blocked. Lifelines, tethers,<br />
SCSRs, <strong>and</strong> proper training provide essential tools for miners to evacuate through smoke <strong>and</strong><br />
irrespirable atmospheres.<br />
The operator must periodically update the ERP to reflect: changes in operations in the mine, such<br />
as a change in systems <strong>of</strong> mining or mine layout, <strong>and</strong> relocation <strong>of</strong> escapeways; advances in<br />
technology; or other relevant considerations. When changes to the ERP are required, <strong>MSHA</strong><br />
approval must be obtained before the changes are implemented.<br />
Section 2(b)(2)(B)(i) <strong>of</strong> the MINER Act requires that the ERP shall provide for the evacuation<br />
"<strong>of</strong> all individuals endangered" by an emergency. The individuals covered by this provision do<br />
not include properly trained <strong>and</strong> equipped persons essential to respond to a mine emergency, as<br />
permitted in 30 C.F.R. § 75.1501(b).<br />
The ERP established provisions for storage <strong>of</strong> Self-Rescuers, Lifelines, Post-Accident<br />
Communications, Post-Accident Tracking, Training, Post-Accident Logistics, Post-Accident<br />
Breathable Air, Local Coordination, <strong>and</strong> Additional Provisions. The Post-Accident Breathable<br />
Air provision <strong>of</strong> the plan had not been implemented at the time <strong>of</strong> the accident. It was required<br />
to be implemented within 60 days after the June 13, 2007, approval letter.<br />
Notification<br />
The ERP included a list <strong>of</strong> emergency responders that will be notified following an emergency:<br />
<strong>MSHA</strong> One Call 24/7, Ambulance 911, Police 911, Castleview Hospital, Emery Medical, Poison<br />
Control, <strong>and</strong> <strong>MSHA</strong>’s Price Field Office. The list also included names <strong>and</strong> phone numbers <strong>of</strong><br />
company <strong>of</strong>ficials, mine rescue teams, <strong>and</strong> several mine emergency equipment suppliers.<br />
Five miners underground responded to the emergency. Soon after the accident occurred at<br />
2:48 a.m., these men evaluated the mine conditions. They observed that numerous ventilation<br />
controls had been blown out <strong>and</strong> the entries leading into the section were blocked. They called<br />
Lel<strong>and</strong> Lobato (AMS operator) at approximately 3:13 a.m., to relay this information <strong>and</strong><br />
instructed him to notify Gary Peacock (superintendent), <strong>of</strong> the mine emergency. By this time,<br />
the underground miners making the call to the surface were aware that a mine emergency<br />
existed. Lobato briefed Peacock with the information that he had received from the men<br />
underground. He also told him that 18 minutes had passed since he lost communication with the<br />
section. At 3:25 a.m., Hardee was outside in the safety <strong>of</strong>fice gathering self contained breathing<br />
apparatus units that the men underground had requested. Before traveling underground he had a<br />
brief telephone discussion with Peacock, who was at his home, to apprise him <strong>of</strong> the situation.<br />
Peacock then called Bodee Allred (safety director) at 3:30 a.m. <strong>and</strong> apprised him <strong>of</strong> the accident.<br />
Peacock instructed Allred to mobilize the mine rescue team <strong>and</strong> to contact <strong>MSHA</strong>, in that order.<br />
149
The call lasted five minutes. Allred called the mine rescue teams at 3:36 a.m. <strong>and</strong> <strong>MSHA</strong>’s tollfree<br />
number for immediately reportable accidents at 3:43 a.m. More than 15 minutes had<br />
elapsed from the time that persons underground became aware <strong>of</strong> the emergency <strong>and</strong> the time<br />
that <strong>MSHA</strong> was notified.<br />
Bodee Allred reported to <strong>MSHA</strong>’s toll-free number operator that there was a bounce, that pillar<br />
recovery had been occurring in the mine, that they had an unintentional cave, <strong>and</strong> that they lost<br />
ventilation. He also reported that they did not know if it knocked out stoppings, that visibility<br />
was poor, <strong>and</strong> that miners could not see past crosscut 92. <strong>MSHA</strong>’s toll-free number report form<br />
indicated no injuries, no death, no fire, <strong>and</strong> no one trapped.<br />
Self-Rescuers<br />
The operator provided CSE SR-100, Self-Contained Self-Rescuers (SCSR) for use as required by<br />
30 CFR Part 75 requirements. The ERP defined storage <strong>and</strong> reliability requirements for the<br />
units. At the time <strong>of</strong> the accident, all SCSR units were located in the areas stipulated in the ERP.<br />
Following the accident, five miners initiated a rescue attempt into the South Barrier section.<br />
Two miners used Dräger, 30-minute, self-contained breathing apparatus units (SBAs), two used<br />
the CSE SR-100, <strong>and</strong> one did not don any type <strong>of</strong> unit. Tim Curtis <strong>and</strong> Brian Pritt were trained<br />
to use the SBAs as members <strong>of</strong> the mine fire brigade. Tim Harper <strong>and</strong> Jameson Ward donned<br />
the SR-100s to cope with dust in the atmosphere. Harper <strong>and</strong> Ward stated that the SCSR units<br />
activated properly, <strong>and</strong> performed as expected without incident. Brent Hardee did not don any<br />
type <strong>of</strong> unit. During their attempt to advance into the section, the miners retreated after<br />
encountering low levels <strong>of</strong> oxygen <strong>and</strong> adverse ground conditions. The lowest oxygen level<br />
detected was 16.0%.<br />
Post-Accident Logistics<br />
The comm<strong>and</strong> center was located on the second floor <strong>of</strong> the warehouse building (AMS<br />
dispatcher <strong>and</strong> safety <strong>of</strong>fice) as required by the ERP. On August 6, the comm<strong>and</strong> center was<br />
established <strong>and</strong> manned by <strong>MSHA</strong> <strong>and</strong> GRI personnel to formulate the plans for the rescue<br />
operation <strong>and</strong> to coordinate initial exploration by mine rescue teams. Later, <strong>MSHA</strong> personnel<br />
were principally located in the <strong>MSHA</strong> mobile comm<strong>and</strong> center vehicle immediately adjacent to<br />
the warehouse, while the comm<strong>and</strong> center in the warehouse building was primarily manned by<br />
GRI. Both locations were linked to the underground communication system <strong>and</strong> to each other.<br />
Joint meetings between GRI <strong>and</strong> <strong>MSHA</strong> were held twice daily <strong>and</strong> more <strong>of</strong>ten when necessary.<br />
New or revised plans were formulated <strong>and</strong> approved by both groups, which would meet at either<br />
location. Separate locations for mine operator <strong>and</strong> <strong>MSHA</strong> personnel were not typical for past<br />
mine emergency comm<strong>and</strong> center operations.<br />
The ERP detailed that the family accommodations will be located in the main shop on mine<br />
property. However, this location was not used. On August 6, 2007, the families were<br />
accommodated for a short time at the Senior Citizens Center in Huntington, Utah, <strong>and</strong> relocated<br />
later that day to the Canyon View Jr. High School in the same town. On August 18, 2007,<br />
family accommodations were established at the Desert Edge Christian Center Chapel, also in<br />
Huntington, <strong>and</strong> remained there until August 31, 2007, when all rescue operations were<br />
suspended.<br />
Exceptional security <strong>and</strong> traffic control was provided by Emery County Sheriff Lamar Guymon<br />
<strong>and</strong> his department at the mine <strong>and</strong> at family accommodation sites. The Emery County Sheriff’s<br />
Office also provided <strong>and</strong> manned a comm<strong>and</strong> vehicle that was stationed on State Route 31 at the<br />
150
entrance to the mine access road. Press conferences <strong>and</strong> accommodations were provided at this<br />
location.<br />
The State <strong>of</strong> Utah also provided support during the rescue efforts. The Governor <strong>and</strong> his staff<br />
met with the family members <strong>and</strong> assisted with both the media <strong>and</strong> family briefings. The<br />
Department <strong>of</strong> Public <strong>Safety</strong>, through the Utah Highway Patrol, assisted the Emery County<br />
Sherriff with traffic control. The Division <strong>of</strong> Homel<strong>and</strong> Security provided transportation <strong>of</strong><br />
supplies <strong>and</strong> equipment. The Department <strong>of</strong> Natural Resources assisted with media relations<br />
with the Director <strong>of</strong> the Division <strong>of</strong> Oil, Gas <strong>and</strong> Mining, John R. Baza, the senior state <strong>of</strong>ficial<br />
on location for most <strong>of</strong> the rescue effort. The American Red Cross <strong>and</strong> the Salvation Army also<br />
provided assistance at the mine site <strong>and</strong> to the families during rescue efforts.<br />
Lifelines<br />
Directional lifelines were installed in the primary <strong>and</strong> secondary escapeways from the working<br />
section to the surface. The directional lifelines were marked with reflective material every<br />
25 feet <strong>and</strong> had directional indicators showing the escape route at intervals no greater than<br />
100 feet. The small end <strong>of</strong> the directional cone was facing inby. Before the accident, both<br />
lifelines had been installed. Lifelines outby the area affected by the accident were intact. At the<br />
edge <strong>of</strong> the collapse area, they extended inby above the rubble or were embedded into the top <strong>of</strong><br />
the rubble.<br />
Post-Accident Communication<br />
The mine utilized two independent hardwired communication systems that were located in<br />
separate entries to provide redundant means <strong>of</strong> communication between the surface <strong>and</strong> persons<br />
underground. Each independent system consisted <strong>of</strong> a number <strong>of</strong> pager phones installed<br />
throughout the underground mine <strong>and</strong> linked to various locations on the surface. On the South<br />
Barrier section, one pager phone system was located in the primary escapeway, No. 1 entry, <strong>and</strong><br />
the other was in the alternate escapeway, No. 4 entry. These two systems were in place before<br />
the accident.<br />
Although not an <strong>MSHA</strong> requirement, a Personal Emergency Device (PED) system was used as<br />
an additional means <strong>of</strong> in-mine communication. The PED is a one-way communication system<br />
integrated with the miner’s cap lamp battery. The AMS operator is capable <strong>of</strong> sending text<br />
messages from the surface location to any miner that is carrying a PED unit. The receiving unit<br />
was not capable <strong>of</strong> verifying back to the sender that a message was received nor was it capable <strong>of</strong><br />
transmitting messages.<br />
The PED system was comprised <strong>of</strong> a surface computer <strong>and</strong> an underground computer/transmitter<br />
located at crosscut 44. A loop antenna was located in the Nos. 1 <strong>and</strong> 2 entries <strong>of</strong> Main West<br />
from the transmitter to Main West crosscut 107, to Main North crosscut 25, <strong>and</strong> back to the<br />
transmitter, a distance <strong>of</strong> approximately 4.8 miles. While the accident on August 6, 2007,<br />
damaged ventilation controls as far outby as crosscut 90, it did not appear that the loop antenna<br />
was damaged. Text messages were successfully received by rescuers during the initial rescue<br />
attempt. Because the PED system was still operational after the accident, it was likely that if the<br />
receiving unit Don Erickson was carrying was still operational, messages would have been<br />
received by the unit.<br />
During the rescue operation, a two-way voice activated microphone was lowered into accessible<br />
boreholes that were open to the mine level. The microphone was turned on each time it was<br />
lowered into the mine void. No record was kept <strong>of</strong> exactly how long a microphone remained in<br />
151
each hole. The microphone was not removed until it was certain that no sounds <strong>of</strong> life were<br />
heard. If a mine pager phone was located anywhere near a borehole <strong>and</strong> the phone system had<br />
survived the accident, the microphone would have picked up any messages broadcast from the<br />
pager phones. During the listening time, no pager phone communication was heard. The<br />
accident involved all four entries leading into the South Barrier section. Because <strong>of</strong> the violent<br />
nature <strong>and</strong> magnitude <strong>of</strong> the burst, it is highly unlikely that this part <strong>of</strong> the pager phone system<br />
remained intact.<br />
Post-Accident Tracking<br />
The mine utilized a dispatcher system (AMS operator) to track miners underground by using a<br />
magnetic tracking board <strong>and</strong> later an electronic spreadsheet. There were five tracking zones<br />
from the portal to the South Barrier section. Pager phones were located at all zone intersections,<br />
the belt head <strong>of</strong> each section, belt flight transfer points, <strong>and</strong> in the bleeder travelway. All zone<br />
intersections were marked with placards. The magnetic tracking board was located at the AMS<br />
operator’s station <strong>and</strong> when a person called out with their location, the AMS operator moved the<br />
magnetic strip with their name to that location on the board. Another magnetic board was<br />
located in a room in the underground mine <strong>of</strong>fice/bathhouse near the mine portal. This was used<br />
as the check-in, check-out board required by 30 CFR 75.1715. Before entering or leaving the<br />
mine, each person moved his/her nametag to correspond with their location. Based on company<br />
records <strong>and</strong> interviews obtained during the investigation, the system was effective on August 6.<br />
However, problems with the dispatcher system did occur during the August 16 accident, as<br />
discussed later in this report.<br />
Local Coordination<br />
A complete list <strong>of</strong> emergency responders <strong>and</strong> their phone numbers was included in the ERP.<br />
This list included <strong>MSHA</strong>’s 1-800 number, mine management contact information, <strong>and</strong> mine<br />
rescue teams. The list also included contact information for mine emergency suppliers,<br />
including: mine drilling services, mining cranes, heavy equipment, nitrogen foam <strong>and</strong><br />
generators, gas detection/ mine rescue equipment, <strong>and</strong> ventilation sealing services. Local<br />
emergency responders, including airlift providers, were familiar with the mine location,<br />
operation, <strong>and</strong> personnel.<br />
On August 6, 2007, following the accident, Mark Toomer, AMS operator, called the Emery<br />
County Emergency Dispatcher at 3:52 a.m., <strong>and</strong> requested that an ambulance be sent to the mine<br />
for a possible mine emergency. The ambulance arrived on mine property at 4:22 a.m. escorted<br />
by an <strong>of</strong>ficer from the Emery County Sheriff’s Office. The ambulance remained at the mine that<br />
day but was not needed.<br />
Training<br />
Training was provided in accordance with the ERP. The miners <strong>and</strong> mine managers who were<br />
interviewed were familiar with the ERP requirements <strong>and</strong> the operator’s records documented that<br />
the required training was completed.<br />
Post-Accident Breathable Air<br />
The plan described the locations in the mine where post-accident breathable air is to be provided.<br />
It also discusses oxygen consumption rates, air supply, purging <strong>of</strong> the safe haven barricade,<br />
chemicals used for scrubbing carbon dioxide, <strong>and</strong> a map identifying locations <strong>of</strong> the supplies.<br />
The post-accident breathable air provisions were not required until 60 days following approval <strong>of</strong><br />
the ERP, which was approved on June 13, 2007. At the time <strong>of</strong> the accident, the post-accident<br />
breathable air provisions <strong>of</strong> the ERP had not been implemented.<br />
152
On August 9, 2007, the operator ordered two Strata Emergency Air/Barricade Skids, one 32-man<br />
unit <strong>and</strong> one 11-man unit from Strata <strong>Safety</strong> Products, LLC, <strong>of</strong> Jasper, Alabama, as documented<br />
by a purchase order. Delivery was expected in April 2008.<br />
Additional Provisions<br />
The plan identified additional materials that must be stored on an Emergency Materials Skid<br />
<strong>and</strong>/or trailer <strong>and</strong> its location. Some <strong>of</strong> these materials included: a first aid kit, ro<strong>of</strong> jacks or<br />
timbers, wedges, tools, brattice material, <strong>and</strong> foam packs. A complete list was detailed in the<br />
approved ERP. The operator provided information showing that the skid was located near<br />
crosscut 122 <strong>and</strong> later moved to crosscut 113.<br />
Family Liaisons<br />
Under Section 7 <strong>of</strong> the <strong>Mine</strong> Improvement <strong>and</strong> New Emergency Response Act <strong>of</strong> 2006 (MINER<br />
Act), the Secretary <strong>of</strong> Labor established a policy that required the temporary assignment <strong>of</strong> a<br />
Department <strong>of</strong> Labor <strong>of</strong>ficial to be a liaison between the Department <strong>and</strong> the families <strong>of</strong> victims<br />
<strong>of</strong> mine tragedies involving multiple deaths. It also requires <strong>MSHA</strong> to be as responsive as<br />
possible to requests from the families <strong>of</strong> mine accident victims for information relating to mine<br />
accidents. In addition, it requires that in such accidents, <strong>MSHA</strong> serve as the primary<br />
communicator with the operator, miners’ families, the press, <strong>and</strong> the public.<br />
<strong>MSHA</strong> personnel were assigned as family liaisons to establish communication with the victims’<br />
families. They were: William Denning, District 9 Staff Assistant; Carla Marcum, District 7,<br />
Specialist; Robert Gray, District 10, <strong>Health</strong> Supervisor; <strong>and</strong> Richard Laufenberg, Metal/Non-<br />
Metal Rocky Mountain District, Assistant District Manager. These individuals were specially<br />
trained by the National Transportation <strong>Safety</strong> Board to serve as family liaisons between <strong>MSHA</strong><br />
<strong>and</strong> families during mine accidents involving fatal injuries or where miners are unaccounted for.<br />
They maintained constant contact with family members <strong>and</strong> met with them for regular briefings<br />
to provide updates <strong>and</strong> answer questions. These designated family liaisons were assisted by<br />
other <strong>MSHA</strong> personnel in support <strong>of</strong> the victims’ families’ needs. Also, the Assistant Secretary<br />
<strong>of</strong> Labor, the Administrator for Coal <strong>Mine</strong> <strong>Safety</strong> <strong>and</strong> <strong>Health</strong>, <strong>and</strong> the District 9 District Manager<br />
played key roles communicating with the operator, miners’ families, the press, <strong>and</strong> the public.<br />
<strong>MSHA</strong>’s Lead Accident Investigator regularly conducted family briefings in person <strong>and</strong> by<br />
telephone during the weeks <strong>and</strong> months following the accident. These briefings provided the<br />
families an opportunity to follow the progress <strong>of</strong> the investigation, to ask questions <strong>and</strong> to<br />
contribute any information to the investigation.<br />
<strong>Mine</strong> Emergency Evacuation <strong>and</strong> Firefighting Program <strong>of</strong> Instruction<br />
Section 30 CFR 75.1502 requires each operator <strong>of</strong> an underground coal mine to adopt <strong>and</strong> follow<br />
a mine emergency evacuation <strong>and</strong> firefighting program that instructs all miners in the proper<br />
procedures they must follow if a mine emergency occurs. <strong>MSHA</strong> approved the <strong>Mine</strong> Emergency<br />
Evacuation <strong>and</strong> Firefighting Program <strong>of</strong> Instruction (Program) on March 16, 2007. This<br />
Program must be reviewed with all miners annually <strong>and</strong> with newly employed miners prior to<br />
assignments <strong>of</strong> work duties in accordance with 30 CFR Part 48.<br />
The Program includes provisions for: fire, explosion, water <strong>and</strong> gas inundation emergency<br />
procedures; location <strong>and</strong> use <strong>of</strong> fire-fighting equipment; location <strong>of</strong> escapeways; exits <strong>and</strong> routes<br />
<strong>of</strong> travel; evacuation procedures; fire drills; SCSR location, use <strong>and</strong> storage; AMS fire detection;<br />
operation <strong>of</strong> fire suppression equipment; mine emergency evacuation drills; two-entry response<br />
153
parameters, <strong>and</strong> mine emergency scenarios. Portions <strong>of</strong> the approved Program relevant to the<br />
August 2007 accidents are discussed in the following sections <strong>of</strong> this report.<br />
Procedures for Evacuation<br />
The Program stated in part, “The proper evacuation procedures shall be initiated by the<br />
Responsible Person who has current knowledge <strong>of</strong> assigned locations <strong>and</strong> expected movement <strong>of</strong><br />
miners. This Responsible Person shall also be knowledgeable in escapeways, mine<br />
communications, mine monitoring systems, mine emergency evacuation, firefighting program <strong>of</strong><br />
instruction, <strong>and</strong> all personnel qualified to respond to emergencies.” The Program did not<br />
specifically identify the Responsible Person by name or title, but clearly defined their duties <strong>and</strong><br />
responsibilities. In practice, the shift foreman was typically identified as the Responsible Person<br />
for each shift. A nameplate located above the mine check-in/check-out board identified this<br />
specific person each shift. If the Responsible Person changed during the shift, all miners were<br />
notified before the start <strong>of</strong> the shift when this change was to occur. The Program did not define<br />
the physical location <strong>of</strong> the Responsible Person during the shift.<br />
The Responsible Person on the night shift, August 5/6, (6:00 p.m. to 6:00 a.m.) was Gale<br />
Anderson. Anderson, Benny Allred, <strong>and</strong> Powell were scheduled to attend training on August 6,<br />
<strong>and</strong> would not have been working their entire scheduled shift. Therefore, Anderson designated<br />
Don Erickson to act as the Responsible Person during his absence. Anderson, Benny Allred, <strong>and</strong><br />
Powell exited the mine around 9:00 p.m. <strong>and</strong> left the mine property sometime after 10:00 p.m.<br />
The program stated, “the procedure for rapid assembly <strong>and</strong> transportation <strong>of</strong> persons necessary<br />
to respond to the specific mine emergency, emergency equipment, <strong>and</strong> rescue apparatus to the<br />
scene <strong>of</strong> the emergency shall be initiated, by the responsible person in charge, who will notify the<br />
mine rescue team so that equipment can be assembled”. Erickson, working in the South Barrier<br />
section, was one <strong>of</strong> the six miners entrapped in the section <strong>and</strong>, therefore, was not able to<br />
respond as the designated Responsible Person.<br />
Lel<strong>and</strong> Lobato (AMS operator) was stationed on the second floor <strong>of</strong> the shop/<strong>of</strong>fice building<br />
which was located several hundred yards from the mine opening. His assigned duties included<br />
monitoring the AMS <strong>and</strong> underground mine communication systems, along with documenting<br />
the location <strong>and</strong> movement <strong>of</strong> miners. On August 6, Lobato was training Mark Toomer as a new<br />
AMS operator.<br />
There were five miners underground at the time <strong>of</strong> the accident in addition to the six miners in<br />
the working section. Peacock talked with them from his home through the AMS operator. An<br />
evacuation <strong>of</strong> the mine was not ordered because all miners underground were needed to assess<br />
post accident conditions <strong>and</strong> restore ventilation.<br />
Atmospheric Monitoring System (AMS) Fire Detection<br />
The primary function <strong>of</strong> the AMS system was fire detection with sensors capable <strong>of</strong> detecting<br />
levels <strong>of</strong> carbon monoxide. The system also continuously monitored mine electrical power,<br />
mine conveyor belts <strong>and</strong> tonnage, <strong>and</strong> fan operation. The accident did not involve fire or<br />
explosion. Therefore, none <strong>of</strong> the sensors detected alert or alarm levels <strong>of</strong> carbon monoxide. A<br />
requirement <strong>of</strong> the system is that it shall automatically provide visual <strong>and</strong> audible signals at the<br />
designated surface location for any interruption <strong>of</strong> circuit continuity <strong>and</strong> any electrical<br />
malfunction <strong>of</strong> the system.<br />
The system functioned properly at the time <strong>of</strong> the August 6 accident. After the accident, the<br />
system alarmed <strong>and</strong> recorded a communication failure for all sensors located from the No. 6 belt<br />
154
drive inby including the working section. The main fan continued operating during the entire<br />
event without interruption but the AMS system did record a change in pressure.<br />
Training Plan<br />
The approved Part 48 Training Plan was reviewed to verify that the plan met the requirements <strong>of</strong><br />
30 CFR 48.3. The plan included all required subject matter. An addendum to the plan included<br />
<strong>Mine</strong> Emergency Evacuation instructions for the donning <strong>and</strong> transfer <strong>of</strong> self-rescue devices.<br />
The training records required by 30 CFR 48.9 were reviewed for all miners employed at the<br />
Cr<strong>and</strong>all Canyon <strong>Mine</strong> at the time <strong>of</strong> the accident. Based on this review <strong>and</strong> interviews<br />
conducted during the investigation it was determined that training met the requirements <strong>of</strong><br />
30 CFR Part 48.<br />
August 16 Accident Discussion<br />
The August 6, 2007, accident rendered all entries to the working section inaccessible <strong>and</strong> there<br />
was no further communication with the crew <strong>of</strong> six miners working there. Burst coal filled or<br />
partially obstructed mine openings, blocking all approaches to the section. The force <strong>of</strong> the burst<br />
damaged ro<strong>of</strong> supports in some locations <strong>and</strong> the associated air blast damaged stoppings over a<br />
broader area.<br />
There is no record 17 <strong>of</strong> a disaster <strong>of</strong> this type in the last 50 years <strong>of</strong> U.S. mining history. The<br />
miners were located beneath 1,760 feet <strong>of</strong> overburden in rugged terrain with difficult access.<br />
<strong>MSHA</strong>’s mine rescue capsule, which had proved effective at the Quecreek #1 <strong>Mine</strong> in 2002, had<br />
never been deployed at such depth. The miners also were separated from coworkers<br />
underground by approximately 2,400 feet <strong>of</strong> rubble-filled entries. An underground rescue<br />
through this type <strong>and</strong> extent <strong>of</strong> failed ground was unprecedented.<br />
While surface drilling efforts were being initiated to locate the entrapped miners, plans were<br />
formulated for an underground rescue effort. The underground rescue work involved<br />
reestablishing ventilation, clearing a travelway through the failed pillars, <strong>and</strong> re-supporting the<br />
ro<strong>of</strong> as necessary. The degree <strong>of</strong> ground failure was so extensive that the clean-up effort began<br />
at crosscut 120 <strong>of</strong> the South Barrier section. The repair <strong>of</strong> ventilation controls began more than<br />
one mile from the entrapped miners.<br />
Initial efforts to reach the miners via the No. 4 entry progressed only 300 feet before a burst<br />
occurred that refilled much <strong>of</strong> the path that had been cleared. No one was injured, but the<br />
occurrence emphasized the need to provide rescue workers some form <strong>of</strong> protection against<br />
further bursts. The subsequent rescue plan relocated the effort to the No. 1 entry <strong>and</strong><br />
incorporated several elements to mitigate the burst hazard.<br />
St<strong>and</strong>ing supports were installed on either side <strong>of</strong> the No. 1 entry. They were placed outby for a<br />
distance <strong>of</strong> several hundred feet before recovery work began <strong>and</strong> then they were installed behind<br />
the clean-up face as it advanced. Initially, wood timbers were used in conjunction with a<br />
hydraulic pre-loading device to wedge them between the ro<strong>of</strong> <strong>and</strong> floor. However, they were<br />
only used for a distance <strong>of</strong> about 200 feet, when another form <strong>of</strong> hydraulically wedged st<strong>and</strong>ing<br />
support, RocProps, was employed. As clean-up advanced in the No. 1 entry, a number <strong>of</strong><br />
changes were implemented to enhance the support system <strong>and</strong>/or to reduce worker exposure.<br />
155
Advance rate in the No. 1 entry between August 8 <strong>and</strong> 12 was somewhat erratic but afterward<br />
became relatively consistent at about 65 feet per day. The haul distance between the clean-up<br />
face <strong>and</strong> the belt feeder increased as the clean-up advanced. Also, the amount <strong>of</strong> debris<br />
encountered in the No. 1 entry increased substantially. In some areas between crosscuts, the<br />
barrier side rib was observed to have moved up to 10 feet into the entry. The entry was<br />
completely filled <strong>and</strong> had the appearance <strong>of</strong> a previously unmined face. In some areas, ro<strong>of</strong> bolts<br />
had been sheared <strong>and</strong>/or damaged <strong>and</strong> hazardous ro<strong>of</strong> conditions were encountered. Despite all<br />
these issues, rescue workers managed to find efficient means to overcome the problems they<br />
encountered <strong>and</strong> maintain a steady rate <strong>of</strong> progress. Although some bounces were noted, the<br />
support system was effective in containing coal dislodged from the ribs.<br />
The first surface borehole penetrated the mine workings inby the collapse at 9:58 p.m. on<br />
August 9. Information that the mine atmosphere contained only about 8% oxygen was not<br />
encouraging. However, the rescue effort continued with the prospect that the miners could have<br />
escaped to another area <strong>of</strong> the mine with a favorable atmosphere or that they may have<br />
barricaded safely. Air quality could not be evaluated at Borehole No. 2 when it penetrated the<br />
workings at 12:57 a.m. on August 11. However, the presence <strong>of</strong> a 5½-foot void at mine level<br />
(similar to the void at No. 1) provided encouragement that perhaps the burst had not affected the<br />
mine openings in the area where the miners had been working.<br />
Between August 10 <strong>and</strong> 13, the reported location <strong>of</strong> bounces <strong>and</strong> bursts was somewhat mixed<br />
(i.e., at the clean-up face, outby crosscut 120, away from the No. 1 entry <strong>and</strong> unknown).<br />
However, from August 13 to 16, the reports indicated that the activity was most <strong>of</strong>ten associated<br />
with areas outby the fresh air base (FAB) at Crosscut 119. Changes in ro<strong>of</strong> conditions also were<br />
noted outby the FAB <strong>and</strong>, in response, additional st<strong>and</strong>ing supports were installed <strong>and</strong> an array<br />
<strong>of</strong> convergence stations was established to monitor ground behavior. Bursts occurred in the<br />
clean-up face periodically but were either at the continuous mining machine inby the RocProps<br />
or they were contained by the RocProps.<br />
Subsequent analyses <strong>of</strong> satellite images <strong>and</strong> information gained from later surface boreholes<br />
revealed that the degree <strong>of</strong> damage encountered in the No. 1 entry would have worsened<br />
substantially before the rescuers reached the last known location <strong>of</strong> the miners. However, this<br />
information was not available on August 16. At that time, rescuers were operating under the<br />
premise that the worst conditions were likely associated with the overlying ridgeline (i.e., the<br />
greatest overburden depth). Calculations at the time were consistent with that premise. It was<br />
anticipated that the conditions observed on the outby side <strong>of</strong> the collapse would correlate to<br />
conditions under similar overburden on the inby side. Thus, there was hope that the miners had<br />
not been subjected to the effects <strong>of</strong> bursting coal <strong>and</strong> could have retreated to a safe area. This<br />
hope was bolstered when, at 10:11 a.m. on August 15, Borehole No. 3 penetrated 8 feet high<br />
workings that contained 17% oxygen.<br />
At 10:04 a.m. on August 16, a burst occurred in the clean-up area that filled the entry between<br />
the continuous mining machine <strong>and</strong> the pillar rib to a depth <strong>of</strong> approximately 2½ feet. No one<br />
was injured <strong>and</strong> the event did not displace the support system. The debris was cleared <strong>and</strong> the<br />
clean-up cycle continued. A gradual opening encountered in the recovery face on August 16 was<br />
perceived as an indication that a travelable opening might be encountered soon. Efforts were<br />
initiated to prepare a mine rescue team to enter the area if that opportunity arose. Neither the<br />
burst that occurred at 6:38 p.m. on August 16 nor the associated failure <strong>of</strong> the support system<br />
was anticipated.<br />
156
Ground Control during Rescue Efforts<br />
Pillar bursting in the South Barrier filled or partially obstructed entries up to 20 crosscuts outby<br />
the pillar line. The force <strong>of</strong> the burst damaged ro<strong>of</strong> supports in some locations <strong>and</strong> the associated<br />
air blast damaged stoppings over a broader area. Thus, the underground rescue work involved<br />
reestablishing ventilation, clearing a travelway through the failed pillars, <strong>and</strong> re-supporting the<br />
ro<strong>of</strong> as necessary.<br />
Selection <strong>of</strong> Entry for Rescue Work<br />
Initial efforts to reach the entrapped miners were focused on clean-up in the Nos. 3 <strong>and</strong> 4 entries.<br />
The August 7 burst forced the rescue effort to be temporarily halted until another plan could be<br />
developed. A revised plan was proposed by the mine operator <strong>and</strong> approved by <strong>MSHA</strong> the<br />
evening <strong>of</strong> August 7, 2007. This plan relocated the rescue operation from the No. 4 entry to the<br />
No. 1 entry (see Figure 3). After the August 7 burst, the Nos. 3 <strong>and</strong> 4 entries were refilled to a<br />
depth <strong>of</strong> at least 6 ½ feet inby crosscut 120 (see Figure 4) <strong>and</strong> the ro<strong>of</strong> continued to work (make<br />
noise indicative <strong>of</strong> continued failure) to the north <strong>and</strong> outby this location. In contrast, coal depth<br />
<strong>and</strong> rock noise were less in the No. 1 entry. Also, recovery in the No. 1 entry allowed rescue<br />
work to be conducted in intake air with air returning in the Nos. 2, 3, <strong>and</strong> 4 entries.<br />
The initial rescue effort in No. 4 entry provided little protection against hazards related to coal<br />
bursts. However, the August 7 event heightened the rescuers’ awareness <strong>of</strong> the potential for<br />
further ground failure. In response, the operator proposed <strong>and</strong> <strong>MSHA</strong> approved a plan to<br />
mitigate the hazard. One element <strong>of</strong> the plan was the support system installed concurrent with<br />
advance. This system was intended to protect workers should a burst occur. Additional<br />
elements were intended to reduce the likelihood <strong>of</strong> bursts. For example, precautions were taken<br />
to minimize the disturbance <strong>of</strong> failed pillars. Clean-up was limited to the minimum width<br />
necessary to allow the support system to be installed. Clean-up was limited to one entry <strong>and</strong><br />
crosscuts were occasionally cleared to provide space for personnel or equipment.<br />
Intuitively, the No. 1 entry could have been perceived as a poor choice for the rescue effort. As<br />
discussed earlier, abutment stress levels typically are highest near gob areas. Since the No. 1<br />
entry is nearest the mined-out longwall panel 13 south <strong>of</strong> Main West, it could be assumed that<br />
the pillar between Nos. 1 <strong>and</strong> 2 entries would be the most highly stressed <strong>and</strong> most burst-prone.<br />
However, observed ground conditions were inconsistent with this expectation. Pillar damage on<br />
the outby edge <strong>of</strong> the collapsed area appeared to be more severe near the Main West entries <strong>and</strong><br />
better near the barrier. In choosing the No. 1 entry, it was noted that the 121-foot wide barrier<br />
beside the No. 1 entry had a width-to-height (W/H) ratio <strong>of</strong> 15. In contrast, the minimum 55-foot<br />
wide barrier (measured to the Main West notches) adjacent to No. 4 entry had a W/H ratio <strong>of</strong><br />
approximately 9. Historically, pillars with W/H ratios in the range <strong>of</strong> 5 to 10 have been<br />
associated with bursts.<br />
As the mine operator prepared to advance in the No. 1 entry, <strong>MSHA</strong> performed ARMPS<br />
<strong>and</strong> LaModel analyses. These analyses were done to gain insight to the mechanics <strong>of</strong> the<br />
failure <strong>and</strong> to estimate the extent <strong>and</strong> severity <strong>of</strong> poor ground conditions likely to be<br />
encountered during the rescue. Both LaModel <strong>and</strong> ARMPS models showed that pillars<br />
throughout the Main West area (including the North <strong>and</strong> South Barrier sections) may<br />
have been involved with the failure that had occurred on August 6. The results were<br />
supported by descriptions <strong>of</strong> bursting in the North Barrier section, pillar damage observed<br />
during the August 7 exploration inby the Main West seals at crosscut 118, <strong>and</strong> reports <strong>of</strong><br />
substantial floor heave outby the South Barrier section pillar line in the vicinity <strong>of</strong><br />
crosscuts 138 to 140.<br />
157
GRI furnished a map to <strong>MSHA</strong> during the rescue effort on which topography was slightly<br />
shifted out <strong>of</strong> position over the mine workings. This map was used to note the general<br />
positions <strong>of</strong> valleys <strong>and</strong> ridges during rescue operations. However, this map was not used<br />
as a basis for any detailed analysis.<br />
On the basis <strong>of</strong> engineering analyses <strong>and</strong> underground observations, <strong>MSHA</strong> considered<br />
on August 9 that the South Barrier failure most likely could be attributed to instability<br />
within the large expanse <strong>of</strong> nearly equal size pillars created by mining in Main West <strong>and</strong><br />
the adjacent north <strong>and</strong> south barriers. Progressive pillar failure was thought to have<br />
occurred within the Main West pillars inby the seals at crosscut 118 under the deepest<br />
overburden along the East Mountain ridge. <strong>MSHA</strong> surmised that the failure <strong>of</strong> Main<br />
West would have shifted load onto the South Barrier section pillars <strong>and</strong> that this load<br />
could have generated the extensive failure in the South Barrier section. Analyses<br />
available at that time indicated that it was possible that the burst originated under the<br />
deepest cover <strong>of</strong> the East Mountain ridge <strong>and</strong> that the miners, who were located under<br />
shallower overburden, may not have been subjected to the extensive pillar burst.<br />
However, the potential effects <strong>of</strong> the air blast on the entrapped miners’ location could<br />
have been worse than the air blast that propagated outby (eastward).<br />
Information gained from the first three surface boreholes drilled into the mine supported the<br />
belief that the inby extent <strong>of</strong> the burst was limited. These holes penetrated the mine workings<br />
between the evening <strong>of</strong> August 9 <strong>and</strong> August 15. Each one provided an initial indication that a<br />
substantial height <strong>of</strong> entry was open at mine level. Estimated opening heights ranged between<br />
5.5 <strong>and</strong> 8 feet. At that time, clean-up in the No. 1 entry progressed under the assumption that<br />
total blockage <strong>of</strong> entries would be limited to the highest overburden between crosscuts 126 to<br />
132 <strong>and</strong> the effects <strong>of</strong> the burst inby crosscut 137 may not have been as severe. Holes completed<br />
after August 16 indicate that this assumption was overly optimistic. Subsequent analyses <strong>of</strong><br />
satellite images <strong>and</strong> information gained from later surface boreholes revealed that the degree <strong>of</strong><br />
damage encountered in the No. 1 entry would have worsened substantially between Crosscut 132<br />
<strong>and</strong> the last known location <strong>of</strong> the miners.<br />
Work Procedures under Operator’s Recovery Plan<br />
The rescue effort was a dynamic process. The work procedures <strong>and</strong> corresponding plan<br />
approvals underwent numerous changes to minimize exposure to miners, improve efficiency, <strong>and</strong><br />
improve the effectiveness <strong>of</strong> the support system. The number <strong>of</strong> miners working in the clean-up<br />
area was reduced. Work processes were adjusted <strong>and</strong> refined to efficiently excavate material <strong>and</strong><br />
install the required ground support. Supports for burst control were reinforced through the<br />
installation <strong>of</strong> additional <strong>of</strong> steel cables <strong>and</strong> ro<strong>of</strong> control was maintained by installing additional<br />
ro<strong>of</strong> bolts, ro<strong>of</strong> mesh, <strong>and</strong> steel channel where required.<br />
Timely access to the entrapped miners in the South Barrier section work area required the<br />
rehabilitation <strong>of</strong> debris filled, previously mined entries <strong>of</strong> the South Barrier section or Main<br />
West. There were no alternative routes. To reach the entrapped miners required removing coal<br />
debris from entries within damaged pillars. This unavoidable process required removal <strong>of</strong><br />
compacted coal that reduced the confinement around damaged pillars. Consequently, this led to<br />
working in the vicinity <strong>of</strong> ground with high burst potential.<br />
The most rapid method <strong>of</strong> advance in the No.1 entry required the implementation <strong>of</strong> typical coal<br />
mining methods using the most available coal mining equipment. No other means <strong>of</strong> excavation<br />
was available to quickly reach the miners. Remote means <strong>of</strong> excavating the debris filled entry<br />
158
was available through the use <strong>of</strong> the remote control continuous mining machine. However,<br />
during the rescue work in the No. 1 entry, the RocProps <strong>and</strong> associated chain-link fence <strong>and</strong> steel<br />
cables, which were advanced behind the continuous mining machine, had to be installed<br />
manually. This process required working <strong>and</strong> traveling in close proximity to ground with high<br />
burst potential. No methods were available to remotely install the ground control system.<br />
Pillar Burst Support System<br />
After the August 7, 2007, burst in the No. 4 entry, support systems were used to protect rescue<br />
workers from additional pillar bursts. St<strong>and</strong>ing supports installed on either side <strong>of</strong> the No. 1<br />
entry were an integral part <strong>of</strong> these systems. They were placed outby for a distance <strong>of</strong> several<br />
hundred feet before recovery work began in the No. 1 entry <strong>and</strong> then installed behind the cleanup<br />
face as it advanced.<br />
All forms <strong>of</strong> st<strong>and</strong>ing support used in the U.S. coal mining industry primarily are designed to<br />
support the mine ro<strong>of</strong>. The stated capacity <strong>of</strong> these supports refers to their ability to sustain<br />
vertical ro<strong>of</strong> loads rather than lateral loads. The lateral load-carrying capability <strong>of</strong> the installed<br />
supports was unknown as was the force that the supports would be required to resist. It was<br />
known, however, that the RocProps could be installed with a substantial preload, the mine<br />
workers were familiar with their installation, <strong>and</strong> they had been used successfully for protection<br />
from burst hazards at another mine. Other support systems including arches <strong>and</strong> steel sets were<br />
considered. However, at the time RocProps were chosen to be used in the rescue, planners were<br />
unaware <strong>of</strong> any preferable alternative to RocProps in terms <strong>of</strong> versatility, availability, worker<br />
familiarity, <strong>and</strong> installation exposure. No other support system capable <strong>of</strong> withst<strong>and</strong>ing<br />
significantly greater lateral loading was available. A NIOSH ground support specialist familiar<br />
with the testing <strong>and</strong> evaluation <strong>of</strong> underground mining support systems was consulted regarding<br />
support systems that could be used in this application. RocProps were also suggested<br />
independently by the NIOSH specialist.<br />
The mine operator submitted <strong>and</strong> <strong>MSHA</strong> approved a plan to install a support system that<br />
included st<strong>and</strong>ing supports. Initially, posts (6 x 8-inch hardwood) were used in conjunction with<br />
Jackpots, hydraulic preloading devices, to wedge them between the ro<strong>of</strong> <strong>and</strong> floor. Once inflated<br />
with high-pressure water through a non-return valve, the Jackpots provided a preload that<br />
improved the wood posts ability to close cracks in the ro<strong>of</strong> <strong>and</strong> secure any loose rock, reduce the<br />
likelihood <strong>of</strong> ground falls, <strong>and</strong> provide resistance to lateral loading. Wood posts were only used<br />
for a distance <strong>of</strong> about 200 feet, when another form <strong>of</strong> hydraulically wedged st<strong>and</strong>ing support,<br />
RocProps, was employed.<br />
A RocProp is a hydraulic cylinder that also provides an active preload when it is inflated using<br />
high pressure water. During the rescue effort, a hose was connected from a high pressure pump<br />
to the injection nozzle at the base <strong>of</strong> the RocProp. A control valve was opened allowing water<br />
into the cylinder. The water pressure telescoped the inner tube until the RocProp was against the<br />
mine ro<strong>of</strong> <strong>and</strong> self-supporting. From a safe position, the RocProp was further pressurized until a<br />
setting pressure <strong>of</strong> between 1,100 <strong>and</strong> 1,200 psi was achieved. The control valve was closed to<br />
maintain the required setting pressure <strong>and</strong> a cone shaped locking ring was hammered into place<br />
with a cone-setting tool. The setting tool was positioned around the RocProp <strong>and</strong> the cone was<br />
driven into the flare <strong>of</strong> the outer tube to complete installation. The pump was powered by<br />
tapping into the hydraulic system <strong>of</strong> the continuous mining machine, shuttle car, ro<strong>of</strong>-bolting<br />
machine, or Ramcar by using quick connect/disconnect couplings.<br />
159
During most <strong>of</strong> the rescue work in the No. 1 entry, RocProps were a primary component <strong>of</strong> the<br />
support system. They were installed on 2.5-foot centers, typically one at a time, one side <strong>of</strong> the<br />
entry <strong>and</strong> then the other, until all <strong>of</strong> the required ro<strong>of</strong>-to-floor supports were set. The spacing<br />
between supports on opposite sides <strong>of</strong> the entry was established at 14 feet. This dimension was<br />
considered the minimum that would allow equipment to tram to <strong>and</strong> from the clean-up face.<br />
This limited entry width was maintained in an effort to minimize the disturbance to the burst<br />
pillars on either side. Opening height varied in the recovered entry. However, RocProps were<br />
available to accommodate various mining heights.<br />
After a series <strong>of</strong> RocProps was installed, chain-link fencing was installed on the rib side <strong>of</strong> the<br />
RocProps to contain sloughed or burst coal. Periodically, 5/8-inch diameter steel cables were<br />
installed on the travelway side <strong>of</strong> the RocProps to contain the RocProps <strong>and</strong> fencing in the event<br />
<strong>of</strong> a larger burst event. Three cables were installed on the travelway side <strong>of</strong> the RocProps at the<br />
top, middle, <strong>and</strong> bottom. Each cable connection or loop was secured with three cable clamps.<br />
The cable was wrapped around one RocProp every 40 feet <strong>and</strong> connected to itself. Each cable<br />
was anchored to a separate RocProp (Figure 88). The RocProps <strong>and</strong> associated chain-link fence<br />
<strong>and</strong> steel cables were advanced behind the continuous mining machine.<br />
Figure 88 – Steel Cables Connected to RocProps<br />
When damaged ro<strong>of</strong> bolts were encountered or the ro<strong>of</strong> showed signs <strong>of</strong> fractured conditions,<br />
additional ro<strong>of</strong> bolts, wire ro<strong>of</strong> mesh, <strong>and</strong>/or steel channels were installed. Occasionally,<br />
channels spanned the entry <strong>and</strong> were supported on either end using RocProps or wood posts.<br />
They also were installed using fully grouted ro<strong>of</strong> bolts. A twin-boom walk-thru ro<strong>of</strong>-bolting<br />
machine was utilized to install the ro<strong>of</strong> bolts, mesh, or channels if it was necessary (Figure 89).<br />
160
Figure 89 - New Ro<strong>of</strong> Bolts <strong>and</strong> New Wire Mesh Installed in the No. 1 Entry<br />
As clean-up advanced in the No. 1 entry, a number <strong>of</strong> changes were implemented to enhance the<br />
support system <strong>and</strong>/or to reduce worker exposure. For example, a 4 x 8-foot sheet <strong>of</strong> ½-inch<br />
thick Lexan 18 was provided near the face to <strong>of</strong>fer protection to rescue workers in the clean-up<br />
area. The sheet was secured to the mine ro<strong>of</strong> by chains attached along one edge. The chain was<br />
connected to ro<strong>of</strong> bolt plates (Figure 90). The Lexan sheet served as a shield between personnel<br />
<strong>and</strong> the coal pillar rib.<br />
Figure 90 - Sheet <strong>of</strong> Lexan Suspended from <strong>Mine</strong> Ro<strong>of</strong><br />
161
Seismic Activity Recorded by UUSS during Rescue Efforts<br />
After the August 6 accident, seismic activity continued regularly for approximately 37 hours (see<br />
Figure 32). During this period, miners reported a substantial amount <strong>of</strong> rock noise emanating<br />
from the area north <strong>and</strong> west <strong>of</strong> the accessible portion <strong>of</strong> the South Barrier workings. One <strong>of</strong><br />
these events recorded by UUSS was related to the August 7 coal burst that ended the rescue<br />
operation in the No. 4 entry. No further seismic events were recorded until August 13, 2007,<br />
when seismic activity was recorded at the inby edge <strong>of</strong> the collapse area (over 2,000 feet west <strong>of</strong><br />
the clean-up area). In a presentation before the Utah <strong>Mine</strong> <strong>Safety</strong> Commission on November 11,<br />
2007, Dr. Walter Arabasz noted a “5.8 day gap between August 7 <strong>and</strong> 13 for events above the<br />
threshold for complete detection <strong>of</strong> magnitude (MC) 1.6.” A general reduction in activity was<br />
observed underground during this time period as well.<br />
On August 15, 2007, at 2:26 a.m., a seismic event occurred that was related to a burst in the<br />
clean-up area, inby crosscut 125 in the No. 1 entry. Another seismic event was recorded at<br />
10:04 a.m. on August 16, which was related to a burst in the clean-up area, inby crosscut 126 in<br />
the No. 1 entry. The next recorded seismic event was related to the August 16 accident at<br />
6:38 p.m.<br />
Bounces <strong>and</strong> bursts were observed underground throughout the rescue effort. Most <strong>of</strong> these<br />
occurrences were not in the seismologic record due to the reporting threshold <strong>of</strong> the network.<br />
The UUSS seismic network was set to record only events larger than approximately magnitude<br />
1.6. After additional seismic stations were installed between August 9 <strong>and</strong> 11, 2007, the<br />
threshold was reduced to approximately magnitude 1.2. Some smaller events were recorded<br />
concurrently with a larger event that had triggered the system.<br />
Initial locations <strong>of</strong> seismic events lacked sufficient accuracy to be used for decisions affecting<br />
rescue efforts. Figure 91 shows the initial locations generated by the UUSS automated system.<br />
The red circle depicts the August 6 accident. The blue circle depicts the August 16 accident.<br />
The remaining magenta circles depict those events recorded between these accidents. All events<br />
plot in regions away from the underground rescue work. The more accurate locations <strong>of</strong> events<br />
shown in Figure 92 were not available until well after the rescue efforts had been suspended.<br />
Underground observations were much more representative <strong>of</strong> actual ground activity.<br />
162
Figure 91 - Initial Location <strong>of</strong> Seismic Events August 6-16, 2007<br />
Figure 92 - Double Difference Locations <strong>of</strong> Seismic Events, August 6-16, 2007<br />
(unavailable until November 2007)<br />
163
Pillar Bounce <strong>and</strong> Burst Activity during Rescue in No. 1 Entry<br />
The comm<strong>and</strong> center log book noted bounces <strong>and</strong> bursts from August 6 through August 16.<br />
Protocol to qualify an event’s significance for reporting purposes, which could range from a<br />
noise generated by a mild bounce to a coal burst, was not clearly established. Rescue workers<br />
called <strong>and</strong> reported such events to the comm<strong>and</strong> center based on varying individual perceptions<br />
<strong>of</strong> the event’s significance. <strong>Report</strong>ing was also dependent on whether or not the individual was<br />
in the vicinity <strong>of</strong> the event. With these constraints, the recorded bounce <strong>and</strong> burst activity can<br />
only be discussed in general terms.<br />
Forty-one events were reported by underground personnel during rescue work in the No. 1 entry<br />
prior to the August 16 accident. All bounce activity, which included bursts, originated from the<br />
section pillars to the north <strong>of</strong> the No. 1 entry. None was associated with the barrier to the south.<br />
The majority <strong>of</strong> these bounces or bursts were outby crosscut 120 (see Figure 93). This area was<br />
outby the crosscut leading to the feeder, away from the clean-up operation in the No. 1 entry (see<br />
Figure 3). The rescue work area was protected with RocProps or wood posts with Jackpots. Rib<br />
deterioration <strong>and</strong> bursts that occurred outby the clean-up area were contained by the support<br />
system.<br />
Figure 93 – Bounce or Burst Activity Recorded in Comm<strong>and</strong> Center Log Book<br />
August 8 to August 16, Prior to August 16 Accident<br />
Prior to the August 16 accident, eleven burst/bounce events were reported to have originated<br />
from the north side (right side) section pillars inby crosscut 120 (see Figure 93). These events<br />
occurred at the remote-controlled continuous mining machine where the material was being<br />
loaded, inby the area <strong>of</strong> the advancing RocProp system. The approved clean-up plan included<br />
procedures that minimized exposure <strong>of</strong> rescue workers in this area. It was thought that if a<br />
significant pillar burst were to occur, it most likely would be in the area where material was<br />
being removed. The comm<strong>and</strong> center log book noted that events in the clean-up area varied in<br />
size with two large pillar bursts in this area recorded prior to the August 16 accident. Prior to<br />
August 16, no significant bounces or bursts were recorded within the RocProp support system<br />
inby crosscut 120. One burst event was noted outby crosscut 120. Material piled behind the<br />
chain-link fencing inby crosscut 120 resulted from unreported bounces or bursts, or from rib<br />
sloughage.<br />
164
The rescue advance in the No. 1 entry achieved a somewhat steady rate <strong>of</strong> approximately ½<br />
crosscut (65 feet) per day after August 12 as illustrated in Figure 94. No correlation to rescue<br />
advance rate in the No. 1 entry <strong>and</strong> the burst or bounce frequency could be identified.<br />
Figure 94 - No. 1 Entry Rescue Clean-up Progress Plotted by Day<br />
On the evening <strong>of</strong> August 16, a large burst originated from the north side <strong>of</strong> the No. 1 entry. The<br />
burst dislodged the installed RocProps, steel cables, <strong>and</strong> chain-link fencing, violently throwing<br />
the debris <strong>and</strong> the support system from one side <strong>of</strong> the entry to the other. It happened at a time in<br />
the rescue work cycle where the maximum number <strong>of</strong> personnel was in the area. This accident<br />
resulted in six injuries <strong>and</strong> three fatalities.<br />
The August 16 accident confirmed that potential energy remained in the damaged pillars. The<br />
level <strong>of</strong> ground activity in the No. 1 entry from August 8 to 15 did not provide a clear indicator<br />
<strong>of</strong> pillar stability. The lack <strong>of</strong> ground activity could have indicated either that the pillars were<br />
stable or that hazardous unreleased energy remained in the pillar. Likewise, substantial activity<br />
could have indicated that the pillars are remaining stable as they release energy, or that a<br />
hazardous event is pending. Therefore, analysis <strong>of</strong> underground observations <strong>and</strong> frequency <strong>of</strong><br />
bounce or burst activity (Figure 93) <strong>of</strong>fered little useful guidance on potential for bounces <strong>and</strong><br />
bursts. Because <strong>of</strong> the magnitude <strong>of</strong> the pillar burst <strong>and</strong> the failure <strong>of</strong> the ro<strong>of</strong>-to-floor support<br />
system, all underground rescue activity was suspended. The 103(k) order was modified<br />
requiring all personnel to remain outby crosscut 107 in Main West.<br />
Ground Condition Monitoring<br />
During the rescue operation, underground observations <strong>and</strong> convergence measurements were<br />
used to assess the stability <strong>of</strong> the areas that rescuers worked in or traveled through in the South<br />
Barrier section. These monitoring activities identified areas requiring supplemental support but<br />
failed to anticipate the burst that occurred on August 16. Measurements <strong>and</strong> visual observations<br />
did not indicate that failure was imminent <strong>and</strong> the rescue activity should be suspended.<br />
The burst that occurred on August 7 during the initial clean-up effort in No. 4 entry had<br />
demonstrated that additional local bursting could occur as a travelway was reestablished. The<br />
event illustrated that, despite their fragmented appearance, pillars within the burst area still were<br />
capable <strong>of</strong> violent failure sufficient to cause injury. Although specific conditions that might be<br />
165
indicative <strong>of</strong> an impending burst were not known, <strong>MSHA</strong> <strong>and</strong> GRI personnel remained alert to<br />
any changes in the work environment as the clean-up progressed. <strong>MSHA</strong> positioned an<br />
inspector at the clean-up face at all times to visually monitor conditions <strong>and</strong> observe work<br />
practices. Usually these <strong>MSHA</strong> personnel were from the Price, Utah, Field Office since these<br />
inspectors had knowledge <strong>of</strong> the mine, regional mining conditions <strong>and</strong> practices, <strong>and</strong> burst<br />
hazards in general. An <strong>MSHA</strong> inspector also was stationed each shift at the FAB phone at<br />
crosscut 119 <strong>and</strong> another took air measurements at various locations throughout each shift.<br />
As the clean-up effort advanced between August 8 <strong>and</strong> 11, the amount <strong>of</strong> debris encountered in<br />
the No. 1 entry increased substantially. In some areas, ro<strong>of</strong> bolts had been sheared <strong>and</strong>/or<br />
damaged <strong>and</strong> hazardous ro<strong>of</strong> conditions were encountered. The bolt damage in some instances<br />
was associated directly with movement <strong>of</strong> the barrier-side rib. This rib line was observed to have<br />
moved horizontally up to 10 feet into the entry. The displaced coal was much different in<br />
appearance than ribs encountered to that point. Whereas most burst ribs had a loose, fragmented<br />
appearance, the barrier-side rib appeared to be more intact <strong>and</strong> remained nearly vertical as cleanup<br />
progressed. Initially, the competent appearance <strong>of</strong> the coal raised concerns that it might be<br />
more capable <strong>of</strong> storing strain energy that could be released as a burst event. However, as cleanup<br />
continued, bursts were observed to originate from the pillar-side rather than the barrier-side.<br />
On August 11, GRI <strong>and</strong> <strong>MSHA</strong> mapped pillar damage east <strong>of</strong> the Main West seals (see Figure<br />
26). The damaged pillar ribs were sloughed due to abutment stress from failed pillars to the<br />
west. Earlier, a substantial amount <strong>of</strong> rock noise had been noted in this area, but on August 11, it<br />
was relatively quiet. Thus, it was determined that the ground stress had stabilized <strong>and</strong> that pillar<br />
failure was no longer progressing eastward. Ro<strong>of</strong> deterioration <strong>and</strong> slight widening <strong>of</strong> ro<strong>of</strong> joints<br />
was observed in the No. 1 entry outby crosscut 117. Ro<strong>of</strong>-to-floor supports were installed<br />
through this area <strong>and</strong> steel channels were installed where adverse ro<strong>of</strong> conditions were present.<br />
On August 12, observations <strong>of</strong> RocProps tilted from vertical had prompted the <strong>MSHA</strong> inspector<br />
positioned at the clean-up face to install a measurement point to monitor RocProp horizontal<br />
movement. The measurement was taken routinely between RocProps installed on opposite sides<br />
<strong>of</strong> the No. 1 entry between crosscuts 123 <strong>and</strong> 124. Between August 12 <strong>and</strong> 13, the horizontal<br />
distance between the RocProps decreased by ½ inch across the ~13 ½-foot opening. From<br />
August 13 to the last measurement on August 15, no further movement was noted,<br />
Between August 12 <strong>and</strong> 15, clean-up progressed steadily but there was an increasing number <strong>of</strong><br />
reports <strong>of</strong> rock noise emanating from locations outby crosscut 119 <strong>and</strong> ro<strong>of</strong> cracks were observed<br />
between crosscuts 115 <strong>and</strong> 119. These observations raised concerns that a ro<strong>of</strong> fall could occur<br />
outby the rescue workers <strong>and</strong> that additional pillar failure could be responsible for the changing<br />
conditions. <strong>MSHA</strong> installed 10 ro<strong>of</strong>-to-floor convergence stations (at crosscuts 111, 113, 115,<br />
117, <strong>and</strong> 119 in the No. 2 <strong>and</strong> No. 4 entries) to assess ground behavior.<br />
Each convergence station was established between two points on the mine ro<strong>of</strong> <strong>and</strong> floor. Ro<strong>of</strong><br />
bolt heads were identified at specific locations to serve as measurement points on the ro<strong>of</strong>.<br />
Directly beneath each ro<strong>of</strong> bolt, a ⅜-inch diameter hole was drilled to accept a plastic anchor <strong>and</strong><br />
a ¼-inch diameter screw that served as the measurement point on the floor. Spray paint <strong>and</strong><br />
survey ribbon were used to identify the monitored locations. Convergence measurements were<br />
taken using a telescoping rod, shown in the photograph on the left side <strong>of</strong> Figure 95. This<br />
instrument, manufactured by Sokkia, can extend up to 26 feet <strong>and</strong> is capable <strong>of</strong> determining the<br />
distance between ro<strong>of</strong> <strong>and</strong> floor points to within one millimeter.<br />
166
Figure 95 - Convergence Measurements<br />
Left: Ro<strong>of</strong>-to-floor convergence station. Right: RocProp convergence station.<br />
The convergence stations were monitored to determine the magnitude, rate, <strong>and</strong> distribution <strong>of</strong><br />
ro<strong>of</strong>-to-floor closure. Historically, measurements <strong>of</strong> this type have been useful in monitoring<br />
changing <strong>and</strong> potentially hazardous ground conditions. Initial (baseline) measurements were<br />
taken on August 15 <strong>and</strong> the stations were measured twice on August 16 prior to the accident.<br />
Measurements in this time frame indicated that ground conditions were stable; three <strong>of</strong> ten<br />
stations showed closures <strong>of</strong> 0.04 inches but this amount <strong>of</strong> displacement is within the precision<br />
<strong>of</strong> the measuring instrument.<br />
Sixteen monitoring locations were established using RocProps in the No. 1 entry. As shown in<br />
the photograph on the right side <strong>of</strong> Figure 95, these monitoring locations were established by<br />
painting a line on installed RocProps, 12 inches above the locking ring. Entry convergence<br />
could be monitored at these locations simply by measuring the distance between the lock ring<br />
<strong>and</strong> paint line using a tape measure. Although not as exact as a convergence rod, these<br />
measurements were intended to provide a convenient method for determining convergence<br />
between the mine ro<strong>of</strong> <strong>and</strong> floor that anyone with a tape measure could perform.<br />
The RocProps designated for measurement stations extended from crosscut 116 to 126 in the<br />
travelway to the clean-up area. No convergence stations had been established inby crosscut 126,<br />
near the August 16 accident site, because the area had just recently been cleaned <strong>and</strong> supported<br />
before the accident. The RocProp stations were measured twice on August 16, prior to the<br />
accident, <strong>and</strong> indicated stable conditions. No closure was noted at 14 <strong>of</strong> the 16 measurement<br />
points. One RocProp near crosscut 126 showed 1/16-inch <strong>of</strong> closure <strong>and</strong> another near crosscut<br />
121 showed 3/16-inch. Subsequent measurements by the accident investigation team on<br />
September 10 indicated that additional vertical closure had occurred in eight RocProps. Seven <strong>of</strong><br />
the eight moved 1/8 inch or less while closure on the RocProp at crosscut 123 measured ½ inch.<br />
Two RocProps located farther inby at crosscuts 124 <strong>and</strong> 125 showed no additional closure.<br />
Ventilation on August 16<br />
During the rescue operation on August 16 the clean-up area was ventilated with line curtain.<br />
Oxygen deficiency, as low as 14%, was detected inby the continuous mining machine earlier that<br />
167
day. When the accident occurred, the line curtain was damaged <strong>and</strong> buried in coal. Multi-gas<br />
detectors carried by victims <strong>and</strong> the rescuers began to alarm. The lowest oxygen concentration<br />
was generally observed on the north side <strong>of</strong> the entry, away from the victims. Repairs to the line<br />
curtain began as rescuers continued removing debris to free the injured miners. Ventilation was<br />
reestablished in a short time.<br />
An oxygen deficient atmosphere was present in the rubble in advance <strong>of</strong> the continuous mining<br />
machine. The ventilation system had diluted <strong>and</strong> carried away gasses that had migrated into the<br />
workplace. The accident damaged the ventilation system <strong>and</strong> may have pushed additional<br />
oxygen deficient air onto the accident site. During the exploration on the morning <strong>of</strong> August 6,<br />
16% oxygen was detected in the area explored near crosscut 126. The lowest oxygen<br />
concentration reported after the accident on August 16 was 14.7%. The presence <strong>of</strong> oxygen<br />
deficient air <strong>and</strong> the need to reestablish ventilation diverted resources from the rescue effort for a<br />
short time, however, no ill effects were reported from the oxygen deficient air.<br />
Post-Accident Tracking<br />
The mine tracking system was changed on August 11, 2007. The new system eliminated the use<br />
<strong>of</strong> the magnetic tracking board <strong>and</strong> was replaced with a computer spreadsheet. This system<br />
functioned identically to the magnetic board with the exception that it provided a printed copy <strong>of</strong><br />
each person’s underground location every hour. In addition, the check-in, check-out procedure<br />
was supplemented by having each person write their name, date, <strong>and</strong> time they entered <strong>and</strong><br />
exited the mine in a log located at the portal.<br />
On August 16, 2007, the post-accident tracking system was not maintained so that it could be<br />
used to determine the pre-accident location <strong>of</strong> all underground personnel <strong>and</strong> was not reliable<br />
during the post-accident setting. On the morning <strong>of</strong> August 16, audio recordings <strong>of</strong> the pager<br />
phone system verified that Dale Black’s location was reported to the AMS operator as he<br />
traveled between zones toward the clean-up area. However, Black was not entered into the<br />
tracking system during this shift. All other miners in the clean-up area were properly tracked.<br />
Immediately following the August 16 accident, the mine pager phone system was needed to<br />
coordinate rescue efforts from the comm<strong>and</strong> center. <strong>Mine</strong>rs attempting to call out as they<br />
changed zones interfered with communications between the comm<strong>and</strong> center <strong>and</strong> rescue workers<br />
at the accident site. This prompted mine management to temporarily limit use <strong>of</strong> the phone<br />
system. Vehicles transporting injured miners, including cases where CPR were being performed,<br />
did not stop to call out zone locations as this would have delayed potentially life-saving<br />
treatment. Additionally, some rescue workers rapidly responded to the accident scene without<br />
reporting their movements. This caused an increase in time <strong>and</strong> confusion when accounting for<br />
all persons after the mine had been evacuated. However, the tracking system failures did not<br />
cause any delays in medical treatment to the injured miners.<br />
Local Coordination<br />
Following the August 16 accident, the response was rapid. Immediately after the accident<br />
occurred, a call went out to 911 emergency medical services. Several ambulance services in the<br />
area responded, including medical evacuation helicopters. Medical personnel were stationed at<br />
the mine portal <strong>and</strong> began medical treatment as the injured exited the mine. At least one<br />
Emergency Medical Technician traveled underground to provide onsite first aid. There were no<br />
delays in treatment or transportation <strong>of</strong> the injured rescue workers.<br />
168
ROOT CAUSE ANALYSIS<br />
An analysis was conducted to identify the most basic causes <strong>of</strong> the accidents that were<br />
correctable through management controls. Listed below are root causes identified for each<br />
accident <strong>and</strong> their corresponding corrective actions to prevent a recurrence <strong>of</strong> the accident.<br />
Root Causes <strong>of</strong> August 6, 2007, Accident<br />
1. Root Cause: GRI <strong>and</strong> AAI’s mine design was not compatible with effective control <strong>of</strong><br />
coal bursts. The dimensions <strong>of</strong> pillars within the active workings, as well as dimensions <strong>of</strong><br />
the adjoining barrier pillars, did not provide sufficient strength to withst<strong>and</strong> stresses. AAI’s<br />
ARMPS analysis <strong>of</strong> the pillar dimensions was inappropriately applied <strong>and</strong> their LaModel<br />
analysis was faulty. These analyses were not adequately reviewed for correctness <strong>and</strong><br />
results were not accurately reported.<br />
Corrective Action: Engineering procedures should ensure analyses are conducted in<br />
accordance with established guidelines. Correspondence, input files, <strong>and</strong> output files should<br />
be adequately reviewed for accuracy at each stage <strong>of</strong> model analysis. Systematic<br />
verification <strong>of</strong> numerical model construction, parameter selection, <strong>and</strong> model calibration<br />
should be conducted to ensure that output represents known conditions. <strong>Report</strong>s should<br />
accurately convey analyses results, provide clear recommendations, <strong>and</strong> include<br />
justifications for any departure from established guidelines. Pillars <strong>and</strong> mining methods<br />
should be designed to maintain ventilation systems, including separation from adjacent<br />
sealed areas.<br />
2. Root Cause: GRI did not take adequate steps to prevent recurrences <strong>of</strong> coal outburst<br />
accidents. Revisions <strong>of</strong> the ro<strong>of</strong> control plan were not proposed by the operator when<br />
conditions at the mine indicated that the plan was not adequate or suitable for controlling<br />
the ro<strong>of</strong>, face, ribs or coal bursts. These conditions included ro<strong>of</strong> <strong>and</strong> rib burst damage,<br />
miners being struck by coal, <strong>and</strong> several coal outburst accidents that were not reported to<br />
<strong>MSHA</strong> as required by 30 CFR 50.10.<br />
Corrective Action: All coal outburst accidents must be properly reported to <strong>MSHA</strong> <strong>and</strong><br />
mapped to accurately portray accident history for determining adequacy <strong>of</strong> the approved<br />
ro<strong>of</strong> control plan. Adequate steps to prevent the recurrence <strong>of</strong> all coal outburst accidents<br />
should be taken before mining is resumed. Revisions to the ro<strong>of</strong> control plan must be<br />
proposed when the plan is not suitable for controlling coal bursts.<br />
3. Root Cause: GRI did not follow their approved ro<strong>of</strong> control plan <strong>and</strong> pillar design<br />
parameters. The barrier south <strong>of</strong> the No. 1 entry was mined between crosscut 142 <strong>and</strong><br />
crosscut 139 where pillar recovery was not permitted by the approved ro<strong>of</strong> control plan.<br />
Pillars were mined to a greater height by mining <strong>of</strong> bottom coal <strong>and</strong> entries were centered<br />
differently than modeled.<br />
Corrective Action: <strong>Mine</strong> operators must follow their approved ro<strong>of</strong> control plan. Persons<br />
analyzing mine designs should be provided with all pertinent aspects <strong>of</strong> intended mining,<br />
<strong>and</strong> any revisions to such information. <strong>Mine</strong> operators should consult with analysts before<br />
implementing any changes to modeled mining plans.<br />
169
4. Root Cause: GRI included incorrect information in the ro<strong>of</strong> control plan submitted to<br />
<strong>MSHA</strong> for approval. GRI submitted ro<strong>of</strong> control plans based on AAI’s inaccurate<br />
evaluations, which determined that projected mining would be safe <strong>and</strong> pillar <strong>and</strong> barrier<br />
dimensions were appropriate when in fact they were not.<br />
Corrective Action: <strong>Mine</strong> operators should ensure that proposed ro<strong>of</strong> control plans are<br />
suitable for prevailing geological conditions <strong>and</strong> the mining system to be used at the mine.<br />
Corrective actions regarding <strong>MSHA</strong>’s ro<strong>of</strong> control plan approval process will be addressed<br />
in the findings <strong>of</strong> an independent review team.<br />
Root Causes <strong>of</strong> August 16, 2007, Accident<br />
All root causes for the August 6 accident can also be attributed to the August 16 accident; the<br />
following are additional root causes unique to the latter. Unlike the August 6 accident, viable<br />
alternatives were not available for most causes <strong>of</strong> the August 16 accident, which imposed<br />
greater risks on rescue workers than would be accepted for normal mining. The prospect <strong>of</strong><br />
saving the entrapped miners’ lives warranted the heroic efforts <strong>of</strong> the rescue workers. The<br />
greater risks imposed on the rescue workers underscore the high degree <strong>of</strong> care that must be<br />
taken by mine operators to prevent catastrophic pillar failures as occurred on August 6.<br />
1. Root Cause: Information was not sufficient to determine underground conditions<br />
prior to August 16.<br />
Corrective Action: Due to the high level <strong>of</strong> risk inherent to rescue efforts, all resources,<br />
including drilling resources, should be deployed to obtain information necessary to<br />
determine underground conditions in the shortest possible timeframe. Information is<br />
critical to evaluate the potential success <strong>of</strong> rescue efforts.<br />
2. Root Cause: The method used for reaching the entrapped miners required removal<br />
<strong>of</strong> compacted coal debris, which reduced confinement pressure on the failed pillars.<br />
Corrective Action: None. No viable excavation method exists to rescue the entrapped<br />
miners.<br />
3. Root Cause: Ground support systems were not capable <strong>of</strong> controlling maximum<br />
potential coal burst intensity.<br />
Corrective Action: None. Viable support systems capable <strong>of</strong> sustaining significantly<br />
greater lateral loads are not available. Methods do not exist to determine the maximum<br />
coal burst intensity that the ground support system would be subjected to.<br />
4. Root Cause: Installation <strong>of</strong> ground control systems required rescue workers to<br />
travel near areas with high burst potential.<br />
Corrective Action: None. No means exists to remotely install the ground control<br />
systems.<br />
170
CONCLUSION<br />
The catastrophic coal outburst accident on August 6, 2007, initiated near the pillar line in the<br />
South Barrier section <strong>and</strong> propagated outby, resulting in a magnitude 3.9 mining related<br />
seismic event. Within seconds, pillars failed over a distance <strong>of</strong> approximately ½-mile,<br />
expelling coal into the mine openings. The six miners working on the section likely received<br />
fatal injuries from the ejected coal as it violently filled the entries. The barrier pillars to the<br />
north <strong>and</strong> south <strong>of</strong> the South Barrier section entries also failed, inundating the section with<br />
lethally oxygen-deficient air from the adjacent sealed area(s) <strong>and</strong> may have contributed to the<br />
death <strong>of</strong> the miners. The extensive pillar failure <strong>and</strong> subsequent inundation <strong>of</strong> the section by<br />
oxygen-deficient air occurred because <strong>of</strong> inadequacies in the mine design, faulty pillar<br />
recovery methods, <strong>and</strong> failure to adequately revise mining plans following coal burst<br />
accidents. The mine design was inadequate because it incorporated recommendations from<br />
AAI’s flawed LaModel <strong>and</strong> ARMPS analyses. These design issues <strong>and</strong> faulty pillar recovery<br />
methods resulted in pillar dimensions that were not compatible with effective ground control<br />
to prevent coal bursts under the deep overburden <strong>and</strong> high abutment loading that existed in the<br />
South Barrier section.<br />
AAI’s ARMPS analysis was inappropriately applied. They used an area for back-analysis<br />
that experienced poor ground conditions <strong>and</strong> did not consider the barrier pillar stability factors<br />
in any <strong>of</strong> their analyses. The mine-specific ARMPS design threshold proved to be invalid, as<br />
evidenced by the March 7 <strong>and</strong> 10, 2007, coal outburst accidents <strong>and</strong> other pillar failures. GRI<br />
did not propose revisions to their ro<strong>of</strong> control plan before resuming mining following the<br />
March 7 coal outburst. Despite these accidents, AAI recommended a pillar design for the<br />
South Barrier section that had a lower calculated pillar stability factor than the failed pillars in<br />
the North Barrier section, lower than recommended by NIOSH criteria, <strong>and</strong> lower than<br />
established by their mine specific criteria. AAI performed the ARMPS analysis for the South<br />
Barrier section, but did not include these results in their reports that were presented to <strong>MSHA</strong><br />
in support <strong>of</strong> GRI’s plan submittal.<br />
AAI’s LaModel analysis was flawed. They used an area for back-analysis that was<br />
inaccessible <strong>and</strong> could not be verified for known ground conditions, which resulted in an<br />
unreliable calibration <strong>and</strong> the selection <strong>of</strong> inappropriate model parameters. These model<br />
parameters overestimated pillar strength <strong>and</strong> underestimated load. AAI modeled pillars with<br />
cores that would never fail regardless <strong>of</strong> the applied load, which was not consistent with<br />
realistic mining conditions. They did not consider the indestructible nature <strong>of</strong> the modeled<br />
pillars in their interpretation <strong>of</strong> the results. Modeled abutment stresses from the adjacent<br />
longwall panels were underestimated <strong>and</strong> inconsistent with observed ground behavior <strong>and</strong><br />
previous studies at this <strong>and</strong> nearby mines. AAI managers did not review input <strong>and</strong> output<br />
files for accuracy <strong>and</strong> completeness. They also did not review vertical stress <strong>and</strong> total<br />
displacement output at full scale, which would have shown unrealistic results <strong>and</strong> indicated<br />
that corrections were needed to the model. Following the March 10 coal outburst accident,<br />
AAI modified the model, but failed to correct the significant model flaws. They did not make<br />
further corrections to the model when this analysis result still did not accurately depict known<br />
failures that AAI <strong>and</strong> GRI observed in the North Barrier section.<br />
171
The mine designs recommended by AAI <strong>and</strong> implemented in part by GRI did not provide<br />
adequate ground stability to maintain the ventilation system. The designs did not consider the<br />
effects <strong>of</strong> barrier pillar <strong>and</strong> remnant barrier pillar instability on separation <strong>of</strong> the working<br />
section from the adjacent sealed areas. Failure <strong>of</strong> the barrier pillars or remnant barrier pillars<br />
resulted in inundation <strong>of</strong> the section by lethally oxygen-deficient air. AAI <strong>and</strong> GRI also did<br />
not consider the effects <strong>of</strong> ground stability on ventilation controls in the bleeder system. GRI<br />
allowed frequent destruction <strong>of</strong> ventilation controls by ground movement <strong>and</strong> by air blasts<br />
from caving. GRI mined cuts from the barrier pillar in the South Barrier section between<br />
crosscuts 139 <strong>and</strong> 142 intended to be left unmined to protect the bleeder system.<br />
GRI employed a mine design that exposed miners to hazards related to coal bursts. The large<br />
area <strong>of</strong> similarly sized <strong>and</strong> marginally stable pillars developed in the Main West <strong>and</strong> North<br />
<strong>and</strong> South Barrier sections created a system primed for collapse. Pillar recovery in the South<br />
Barrier section most likely triggered the pillar collapse. GRI’s unapproved mining practices,<br />
including bottom mining <strong>and</strong> additional barrier slabbing between crosscuts 139 <strong>and</strong> 142,<br />
reduced the strength <strong>of</strong> the barrier <strong>and</strong> increased stress levels in the vicinity <strong>of</strong> the miners.<br />
GRI failed to have AAI evaluate the design that was actually employed in the South Barrier<br />
section. Proper evaluation <strong>of</strong> either design, as mined or as proposed, would have indicated<br />
failure.<br />
GRI continued pillar recovery without adequately revising their mining methods when<br />
conditions <strong>and</strong> accident history indicated that their ro<strong>of</strong> control plan was not suitable for<br />
controlling coal bursts. GRI investigations <strong>of</strong> non-injury coal burst accidents did not result in<br />
adequate changes <strong>of</strong> pillar recovery methods to prevent similar occurrences before continued<br />
mining. GRI did not consult with AAI or propose revisions to their ro<strong>of</strong> control plan<br />
following the August 3, 2007, coal outburst accident in the South Barrier section, even though<br />
pillar conditions were similar to the failed area in the North Barrier section.<br />
GRI did not immediately notify <strong>MSHA</strong> <strong>of</strong> previous coal outburst accidents. GRI’s failure<br />
denied <strong>MSHA</strong> the opportunity to investigate these accidents <strong>and</strong> ensure corrective actions<br />
were taken before mining resumed in the affected area. GRI did not submit written reports <strong>of</strong><br />
these accidents to <strong>MSHA</strong> or plot coal bursts on a mine map available for inspection by<br />
<strong>MSHA</strong> <strong>and</strong> miners. The lack <strong>of</strong> proper documentation <strong>and</strong> reporting <strong>of</strong> ground conditions <strong>and</strong><br />
related accidents denied <strong>MSHA</strong> required information for reviews to determine the suitability<br />
<strong>of</strong> the ro<strong>of</strong> control plan to prevailing geological conditions <strong>and</strong> mining systems used at the<br />
mine.<br />
The fatal August 16, 2007, coal pillar burst accident occurred when the pillar between the<br />
No. 1 <strong>and</strong> No. 2 entries failed adjacent to rescue workers as they completed installing ground<br />
support behind the continuous mining machine. Coal ejected from the pillar dislodged<br />
RocProps, steel cables, chain-link fence, <strong>and</strong> a steel ro<strong>of</strong> support channel, which struck the<br />
rescue workers <strong>and</strong> filled the entry with approximately four feet <strong>of</strong> debris. This accident<br />
resulted in the death <strong>of</strong> two mine employees <strong>and</strong> one <strong>MSHA</strong> inspector. Six additional rescue<br />
workers, including an <strong>MSHA</strong> inspector, received nonfatal injuries.<br />
The August 16 accident occurred because access to the entrapped miners required removal <strong>of</strong><br />
compacted coal debris from an entry affected by the August 6 accident. Entry clean-up<br />
172
educed confining pressure on the failed pillars <strong>and</strong> increased the potential for additional<br />
bursts. Methods for installing ground control systems required rescue workers to travel near<br />
areas with high burst potential. Methods were not available to determine the maximum coal<br />
burst intensity that the ground support system would be subjected to. On August 16, the coal<br />
burst intensity exceeded the capacity <strong>of</strong> the support system. No alternatives to these methods<br />
were available to rescue the entrapped miners, which imposed greater risks on rescue workers<br />
than would be accepted for normal mining. As a result, only suspension <strong>of</strong> underground<br />
rescue efforts could have prevented this accident. Prior to the August 16 accident, this was<br />
only likely to occur once definitive information was available to indicate that the entrapped<br />
miners could not have survived the accident. However, information provided by the drilling<br />
operations was not obtained in time to fully evaluate conditions on the section prior to this<br />
accident. The prospect <strong>of</strong> saving the entrapped miners’ lives warranted the heroic efforts <strong>of</strong><br />
the rescue workers. The greater risks imposed on the rescue workers underscore the high<br />
degree <strong>of</strong> care that must be taken by mine operators to prevent catastrophic pillar failures.<br />
173
ENFORCEMENT ACTIONS<br />
An order was issued to Genwal Resources Inc on the morning <strong>of</strong> the accident, pursuant to section<br />
103 (k) <strong>of</strong> the <strong>Mine</strong> Act. The order required the mine operator to obtain <strong>MSHA</strong> approval <strong>of</strong> any<br />
plan to rescue the entrapped miners, to recover the affected area <strong>of</strong> the mine to normal, <strong>and</strong> to<br />
assure the safety <strong>of</strong> all persons at this operation. The order was modified numerous times to<br />
allow the rescue <strong>and</strong> recovery operations to proceed. Additionally, nine enforcement actions<br />
were issued to the mine operator, Genwal Resources Inc, <strong>and</strong> one to the engineering contractor,<br />
Agapito Associates, Inc., for violations identified as contributing to the causes <strong>and</strong> effects or<br />
severity <strong>of</strong> the accident as follows:<br />
Genwal Resources Inc<br />
Type <strong>of</strong> Issuance: 104 (d) (2) Order St<strong>and</strong>ard Violated: 30 CFR 75.203 (a)<br />
Gravity: S&S, Fatal, Occurred<br />
Negligence: High<br />
Condition or Practice: During pillar development <strong>and</strong> recovery in the Main West Barrier<br />
sections, pillar dimensions were not compatible with effective control <strong>of</strong> coal or rock bursts.<br />
Pillar stability analysis confirms that the length <strong>and</strong> width <strong>of</strong> pillars within the active workings,<br />
as well as dimensions <strong>of</strong> the adjoining barrier pillars, did not provide sufficient strength to<br />
withst<strong>and</strong> stresses during pillar recovery. This also constitutes a violation <strong>of</strong> 75.202(a).<br />
On August 6, 2007, a sudden <strong>and</strong> violent failure <strong>of</strong> the overstressed coal pillars <strong>and</strong> barrier<br />
occurred in the Main West South Barrier working section. This instantaneous release <strong>of</strong> energy<br />
caused the coal ribs to burst, fatally injuring the six man production crew. A second failure <strong>of</strong> a<br />
coal pillar occurred on August 16, 2007, fatally injuring three rescuers <strong>and</strong> injuring six other<br />
rescuers. This constituted an unwarrantable failure to comply with a m<strong>and</strong>atory st<strong>and</strong>ard.<br />
Type <strong>of</strong> Issuance: 104 (d) (2) Order St<strong>and</strong>ard Violated: 30 CFR 75.203 (a)<br />
Gravity: S&S, Fatal, Occurred<br />
Negligence: High<br />
Condition or Practice: During pillar recovery <strong>of</strong> the Main West South Barrier section from July<br />
15, 2007, until August 6, 2007, the mining <strong>of</strong> bottom coal exposed persons to hazards caused by<br />
faulty pillar recovery methods. GRI mined up to five feet <strong>of</strong> additional bottom coal from the<br />
barrier <strong>and</strong> the pillars. This resulted in pillars with heights up to 13 feet, as opposed to the<br />
original 8-foot high pillars. This compromised the stability <strong>of</strong> the pillars. These pillar<br />
dimensions were not compatible with effective control <strong>of</strong> coal or rock bursts.<br />
On August 6, 2007, a sudden <strong>and</strong> violent failure <strong>of</strong> the overstressed coal pillars occurred,<br />
instantaneously releasing large amounts <strong>of</strong> accumulated energy that exposed miners on the Main<br />
West South Barrier section to hazards related to the coal burst. This constitutes an unwarrantable<br />
failure to comply with a m<strong>and</strong>atory st<strong>and</strong>ard.<br />
Type <strong>of</strong> Issuance: 104 (d) (2) Order St<strong>and</strong>ard Violated: 30 CFR 75.223 (a)<br />
Gravity: S&S, Fatal, Occurred<br />
Negligence: High<br />
Condition or Practice: Revisions <strong>of</strong> the ro<strong>of</strong> control plan were not proposed by the operator<br />
when conditions at the mine indicated that the plan was not adequate or suitable for controlling<br />
the ro<strong>of</strong>, face, ribs or coal bursts. These conditions included bounces, which occurred in the<br />
Main West North Barrier section that resulted in ro<strong>of</strong> <strong>and</strong> rib damage, <strong>and</strong> caused miners to fall<br />
onto the mine floor <strong>and</strong> a reportable coal outburst that occurred on March 7, 2007. The<br />
operator’s failure to make appropriate changes to its ro<strong>of</strong> control plan contributed to the August<br />
174
6, 2007 fatal accident. This constitutes an unwarrantable failure to comply with a m<strong>and</strong>atory<br />
st<strong>and</strong>ard.<br />
Type <strong>of</strong> Issuance: 104 (d) (2) Order St<strong>and</strong>ard Violated: 30 CFR 75.223 (a)<br />
Gravity: S&S, Fatal, Occurred<br />
Negligence: High<br />
Condition or Practice: The operator did not propose adequate revisions to the ro<strong>of</strong> control plan<br />
when conditions at the mine indicated that the plan was not adequate or suitable for controlling<br />
the ro<strong>of</strong>, face, ribs or coal bursts. These conditions included bounces that occurred in the Main<br />
West North Barrier section <strong>and</strong> resulted in ro<strong>of</strong> <strong>and</strong> rib damage <strong>and</strong> equipment damage, <strong>and</strong> a<br />
coal outburst, which occurred on March 10, 2007 <strong>and</strong> caused substantial damage to the section.<br />
The revisions to the ro<strong>of</strong> control plan proposed following the March 10, 2007 coal outburst did<br />
not make the plan adequate or suitable for controlling the ro<strong>of</strong>, face, ribs or coal or rock bursts.<br />
The operator’s failure to make appropriate changes to its ro<strong>of</strong> control plan contributed to the<br />
August 6, 2007 fatal accident. This was an unwarrantable failure to comply with a m<strong>and</strong>atory<br />
st<strong>and</strong>ard.<br />
Type <strong>of</strong> Issuance: 104 (d) (2) Order St<strong>and</strong>ard Violated: 30 CFR 75.223 (a)<br />
Gravity: S&S, Fatal, Occurred<br />
Negligence: Reckless Disregard<br />
Condition or Practice: Revisions <strong>of</strong> the ro<strong>of</strong> control plan were not proposed by the operator<br />
when conditions at the mine indicated that the plan was not adequate or suitable for controlling<br />
the ro<strong>of</strong>, face, ribs or coal bursts. These conditions included bounces that occurred in the Main<br />
West South Barrier section that resulted in ro<strong>of</strong> <strong>and</strong> rib damage, <strong>and</strong> caused miners to fall onto<br />
the mine floor <strong>and</strong> a reportable coal outburst that occurred on August 3, 2007. The operator’s<br />
failure to make appropriate changes to its ro<strong>of</strong> control plan contributed to the August 6, 2007<br />
fatal accident. This constitutes an unwarrantable failure to comply with a m<strong>and</strong>atory st<strong>and</strong>ard.<br />
Type <strong>of</strong> Issuance: 104 (d) (2) Order St<strong>and</strong>ard Violated: 30 CFR 75.220 (a) (1)<br />
Gravity: S&S, Fatal, Occurred<br />
Negligence: Reckless Disregard<br />
Condition or Practice: 30 CFR 75.220(a) (1) requires that a mine operator develop <strong>and</strong> follow a<br />
ro<strong>of</strong> control plan approved by the District Manager. The mine operator did not follow the<br />
approved ro<strong>of</strong> control plan amendment dated June 15, 2007 addressing pillar recovery mining in<br />
the Main West South Barrier. The site specific approved plan does not permit mining in any <strong>of</strong><br />
the barrier to the south <strong>of</strong> the No. 1 entry between crosscut 142 <strong>and</strong> crosscut 139. The barrier<br />
south <strong>of</strong> the No. 1 entry was mined in this restricted mining area. This mining worsened the<br />
stability <strong>of</strong> the barrier <strong>and</strong> pillars in this area <strong>and</strong> contributed to the fatal accident on August 6.<br />
This violation constitutes an unwarrantable failure to comply with a m<strong>and</strong>atory st<strong>and</strong>ard.<br />
Type <strong>of</strong> Issuance: 104 (d) (2) Order St<strong>and</strong>ard Violated: 30 CFR 50.10<br />
Gravity: S&S, Fatal, Occurred<br />
Negligence: Reckless Disregard<br />
Condition or Practice: The operator did not immediately contact <strong>MSHA</strong> at once without delay<br />
<strong>and</strong> within 15 minutes at the toll-free number, 1-800-746-1553, once the operator knew that an<br />
accident in the Main West North Barrier section occurred on March 7, 2007. A coal outburst<br />
threw coal into the mine openings, disrupting regular mining activity for more than one hour.<br />
The accident was not reported to <strong>MSHA</strong> pursuant to this st<strong>and</strong>ard. Without proper notification,<br />
<strong>MSHA</strong> had no opportunity to investigate this accident. The failure to report this accident denied<br />
<strong>MSHA</strong> an opportunity to investigate it <strong>and</strong> learn that the mining methods provided inadequate<br />
protections. This failure contributed to the August 6 fatal accident. This violation is an<br />
unwarrantable failure to comply with a m<strong>and</strong>atory st<strong>and</strong>ard.<br />
175
Type <strong>of</strong> Issuance: 104 (d) (2) Order St<strong>and</strong>ard Violated: 30 CFR 50.10<br />
Gravity: S&S, Fatal, Occurred<br />
Negligence: Reckless Disregard<br />
Condition or Practice: The operator did not immediately contact <strong>MSHA</strong> at once without delay<br />
<strong>and</strong> within 15 minutes at the toll-free number, 1-800-746-1553, once the operator knew that an<br />
accident in the Main West North Barrier section occurred on March 10, 2007. A coal outburst<br />
threw coal into the mine openings, disrupting regular mining activity for more than one hour.<br />
The accident was not reported to <strong>MSHA</strong> pursuant to this st<strong>and</strong>ard. The failure to report this<br />
accident denied <strong>MSHA</strong> an opportunity to investigate it <strong>and</strong> learn that the mining methods<br />
provided inadequate protections. This failure contributed to the August 6 fatal accident. This<br />
violation is an unwarrantable failure to comply with a m<strong>and</strong>atory st<strong>and</strong>ard.<br />
Type <strong>of</strong> Issuance: 104 (d) (2) Order St<strong>and</strong>ard Violated: 30 CFR 50.10<br />
Gravity: S&S, Fatal, Occurred<br />
Negligence: Reckless Disregard<br />
Condition or Practice: The operator did not immediately contact <strong>MSHA</strong> at once without delay<br />
<strong>and</strong> within 15 minutes at the toll-free number, 1-800-746-1553, once the operator knew that an<br />
accident in the Main West South Barrier section occurred on August 3, 2007. A coal outburst<br />
threw coal into the mine openings, disrupting regular mining activity for more than one hour.<br />
The accident was not reported to <strong>MSHA</strong> pursuant to this st<strong>and</strong>ard. The failure to report this<br />
accident denied <strong>MSHA</strong> an opportunity to investigate it <strong>and</strong> learn that the mining methods<br />
provided inadequate protections. This failure contributed to the August 6 fatal accident. This<br />
violation is an unwarrantable failure to comply with a m<strong>and</strong>atory st<strong>and</strong>ard.<br />
Agapito Associates Inc.<br />
Type <strong>of</strong> Issuance: 104 (d) (1) Citation St<strong>and</strong>ard Violated: 30 CFR 75.203 (a)<br />
Gravity: S&S, Fatal, Occurred<br />
Negligence: Reckless Disregard<br />
Condition or Practice: During pillar development <strong>and</strong> recovery in the Main West Barrier<br />
sections, pillar dimensions were not compatible with effective control <strong>of</strong> coal or rock bursts.<br />
Pillar stability analysis confirms that the length <strong>and</strong> width <strong>of</strong> pillars within the active workings,<br />
as well as dimensions <strong>of</strong> the adjoining barrier pillars, did not provide sufficient strength to<br />
withst<strong>and</strong> stresses during pillar recovery. This also constitutes a violation <strong>of</strong> 75.202(a).<br />
On August 6, 2007, a sudden <strong>and</strong> violent failure <strong>of</strong> the overstressed coal pillars <strong>and</strong> barrier<br />
occurred in the Main West South Barrier section. This instantaneous release <strong>of</strong> energy caused<br />
the coal ribs to burst, fatally injuring the six man production crew. A second failure <strong>of</strong> a coal<br />
pillar occurred on August 16, 2007, fatally injuring three rescuers <strong>and</strong> injuring six other rescuers.<br />
Contractor, Agapito Associates Inc., (AAI) inaccurately evaluated the conditions <strong>and</strong> events at<br />
the mine when determining if areas were safe for mining. Based on its results, AAI<br />
recommended to the operator that mining methods were safe <strong>and</strong> pillar <strong>and</strong> barrier dimensions<br />
were appropriate when in fact they were not. The negligence <strong>of</strong> the contractor directly<br />
contributed to the death <strong>of</strong> nine people. This violation is an unwarrantable failure to comply<br />
with a m<strong>and</strong>atory st<strong>and</strong>ard.<br />
176
Appendix A - Persons Participating in the Investigation<br />
Murray Energy Corporation<br />
Jerry M. Taylor ........................................................................................Corporate <strong>Safety</strong> Director<br />
UtahAmerican Energy Inc.<br />
P. Bruce Hill...............................................................................................................President/CEO<br />
Laine Adair ............................................................................................................General Manager<br />
James A. Poulson..................................................................................................... <strong>Safety</strong> Manager<br />
Genwal Resources Inc<br />
Gary D. Peacock .............................................................................................<strong>Mine</strong> Superintendent<br />
Bodee R. Allred ........................................................................................................<strong>Safety</strong> Director<br />
Blaine K. Fillmore .............................................................................. Representative <strong>of</strong> the <strong>Mine</strong>rs<br />
Agapito Associates, Inc.<br />
Michael P. Hardy, Ph.D. ..............................................................President, Chairman <strong>of</strong> the Board<br />
Ware Surveying & Engineering<br />
Cody Ware. .....................................................................................Pr<strong>of</strong>essional Licensed Surveyor<br />
Neva Ridge Technologies<br />
David Cohen, Ph.D. .......................................................................... Vice President <strong>of</strong> Engineering<br />
State <strong>of</strong> Utah<br />
Sherrie Hayashi................................................................................................Labor Commissioner<br />
University <strong>of</strong> Utah<br />
Walter J. Arabasz, Ph.D............................Director <strong>of</strong> the University <strong>of</strong> Utah Seismograph Station<br />
James C. Pechmann, Ph.D. .................................. Associate Pr<strong>of</strong>essor <strong>of</strong> Geology <strong>and</strong> Geophysics<br />
Kristine Pankow, Ph.D................... Asst. Director <strong>of</strong> the University <strong>of</strong> Utah Seismograph Stations<br />
Michael K. McCarter, Ph.D. ........................................ Pr<strong>of</strong>essor <strong>and</strong> Chair <strong>of</strong> Mining Engineering<br />
William G. Pariseau, Ph.D............................................................Pr<strong>of</strong>essor <strong>of</strong> Mining Engineering<br />
West Virginia University<br />
Keith A. Heasley, Ph.D.................................................................Pr<strong>of</strong>essor <strong>of</strong> Mining Engineering<br />
U. S. Geological Survey, Earth Resources Observation <strong>and</strong> Science Center<br />
Zhong Lu, Ph.D............................................................... Scientist, Radar Project <strong>of</strong> L<strong>and</strong> Sciences<br />
Bureau <strong>of</strong> L<strong>and</strong> Management<br />
James F. Kohler ............................................................................. Chief, Branch <strong>of</strong> Solid <strong>Mine</strong>rals<br />
Stephen W. Falk..................................................................................................... Mining Engineer<br />
A-1
<strong>Mine</strong> <strong>Safety</strong> <strong>and</strong> <strong>Health</strong> <strong>Administration</strong><br />
Richard A. Gates.................................................................................................... District Manager<br />
Michael Gauna....................................................................................................... Mining Engineer<br />
Thomas A. Morley................................................................................................. Mining Engineer<br />
Joseph R. O’Donnell Jr................................................................ Supervisory Coal <strong>Mine</strong> Inspector<br />
Gary E. Smith............................................................................... Supervisory Coal <strong>Mine</strong> Inspector<br />
Timothy R. Watkins................................................................................Assistant District Manager<br />
Chris A. Weaver........................................................................... Supervisory Coal <strong>Mine</strong> Inspector<br />
Joseph C. Zelanko..............................................................................Supervisory Mining Engineer<br />
Steve Powroznik ........................................................................................Education Field Services<br />
James I. Pruitt........................................................... Coal <strong>Mine</strong> <strong>Safety</strong> & <strong>Health</strong> Inspector Trainee<br />
Michael E. Turner ............................................................................... <strong>Health</strong> <strong>and</strong> <strong>Safety</strong> Specialist<br />
A-2
Appendix B - Victim Data Sheets<br />
B-1
B-2
B-3
B-4
B-5
Appendix C - <strong>Safety</strong> Zone Map
Appendix D - <strong>Mine</strong> Development History Map
Appendix E - AAI May 5, 2000, <strong>Report</strong><br />
Barrier Pillar to Protect Bleeders for Panel 15, South <strong>of</strong> West Mains<br />
E-1
E-2
E-3
E-4
E-5
E-6
Appendix F - AAI July 20, 2006, Draft <strong>Report</strong><br />
DRAFT-GENWAL Cr<strong>and</strong>all Canyon <strong>Mine</strong> Main West Barrier Mining Evaluation<br />
F-1
F-2
F-3
F-4
F-5
F-6
F-7
F-8
F-9
F-10
F-11
F-12
F-13
F-14
F-15
F-16
F-17
F-18
F-19
F-20
F-21
F-22
F-23
F-24
F-25
F-26
F-27
F-28
F-29
F-30
F-31
Appendix G - AAI August 9, 2006, <strong>Report</strong><br />
GENWAL Main West Retreat Analysis--Preliminary Results<br />
G-1
G-2
G-3
G-4
G-5
G-6
G-7
G-8
G-9
G-10
G-11
G-12
G-13
G-14
G-15
G-16
G-17
G-18
G-19
G-20
G-21
G-22
G-23
G-24
G-25
G-26
G-27
G-28
G-29
G-30
G-31
G-32
Appendix H - AAI December 8, 2006, <strong>Report</strong><br />
Cr<strong>and</strong>all Canyon <strong>Mine</strong> Ground Condition Review for Mining in the Main West North Barrier<br />
H-1
H-2
H-3
H-4
H-5
H-6
Appendix I - AAI April 18, 2007, <strong>Report</strong><br />
GENWAL Cr<strong>and</strong>all Canyon <strong>Mine</strong> Main West South Barrier Mining Evaluation<br />
I-1
I-2
I-3
I-4
I-5
I-6
I-7
I-8
I-9
I-10
Appendix J - Ro<strong>of</strong> Control Plan for Recovering South Barrier Section<br />
J-1
J-2
J-3
J-4
J-5
Appendix K - Massive Pillar Collapse<br />
The accident that occurred on August 6 at Cr<strong>and</strong>all Canyon <strong>Mine</strong> was a rapid, catastrophic<br />
failure <strong>of</strong> coal pillars. In a very short time period, failure was manifested as pillar bursting that<br />
propagated over a broad area <strong>of</strong> the mine. Failure <strong>of</strong> coal pillars in “domino” fashion is referred<br />
to using a variety <strong>of</strong> terms such as massive pillar collapse, cascading pillar failure, or pillar run.<br />
At Cr<strong>and</strong>all Canyon <strong>Mine</strong> the failure involved the violent expulsion <strong>of</strong> coal; however, other<br />
events characterized using the same terms (e.g., massive pillar collapse) may not.<br />
Bureau <strong>of</strong> <strong>Mine</strong>s investigations in the 1990’s 19 , documented more than a dozen massive pillar<br />
collapse events that occurred in U.S. coal mines. A detailed examination <strong>of</strong> these events<br />
revealed the following common characteristics:<br />
• slender pillars (width-to-height ratio less than 3.0),<br />
• low StF (less than 1.5),<br />
• competent ro<strong>of</strong> strata,<br />
• collapsed area greater than 4 acres, <strong>and</strong><br />
• minimum dimension <strong>of</strong> the collapsed areas greater than 350 ft.<br />
Based on these findings, Mark et al. recommended several strategies to reduce the likelihood <strong>of</strong><br />
such catastrophic failures. However, the strategies pertain only to collapses involving small or<br />
slender pillars under relatively shallow overburden (i.e., the types <strong>of</strong> failure they had evaluated).<br />
Although these failures are sudden (<strong>of</strong>ten involving substantial air blasts), they are distinctly<br />
different from coal bursts. Mark et al. noted this distinction as follows:<br />
Finally, it is important to note that the massive pillar collapses discussed in this<br />
paper are not to be confused with coal bumps or rock bursts. Although the<br />
outcomes may appear similar, the underlying mechanics are entirely different.<br />
Bumps [bursts] are sudden, violent failures that occur near coal mine entries <strong>and</strong><br />
expel large amounts <strong>of</strong> coal <strong>and</strong> rock into the excavation (Maleki 20 ). They occur<br />
at great depth, affect pillars (<strong>and</strong> longwall panels) with large w/h ratios, <strong>and</strong> are<br />
<strong>of</strong>ten associated with mining-induced seismicity. The design recommendations<br />
discussed here for massive pillar collapses do not apply to coal bump control.<br />
Pillars in the Main West <strong>and</strong> adjacent North <strong>and</strong> South Barrier sections were at low risk for the<br />
type <strong>of</strong> slender pillar collapse that Mark et al. studied. However, they were at significant risk for<br />
bursting.<br />
The basic condition for a massive pillar collapse is a large area <strong>of</strong> pillars loaded almost to failure.<br />
Since all <strong>of</strong> the pillars are near failure, when one instability occurs, the transfer <strong>of</strong> load from that<br />
pillar to its neighbors causes them to fail <strong>and</strong> so on. In a large area <strong>of</strong> similarly sized pillars near<br />
failure, this process can continue unabated. Larger or more stable pillars (or barriers) that may<br />
stop the progression <strong>of</strong> failure are absent. Such was the case in the Main West area <strong>of</strong> Cr<strong>and</strong>all<br />
Canyon <strong>Mine</strong>.<br />
K-1
Furthermore, the pillars at Cr<strong>and</strong>all Canyon <strong>Mine</strong> were not slender * <strong>and</strong> were capable <strong>of</strong> storing<br />
substantial amounts <strong>of</strong> energy that was released as a burst. Pillars with width-to-height (w/h)<br />
ratios between 5 <strong>and</strong> 10 21 are considered to be bump prone. Pillar w/h ratios at Cr<strong>and</strong>all Canyon<br />
<strong>Mine</strong> ranged from 7 ½ to 8 ¾ in the collapse area.<br />
* Slender pillars are those that are relatively narrow with respect to their height (e.g., width is less than 5<br />
time the height).<br />
K-2
Appendix L - Subsidence Data<br />
Information was obtained from the U. S. Geological Survey (USGS) that defined the extent <strong>of</strong><br />
surface deformation above the accident site. USGS scientists use radar satellite images<br />
(interferometric synthetic aperture radar or InSAR) to measure small movements on the earth’s<br />
surface for their research on volcanoes, earthquakes, subsidence from groundwater pumping, <strong>and</strong><br />
other ground disturbances from natural <strong>and</strong> man-made causes. The technique has been used in<br />
Europe to study mining subsidence since 1996, but its use has been limited in the U.S. coal<br />
mining industry. USGS applied this technology in the vicinity <strong>of</strong> the Cr<strong>and</strong>all Canyon <strong>Mine</strong> <strong>and</strong><br />
were able to identify an extensive subsidence region associated with the August 2007 accident.<br />
Neva Ridge Technologies (Neva Ridge) was contracted to verify the USGS study. The Neva<br />
Ridge report is provided in Appendix M in its entirety.<br />
InSAR Surface Deformation<br />
The InSAR deformation measurement technology relies on bouncing radar signals <strong>of</strong>f the earth<br />
from satellites orbiting over the same area at different time periods. By studying the differences<br />
in the images, InSAR can detect small changes in the distance to the ground surface relative to<br />
the satellite. InSAR detects very small movements that can not be visually noticed. InSAR<br />
shows patterns <strong>of</strong> deformation as color b<strong>and</strong>s with each b<strong>and</strong> representing a few centimeters<br />
(cm) <strong>of</strong> movement. The following figures from the USGS publication “Monitoring Ground<br />
Deformation from Space” illustrate the use <strong>of</strong> the InSAR technology. Figure 96 depicts the<br />
orbiting satellites scanning the surface <strong>of</strong> the earth with transmitted radar waves bouncing back<br />
to the satellite.<br />
Figure 96 - How Satellites <strong>and</strong> Radar Interferometry Detect Surface Movement<br />
from USGS Fact Sheet 2005-3025<br />
L-1
Figure 97 – Example <strong>of</strong> Interferogram Color B<strong>and</strong>ing from USGS Fact Sheet 2005-3025<br />
The radar images are processed to determine deformation. Figure 97 is an example from<br />
California showing the interferogram color b<strong>and</strong>ing generated from an InSAR analysis that<br />
depicts regional subsidence <strong>and</strong> localized uplift. Included in Figure 97 is the topographic detail<br />
<strong>of</strong> the subsidence <strong>and</strong> uplift for the study area with the vertical scale exaggerated.<br />
Cr<strong>and</strong>all Canyon <strong>Mine</strong> InSAR Surface Deformation.<br />
There are only a limited number <strong>of</strong> InSAR images over the Cr<strong>and</strong>all Canyon <strong>Mine</strong> area. The<br />
USGS identified a Japanese ALOS PALSAR satellite scan for June 8, 2007 (before the accident)<br />
that covered the Cr<strong>and</strong>all Canyon <strong>Mine</strong> reserve area <strong>and</strong> another satellite scan on September 8,<br />
2007 (after the accident). InSAR analysis <strong>of</strong> the radar imagery between the June <strong>and</strong> September<br />
time periods generated the InSAR deformation image shown in Figure 98. The image identifies<br />
a region <strong>of</strong> subsidence centered on the west flank <strong>of</strong> East Mountain in the vicinity <strong>of</strong> the Cr<strong>and</strong>all<br />
Canyon August 2007 accident sites. Figure 98 shows the terrain surrounding the mine area, with<br />
nearby valleys identified for geographic reference. The Line-<strong>of</strong>-Sight (LOS) deformation in<br />
Figure 98 represents subsidence movement measured in a non vertical direction from the<br />
satellite. In the USGS analysis, the deformation is measured along a LOS <strong>of</strong> 39.7º from vertical.<br />
The InSAR images were processed <strong>and</strong> provided by a staff scientist <strong>of</strong> the Radar Project <strong>of</strong> L<strong>and</strong><br />
Sciences at the USGS Earth Resources Observation <strong>and</strong> Science Center.<br />
L-2
Figure 98 - USGS InSAR Image <strong>of</strong> Subsidence above the Accident Site.<br />
The surface deformation depicted occurred between June 8, 2007, <strong>and</strong> September 8, 2007.<br />
The InSAR image furnished by USGS was referenced by latitude <strong>and</strong> longitude, allowing<br />
conversion into state plane coordinates. The accident investigation team translated <strong>and</strong> rotated<br />
the InSAR image onto the Cr<strong>and</strong>all Canyon <strong>Mine</strong> coordinate system using known state plane <strong>and</strong><br />
corresponding mine local survey points. The InSAR deformation image with 5 cm color b<strong>and</strong>ing<br />
was contoured by the accident investigation team with some guidance from USGS to delineate<br />
the ground surface subsidence (see Figure 99).<br />
The displacement contour values are Line-<strong>of</strong>-Sight (LOS) from the satellite. In Figure 99,<br />
maximum LOS subsidence contour is 20 cm (approximately 8 inches LOS). Each repetition <strong>of</strong><br />
the color b<strong>and</strong> (i.e., sequence <strong>of</strong> rainbow colors) represents 5 cm <strong>of</strong> LOS deformation with the<br />
repetitive color b<strong>and</strong>ing indicating successive 5 cm increments <strong>of</strong> movement. Mining<br />
subsidence is typically vertical; therefore, LOS subsidence values are multiplied by 1.29 (1/cos<br />
39.7º) to determine vertical deformation. Consequently, the 20 cm LOS deformation contour<br />
converts to approximately 25 cm (approximately 10 inches) vertical surface subsidence. The<br />
movement is significant but, at a magnitude that cannot be detected visually on the mountainside.<br />
L-3
Figure 99 - Surface Deformation from USGS InSAR<br />
Color b<strong>and</strong>ing contoured to delineate Line-<strong>of</strong>-Sight successive 5 cm subsidence movement. Maximum LOS<br />
movement <strong>of</strong> 20 cm (~8 inches) contoured.<br />
The analysis performed by Neva Ridge included a contoured map <strong>of</strong> 5 cm vertical subsidence<br />
contours. The contoured map is included as Figure 100 below.<br />
Figure 100 - InSAR Vertical Subsidence Contours (cm) from Neva Ridge<br />
L-4
The contours on the USGS results were converted to vertical values <strong>and</strong> overlain on the Neva<br />
Ridge results for comparison. All measurements less than 2 cm were considered noise by Neva<br />
Ridge <strong>and</strong> removed from the map. The comparison <strong>of</strong> the two results is shown in Figure 101.<br />
The results are very similar except for the south-west portion <strong>of</strong> the depression. Tracing the<br />
contours <strong>of</strong> the USGS image was very difficult in this area due to the rapid rate <strong>of</strong> change,<br />
making it challenging to follow the color b<strong>and</strong>ing in Figure 99. The uncertainty in this area was<br />
a factor in retaining an independent analysis. The Neva Ridge contours developed by experts in<br />
InSAR analysis were therefore used throughout this report. The Neva Ridge InSAR surface<br />
subsidence contours were overlain onto the mine workings <strong>and</strong> identify a wide spread subsidence<br />
basin with the 25 cm (10-inch) vertical subsidence contour centered within the South Barrier<br />
section, roughly between crosscuts 133 <strong>and</strong> 139 (see Figure 31).<br />
Figure 101 - Comparison <strong>of</strong> Vertical Subsidence from Interpreted USGS <strong>and</strong> Neva Ridge InSAR Results<br />
The geometry <strong>of</strong> the InSAR surface subsidence depression indicates that the Main West <strong>and</strong><br />
North <strong>and</strong> South Barrier sections have undergone extensive pillar failure. The knowledge that<br />
surface deformations radiate around collapse regions was used to extrapolate the extent <strong>of</strong><br />
damage into adjoining regions that could not be traveled or investigated. Subsidence principles<br />
suggest that the extent <strong>of</strong> the collapse at seam level would be less laterally but greater vertically<br />
than the surface expression implies. The development <strong>of</strong> bed separations <strong>and</strong> other openings<br />
within the overburden can cause surface subsidence to be less than the full height <strong>of</strong> closure at<br />
mine level. Conversely, the collapse at mine level will draw the overburden downward with<br />
subsidence deformations radiating outward <strong>and</strong> laterally over an area greater that the collapsed<br />
area. Although subsidence research has primarily focused on full extraction mining, it is<br />
reasonable to expect that strata will respond similarly to a pillar collapse.<br />
InSAR analyses were performed using satellite images from December 2006 <strong>and</strong> June 2007<br />
specifically to determine if surface subsidence had been associated with pillar recovery in the<br />
L-5
North Barrier section. No subsidence was detected. However, it is possible that subsidence<br />
occurred but the deformation was too small to measure or it was masked by ground surface<br />
conditions. December radar scans would be affected by snow cover <strong>and</strong> June’s radar scans<br />
would not. Snow cover tends to generate data scatter (noise) that interferes with InSAR<br />
analyses.<br />
InSAR Validation with Longwall Subsidence Monitoring Data<br />
In 1999, a subsidence monitoring line was established on the north-to-south trending ridge <strong>of</strong><br />
East Mountain. The survey line over a portion <strong>of</strong> Main West <strong>and</strong> Panels 13 to 17 was monitored<br />
from September 2000 to July 2004 by Ware Surveying, LLC (surveying contractor) using GPS<br />
survey technology. Surveys were performed using a Trimble GPS Total Station 4700 <strong>and</strong> Real<br />
Time Kinematics processing. The vertical accuracy <strong>of</strong> these surveys was reported to be ± 0.2-<br />
foot (roughly ± 6 cm). The survey monuments were 5/8-inch rebar driven into the ground.<br />
Surface monuments were resurveyed on August 17, 2007, along the portion <strong>of</strong> the line from the<br />
center <strong>of</strong> Panel 14 to just north <strong>of</strong> Panel 13. These GPS subsidence measurements are the only<br />
reliable information available for comparison with the InSAR analyses. On August 17, six <strong>of</strong> 16<br />
survey stations had been destroyed in the area <strong>of</strong> interest. However, some <strong>of</strong> the remaining<br />
monuments lie within the deformation crater identified using InSAR. The northern end <strong>of</strong> the<br />
survey line terminates along the 20 cm (8-inch vertical) deformation contour. The southern<br />
portion <strong>of</strong> the line lies outside <strong>of</strong> the 2 cm vertical subsidence contour (see Figure 102).<br />
Figure 102 - InSAR Vertical Subsidence Contours & GPS Subsidence Line Data<br />
Three stations near the southern end <strong>of</strong> the survey line showed no movement since 2004; this<br />
observation is consistent with the InSAR analysis in this area (see Figure 102). Two survey<br />
stations which showed approximately 10 cm <strong>of</strong> vertical movement (since 2004) were located<br />
within the 2 to 5 cm InSAR vertical deformation contours. Five stations at the northern end <strong>of</strong><br />
the survey line showed 30 cm <strong>of</strong> vertical movement (since 2004) although they were located<br />
along the 20 cm InSAR vertical deformation contour.<br />
L-6
InSAR provides a more reliable characterization <strong>of</strong> surface subsidence associated with pillar<br />
recovery in the South Barrier section since it only captures movement that occurred between<br />
June <strong>and</strong> September 2007. GPS survey data incorporates deformations that occurred over a<br />
longer time period between 2004 <strong>and</strong> August 17, 2007. For example, the five northern stations<br />
<strong>of</strong> the survey line showed remarkably similar displacements between 2004 <strong>and</strong> 2007 (i.e., 29 to<br />
33 cm). These stations are situated near the edge <strong>of</strong> Panel 13 <strong>and</strong> the original unmined South<br />
Barrier. The data suggest that this area subsided gradually over the years between 2000 <strong>and</strong><br />
2004. It is possible that some amount <strong>of</strong> residual longwall subsidence <strong>and</strong> variations due to<br />
surveying precision (±6 cm) account for the 10 cm difference between the InSAR <strong>and</strong> GPS<br />
survey data.<br />
Longwall Mining Subsidence History<br />
Main West <strong>and</strong> adjoining barrier pillars near the accident area are bounded to the north <strong>and</strong> also<br />
to the south by six extracted longwall panels. To establish if unanticipated or unusual subsidence<br />
from the longwall extraction affected the region, the Panels 13 to 17 subsidence information was<br />
compared to information from h<strong>and</strong>books <strong>and</strong> references. The data suggests that the Cr<strong>and</strong>all<br />
Canyon <strong>Mine</strong> subsidence is similar to that published for deep longwall districts.<br />
Data from the subsidence surveys show the development <strong>of</strong> the subsidence trough with the<br />
extraction <strong>of</strong> successive longwall panels. As illustrated in Figure 103 surface pr<strong>of</strong>iles do not<br />
begin to show the formation <strong>of</strong> a critical subsidence basin 22 (i.e., when subsidence reaches the<br />
maximum possible value) until 2001 when the third successive panel (Panel 15) was extracted.<br />
This delayed subsidence behavior is typical <strong>of</strong> the Wasatch Plateau where strong, thick strata in<br />
the overburden control caving characteristics. Similarly, these strong units can resist caving <strong>and</strong><br />
form cantilevers at panel boundaries (as indicated by the absence <strong>of</strong> subsidence over more than<br />
half the width <strong>of</strong> Panel 13). Subsidence data collected elsewhere in the region indicates that the<br />
amount or extent <strong>of</strong> cantilevered strata at panel boundaries varies. These strata can be<br />
responsible for high abutment stresses <strong>and</strong> long abutment stress transfer distances.<br />
Figure 103 - Longwall Panels 13 to 15 GPS Surveyed Subsidence Pr<strong>of</strong>iles<br />
L-7
Early measurements (2000 to 2002) show a surface elevation increase above the baseline from<br />
about the middle <strong>of</strong> Panel 13 to the barrier south <strong>of</strong> Main West. Cantilevered strata may be<br />
responsible for this movement. The data also suggest that the strata gradually subsided in this<br />
area over time.<br />
Subsidence values derived from the surveyed pr<strong>of</strong>iles over Panels 13 to 17 are summarized in<br />
Table 14. The Panel 13 to 17 pr<strong>of</strong>ile is supercritical in character where maximum subsidence<br />
(Smax) is achieved. Also, listed in Table 14 is the horizontal distance (d) from the excavation<br />
edge to the inflection point (point dividing the concave <strong>and</strong> convex portions <strong>of</strong> the subsidence<br />
pr<strong>of</strong>ile). The supercritical width (W) for these Cr<strong>and</strong>all Canyon <strong>Mine</strong> longwall panels is<br />
comparable to other Wasatch Plateau longwall panels. Also, the subsidence factor (Smax/m)<br />
shown in the table is typical for longwall mining.<br />
The distance to the inflection point (d) was calculated from subsidence references using Panel 13<br />
to 17 factors as shown in the lower portion <strong>of</strong> Table 14. This distance for the Panel 13 to 17<br />
pr<strong>of</strong>ile survey is roughly 500 feet. This value is similar to the values calculated from references.<br />
This information suggests that the Cr<strong>and</strong>all Canyon subsidence <strong>and</strong> associated overburden<br />
bridging over extracted panels is comparable to other deep full extraction mining.<br />
Table 14 - Cr<strong>and</strong>all Canyon Longwall Subsidence Parameters, Values, <strong>and</strong> Comparisons<br />
Longwall<br />
Subsidence Data<br />
Source<br />
Parameter<br />
Approx.<br />
Depth<br />
(h), ft.<br />
<strong>Mine</strong>d<br />
Height<br />
(m), ft.<br />
Approx.<br />
Maximum<br />
Subsidence<br />
(Smax), ft.<br />
Approx.<br />
Supercritical<br />
Width (W), ft.<br />
Values<br />
Smax/m<br />
Approx.<br />
Distance to<br />
Inflection<br />
Point (d), ft.<br />
Cr<strong>and</strong>all Canyon<br />
<strong>Mine</strong> Panels 13-17<br />
2,150 7.9 5.0 2,300 0.63 500<br />
Surface Subsidence<br />
Engineering<br />
H<strong>and</strong>book 22 2,150<br />
used in<br />
Fig 2.4<br />
2,300<br />
used in chart<br />
Fig 2.4<br />
0.63<br />
used in<br />
Fig 2.4<br />
495<br />
2,150<br />
2,300<br />
Average Estimate<br />
from SDPS Chart 23 used in<br />
used in Fig<br />
Fig 3.2.1<br />
3.2.1<br />
505<br />
L-8
Appendix M - Neva Ridge Technologies <strong>Report</strong><br />
M-1
Final <strong>Report</strong><br />
<strong>MSHA</strong> Contract DOLB08MR20605<br />
April 18, 2008<br />
Prepared by Neva Ridge Technologies<br />
Contact:<br />
David Cohen, Ph.D.<br />
Neva Ridge Technologies<br />
4750 Walnut Street<br />
Suite 205<br />
Boulder, Colorado 80301<br />
(303) 443-9966<br />
cohen@nevaridge.com<br />
Neva Ridge Technologies, 4750 Walnut St., Suite 205 Boulder CO, 80301, (303) 443-9966
1 Introduction<br />
1.1 Data Description<br />
Data from the ALOS/PALSAR sensor were obtained from the AADN (Americas ALOS Data<br />
Node, http://www.asf.alaska.edu/alos), located at the Alaska Satellite Facility in Fairbanks,<br />
Alaska. The dates <strong>of</strong> the acquisitions <strong>and</strong> the unique data designation numbers are shown in the<br />
table below.<br />
Date<br />
June 8, 2007<br />
September 8, 2007<br />
Designation<br />
HH-ALPSRP072960780<br />
HH-ALPSRP086380780<br />
The ALOS satellite maintains a sun-synchronous, near polar orbit; this is a retrograde orbit that<br />
precesses in a plane that is at an inclination <strong>of</strong> 98.16 degrees. For the geographic location <strong>of</strong> this<br />
data collection, the following figure shows the geometry. Note that for these particular data<br />
acquisitions, the satellite was in the ascending portion <strong>of</strong> its orbit; the satellite looks to the right<br />
(starboard) side during data collection. Locally, then, the line-<strong>of</strong>-site is 38.7 degrees from the<br />
local vertical <strong>and</strong> 10.0 degrees above the local East direction.<br />
Line-<strong>of</strong>-Site<br />
Satellite Orbit<br />
E<br />
38.7°<br />
-N<br />
-10.0°<br />
Figure 1. Diagram showing the geometry <strong>of</strong> the data acquisition at the site <strong>of</strong><br />
interest.<br />
Neva Ridge Technologies, 4750 Walnut St., Suite 205 Boulder CO, 80301, (303) 443-9966 2
1.2 Processing Description<br />
Data were processed to complex SAR imagery using tools from Gamma S<strong>of</strong>tware. This is<br />
st<strong>and</strong>ardized processing s<strong>of</strong>tware that ingests data from most civil SAR sensors. (Neva Ridge is a<br />
US distributor for this s<strong>of</strong>tware.) The interferometry is performed with a combination <strong>of</strong><br />
additional Gamma S<strong>of</strong>tware tools <strong>and</strong> internal Neva Ridge tools. Complex images are<br />
coregistered <strong>and</strong> the modeled phase due to topography is subtracted using the USGS 3 arcsecond<br />
elevation product. Following an iteration to remove errors in the estimated baseline, the<br />
interferogram is smoothed using a Goldstein filter 1 with a filter exponent <strong>of</strong> .6. The converted<br />
unwrapped results naturally represent the motion along the radar line-<strong>of</strong>-site (see previous figure)<br />
but can be converted to vertical motion with some assumptions. In particular, under the<br />
assumption that the ground motion is purely in the vertical direction, we can back-project the<br />
measured motion along the vertical direction. However, if we assume that the actual ground<br />
motion has a combination <strong>of</strong> horizontal <strong>and</strong> vertical components, there is no way to uniquely<br />
attach the measured line-<strong>of</strong>-site displacement to a unique set <strong>of</strong> horizontal <strong>and</strong> vertical<br />
displacements.<br />
For display <strong>and</strong> some data manipulation, reprojection, <strong>and</strong> minor post-processing <strong>of</strong> the results,<br />
we use a combination <strong>of</strong> PCI Geomatics, Gamma display utilities, <strong>and</strong> internal tools.<br />
2 Results<br />
In the following sections, we include plan view diagrams (those specified in the SOW)<br />
representing the results <strong>of</strong> the interferometric processing. Each <strong>of</strong> the plan view figures below<br />
represent a region approximately centered on the coordinate NAD27 39°28’01.6”N,<br />
111°13’16.2”W, with spatial extent <strong>of</strong> 3514 meters on a side.<br />
In addition, in each <strong>of</strong> the plan view figures, reference points (shown as crosshairs) are included.<br />
The coordinates <strong>of</strong> these are:<br />
Point WGS 84<br />
1. 111°14’04.9”W, 39°27’12.2”N<br />
2. 111°13’13.3”W, 39°27’43.0”N<br />
3. 111°13’09.1”W, 39°28’04.8”N<br />
2.1 Line-<strong>of</strong>-Site InSAR Color Contours<br />
In this representation, line-<strong>of</strong>-site displacements are presented as color-coded contours. In order<br />
to enhance the visual dynamic range <strong>of</strong> the image, the color scale wraps at a specified interval,<br />
which is shown on the adjacent color bar. For context, the color contours in Figure 2 are<br />
superimposed on the corresponding SAR image. As the interpretation <strong>of</strong> the SAR image is not<br />
necessarily intuitive, we have also annotated the physical regions represented by the SAR image<br />
shades/textures. The peak line-<strong>of</strong>-site subsidence measured in this data is 24 cm. Figure 3 shows<br />
the same information without the SAR image background layer.<br />
1 R.M. Goldstein, C.L. Werner, “Radar Interferogram Filtering for Geophysical Applications,” Geophys. Res.<br />
Letters, V25, No21, 1998<br />
Neva Ridge Technologies, 4750 Walnut St., Suite 205 Boulder CO, 80301, (303) 443-9966 3
Each color cycle means<br />
10 cm <strong>of</strong> displacement<br />
0 cm<br />
-10 cm<br />
Valley Floor<br />
West Face<br />
Treeless Region<br />
Figure 2. Color contours superimposed on the corresponding SAR image. A peak<br />
displacement <strong>of</strong> 24 cm (along the line-<strong>of</strong>-site, away from the radar) is measured.<br />
Each color cycle means<br />
10 cm <strong>of</strong> displacement<br />
0 cm<br />
-10 cm<br />
Figure 3. Color contour with no SAR image background layer. A peak<br />
displacement <strong>of</strong> 24 cm (along the line-<strong>of</strong>-site, away from the radar) is measured.<br />
Neva Ridge Technologies, 4750 Walnut St., Suite 205 Boulder CO, 80301, (303) 443-9966 4
2.2 Line-<strong>of</strong>-Site Deformation Contours<br />
The line-<strong>of</strong>-site deformation contours are produced at 5 cm intervals <strong>and</strong> are shown in Figure 4.<br />
It is not uncommon in InSAR measurements to contain atmospheric effects that are on the order<br />
<strong>of</strong> 1-2 cm. These are produced by moisture (dielectric) variations in the atmosphere that produce<br />
noise due to variable phase delays <strong>of</strong> the radar signal. Using an initial contour <strong>of</strong> 5 cm mitigates<br />
visual interference due to this low-level noise.<br />
LOS Contours<br />
∆=5 cm<br />
5<br />
20<br />
10<br />
15<br />
Figure 4. Line-<strong>of</strong>-site deformation contours with intervals <strong>of</strong> 5 cm. Motion is<br />
away from the radar.<br />
2.3 Vertical Deformation Contours<br />
Vertical deformation measurements may be derived from the line-<strong>of</strong>-site measurements under<br />
the assumption that motion is purely vertical. Based on the diagram in Figure 1, the relationship<br />
between the line-<strong>of</strong>-site measurement <strong>and</strong> vertical measurements is:<br />
δ<br />
LOS<br />
δ<br />
vert<br />
=<br />
cos(38.7)<br />
The result <strong>of</strong> this transformation is shown in Figure 5.<br />
Neva Ridge Technologies, 4750 Walnut St., Suite 205 Boulder CO, 80301, (303) 443-9966 5
Vertical Contours<br />
∆=5 cm<br />
5<br />
10<br />
25<br />
15<br />
20<br />
Figure 5. Vertical contours. A peak displacement <strong>of</strong> 30 cm (vertical, downward)<br />
is measured.<br />
Vertical Contours<br />
∆=5 cm<br />
5<br />
2<br />
10<br />
25<br />
15<br />
20<br />
Figure 6. Vertical contours are combined with a color scale. For visual clarity,<br />
measurements outside the main feature, with values <strong>of</strong> 2 cm or less, have been<br />
removed.<br />
Neva Ridge Technologies, 4750 Walnut St., Suite 205 Boulder CO, 80301, (303) 443-9966 6
2.4 Google Earth View<br />
Figure 7 shows a Google Earth composite with the InSAR vertical displacements. The InSAR<br />
data have been filtered so as to remove measurements outside the main feature, with<br />
displacements <strong>of</strong> less than 2 cm. This results in a better visual representation <strong>of</strong> the data.<br />
Figure 7. Google Earth composite image.<br />
Neva Ridge Technologies, 4750 Walnut St., Suite 205 Boulder CO, 80301, (303) 443-9966 7
Appendix N - Seismic Analysis<br />
University <strong>of</strong> Utah Seismograph Stations<br />
Continuous earthquake monitoring has been conducted at the University <strong>of</strong> Utah since 1907.<br />
The University <strong>of</strong> Utah Seismograph Stations (UUSS) is an entity within the Department <strong>of</strong><br />
Geology <strong>and</strong> Geophysics. The mission <strong>of</strong> the UUSS is primarily academic research while also<br />
providing earthquake information to the general public <strong>and</strong> public <strong>of</strong>ficials. The UUSS is also a<br />
participant in the Advanced National Seismograph System (ANSS). The mission <strong>of</strong> the ANSS is<br />
to provide accurate <strong>and</strong> timely data for seismic events.<br />
The UUSS maintains a regional/urban seismic network <strong>of</strong> over two hundred stations. An<br />
average <strong>of</strong> one thous<strong>and</strong> seismic events is detected in Utah each year. The number <strong>of</strong> events<br />
depends on the magnitude threshold <strong>of</strong> reporting. The number <strong>of</strong> recorded events includes those<br />
from natural sources (tectonic earthquakes) as well as those related to mining activity. In the<br />
Wasatch Plateau <strong>and</strong> Book Cliffs mining areas, at least 97% <strong>of</strong> the events have been identified as<br />
being related to mining activity. These events are termed mining-induced seismicity. Both<br />
tectonic <strong>and</strong> mining-induced seismic events can be referred to as earthquakes.<br />
The majority <strong>of</strong> coal mining in Utah occurs in the Wasatch Plateau <strong>and</strong> Book Cliffs area. The<br />
coal fields form the shape <strong>of</strong> an inverted “U” in Carbon <strong>and</strong> Emery counties. In the coal mining<br />
region, nearly all the seismic events are mining-induced. Again, the number <strong>of</strong> events depends<br />
on the magnitude threshold. Special studies have recorded several thous<strong>and</strong> such events in a<br />
single year. Figure 104 is a plot <strong>of</strong> mining-induced seismicity from 1978 to 2007. Over 19,000<br />
events are included. Mining-induced seismicity occurs regularly from normal mining activity in<br />
the Utah coal fields.<br />
Figure 104 - Mining-Induced Seismicity in Utah<br />
(from W. Arabasz presentation to Utah Mining Commission, November 2007)<br />
N-1
The regional seismograph network includes several stations situated in the mining region. The<br />
location <strong>of</strong> these stations is shown in Figure 105. The stations are connected by telemetry to the<br />
UUSS central recording laboratory.<br />
Figure 105 - Locations <strong>of</strong> UUSS Seismographs in the Wasatch Plateau<br />
In the Book Cliffs Mining Area 24<br />
Seismic Event Locations <strong>and</strong> Magnitudes<br />
The magnitude <strong>of</strong> earthquakes is <strong>of</strong>ten reported in terms <strong>of</strong> the local magnitude (M L ). The local<br />
magnitude scale is a logarithmic scale developed by Charles Richter to measure the relative sizes<br />
<strong>of</strong> earthquakes in California. The scale was based on the amplitude recorded on a Wood-<br />
Anderson seismograph. The scale has been adapted for use around the world <strong>and</strong> is also known<br />
as the Richter scale.<br />
Many additional scales have been used to measure earthquakes. Most scales are designed to<br />
report magnitudes similar to the local magnitude. The coda magnitude (M C ) is based on the<br />
length <strong>of</strong> the seismic signal. The coda magnitude scale used by the UUSS was calibrated to<br />
N-2
provide similar results on average with the local magnitude scale for naturally occurring<br />
earthquakes. The UUSS has observed that mining related seismic events are shallow compared<br />
to most naturally occurring earthquakes <strong>and</strong> the duration or coda tends to be longer. This results<br />
in a slightly higher coda magnitude than local magnitude for mining-induced events.<br />
It was not possible for the UUSS to calculate the local magnitude for all events. The coda<br />
magnitude was available for all reported events. While the local magnitude or M L was the<br />
preferred scale, to maintain consistency, the coda magnitude or M C was used in this report except<br />
where noted. The coda magnitude for the 3.9 M L event on August 6, 2007, was 4.5.<br />
Following the August 6, 2007, event, a location was automatically calculated <strong>and</strong> posted on the<br />
UUSS <strong>and</strong> USGS websites. The plotted location was not over the Cr<strong>and</strong>all Canyon <strong>Mine</strong> <strong>and</strong><br />
contributed to speculation that the event was not mining-related.<br />
The location <strong>of</strong> a seismic event is determined by the travel times to each seismograph station <strong>and</strong><br />
the velocity <strong>of</strong> the seismic wave through the earth. The velocity varies with depth. To calculate<br />
locations, a model <strong>of</strong> the velocity at different depths needs to be created. Any difference<br />
between the velocity model <strong>and</strong> actual velocities or lateral non-homogeneity in actual velocities<br />
can result in errors in the location.<br />
Depths <strong>of</strong> the events were difficult to determine due to the distance to the nearest recording<br />
station <strong>and</strong> the shallow depths involved. According to UUSS seismologists, in order to<br />
accurately determine the depth <strong>of</strong> a seismic event, a seismograph station is generally needed at a<br />
distance less than or equal to the depth <strong>of</strong> the event. Because the depth <strong>of</strong> the August 6, 2007,<br />
accident was approximately 2000 feet, <strong>and</strong> the nearest station was approximately 11 miles away,<br />
the initial calculated depths were uncertain.<br />
The UUSS deployed five additional portable units to the site to improve their ability to locate<br />
seismic events. Installation <strong>of</strong> the portable units began on August 7 <strong>and</strong> was completed on<br />
August 9, 2007.<br />
A review <strong>of</strong> the seismic data revealed that several seismic events could be correlated to coal<br />
bursts that were observed underground. Known locations could be used to reduce the effect <strong>of</strong><br />
errors in the velocity model, thus improving the accuracy for locating other events. Therefore,<br />
<strong>MSHA</strong> provided Dr. Pechmann <strong>of</strong> the UUSS with the known location <strong>of</strong> the August 16, 2007,<br />
accident to use as a fixed point to improve the locations for the other events. Two different<br />
methods were used by UUSS to improve the locations.<br />
The first method was the calibrated master event method. In this method, corrections were made<br />
to the arrival times to fit the August 16 event to the known location. For each other event, the<br />
corrections were applied <strong>and</strong> new locations calculated. These corrections were applied to 189<br />
recorded events going back approximately two years to August 2, 2005. This method relocated<br />
the August 6, 2007, event to the North barrier section at approximately crosscut 149.<br />
The second method used by UUSS was the double difference method. This method determines<br />
the relative location between multiple events by minimizing differences between observed <strong>and</strong><br />
theoretical travel times for pairs <strong>of</strong> events at each station. 25 Only 150 <strong>of</strong> the 189 events could be<br />
located using this method. Figure 106 shows the progressively refined locations for four selected<br />
events together with their known locations <strong>and</strong> the calculated locations for the August 6, 2007,<br />
accident. Shown on the figure are the initial st<strong>and</strong>ard locations, the locations as revised by the<br />
N-3
master event method, <strong>and</strong> the locations as revised by the double difference method. As shown<br />
on the figure, the double difference locations match the known locations most closely. The<br />
location for the August 6 accident is given at the No. 3 entry <strong>of</strong> the South Barrier section<br />
between crosscuts 143 <strong>and</strong> 144. The August 6 accident was known to extend over a wide area.<br />
Because locations <strong>of</strong> seismic events are determined by the first arrival <strong>of</strong> the seismic waves, only<br />
the location <strong>of</strong> the initiation <strong>of</strong> the August 6 accident can be calculated. Therefore, the location<br />
shown indicates where the event began, not the center <strong>of</strong> the event.<br />
Figure 106 – Locations <strong>of</strong> Selected Events showing Progressive Refinements Using Three Methods<br />
A review <strong>of</strong> mine records <strong>and</strong> records from the rescue <strong>and</strong> recovery operations revealed that ten<br />
events were both noted underground <strong>and</strong> recorded by the UUSS. Figure 107 shows the high<br />
degree <strong>of</strong> correlation with the underground locations <strong>and</strong> the double difference locations<br />
calculated by the UUSS. This provides some measure <strong>of</strong> the accuracy <strong>of</strong> the locations. Only the<br />
location <strong>of</strong> the August 16, 2007, accident had been provided to the UUSS. Excluding the<br />
August 16 accident event that was used for calibration, the mean distance between the reported<br />
locations <strong>and</strong> calculated locations was 450 feet. The median distance was 421 feet.<br />
N-4
Figure 107 - Observed <strong>and</strong> Calculated Locations for Events<br />
N-5
Figure 108 - Calculated Double Difference Locations <strong>and</strong> the Location <strong>of</strong> Mining Color Coded by Month<br />
N-6
Figure 108 shows all <strong>of</strong> the calculated double difference locations <strong>and</strong> the location <strong>of</strong> mining<br />
activity color coded by month. The symbols are sized according to the coda magnitude <strong>of</strong> the<br />
events. The double difference locations show a high degree <strong>of</strong> correlation with pillar recovery<br />
mining in South Mains <strong>and</strong> the Main West barriers.<br />
Figure 109 shows the seismic location <strong>of</strong> the August 6, 2007, accident in red. The events<br />
occurring after the accident on August 6 <strong>and</strong> 7 are shown in tan. Events occurring on August 8<br />
to 27 inclusive are shown in blue. The locations <strong>of</strong> seismic events occurring on August 6 <strong>and</strong> 7<br />
are notably clustered along a north to south line near crosscut 120 <strong>of</strong> the South Barrier section.<br />
The location corresponds with the outby extent <strong>of</strong> the collapse in the South Barrier section as<br />
determined by underground observation in the South Barrier section entries <strong>and</strong> Main West inby<br />
the breached seal. The seismic events extend from the South Barrier to the North Barrier. The<br />
initiation point for the collapse is located at the western boundary <strong>of</strong> the area. The collapse<br />
would have progressed to the east. The continuing events may have been the result <strong>of</strong> residual<br />
stress at the edge <strong>of</strong> the collapsed area. The events colored in blue occurred later <strong>and</strong> may<br />
represent settling at the west end <strong>of</strong> the collapse area.<br />
Figure 109 – Seismic Location <strong>of</strong> the August 6 Accident <strong>and</strong> Following Events<br />
Analysis <strong>of</strong> the Seismic Event<br />
The ground motions produced by the August 6, 2007, event were recorded on the UUSS<br />
seismographs. Earthquakes produce body <strong>and</strong> surface waves. Body waves travel through the<br />
interior <strong>of</strong> the earth. P-waves or primary waves <strong>and</strong> S-waves or secondary waves are types <strong>of</strong><br />
body waves. P-waves are also known as compressional waves <strong>and</strong> consist <strong>of</strong> particle motion in<br />
N-7
the direction <strong>of</strong> travel. P-waves travel faster than any other type <strong>of</strong> seismic wave <strong>and</strong> are the first<br />
to arrive at a seismograph station after an event.<br />
A typical tectonic earthquake produced by a slip on a fault will result in part <strong>of</strong> the earth being<br />
placed in compression <strong>and</strong> part in dilation. This type <strong>of</strong> movement will typically generate P-<br />
waves with the initial or first motion on a vertical component seismograph in an upward<br />
direction or in compression at some locations <strong>and</strong> P-waves with a downward first motion or<br />
dilatation at other locations.<br />
An analysis <strong>of</strong> the seismograph recordings from the August 6, 2007, event indicated that the<br />
initial or first motion recorded on a vertical component seismograph was downward in all cases<br />
(Pechmann 2008) 2 . This is characteristic <strong>of</strong> a collapse or implosion. Coal mining-related events<br />
are commonly collapse type events where caving or a coal burst has sudden ro<strong>of</strong>-to-floor<br />
convergence. The lack <strong>of</strong> compressional or upward first motions is highly suggestive <strong>of</strong> a<br />
collapse but not conclusive. It may be possible that some upward first motions may have been<br />
missed. Figure 110 is a simplified diagram illustrating the types <strong>of</strong> motions expected for mine<br />
collapse <strong>and</strong> normal-faulting earthquakes.<br />
Figure 110 - P-Wave First Motion Analysis Examples<br />
(from W. Arabasz presentation to Utah Mining Commission, November 2007)<br />
N-8
Figure 111 shows the seismograph stations in place around the mining district as well as seismic<br />
waveforms <strong>of</strong> the vertical component from selected stations for the August 6, 2007, event. The<br />
waveforms are not shown to scale <strong>and</strong> are intended only to illustrate examples <strong>of</strong> first motions.<br />
Figure 111 - Vertical Component Waveform Data for August 6, 2007 Event<br />
The source mechanism <strong>of</strong> a mine collapse involves a change in volume at the source <strong>and</strong> is<br />
unusual compared to fault slip sources where the primary movement is slipping with no change<br />
in volume. These unusual mine collapse occurrences are <strong>of</strong> particular interest to persons<br />
engaged in monitoring to ensure compliance with the nuclear Comprehensive Test Ban Treaty.<br />
Considerable effort has been expended to distinguish man-made events from naturally occurring<br />
tectonic earthquakes.<br />
As early as August 9, 2007, scientists at the University <strong>of</strong> California at Berkley Seismological<br />
Laboratory <strong>and</strong> the Lawrence Livermore National Laboratories studied the data <strong>and</strong> prepared a<br />
report titled “Seismic Moment Tensor <strong>Report</strong> for the 06 Aug 2007, M3.9 Seismic event in central<br />
Utah” that was made available on the UUSS website. A paper based on this analysis titled<br />
“Source Characterization <strong>of</strong> the August 6, 2007 Cr<strong>and</strong>all Canyon <strong>Mine</strong> Seismic Event in Central<br />
Utah” also has been prepared 3 . The techniques employed in this analysis are beyond the scope<br />
<strong>of</strong> this report. However, the results can be summarized by Figure 112, reproduced from their<br />
paper, which shows seismic events plotted according to their source mechanism. The term DC<br />
refers to a double couple <strong>of</strong> forces or opposing forces which create shear or slip type movement<br />
resulting in natural earthquakes with no change in volume. The data for the August 6, 2007<br />
event is shown as the red star. Its location characterizes it as an anti-crack or closing crack. This<br />
N-9
would be consistent with an underground collapse. Natural or tectonic earthquakes plot near the<br />
center <strong>of</strong> this diagram. The orange star represents a natural tectonic earthquake <strong>of</strong> similar size<br />
that occurred on September 1, 2007 near Tremonton, Utah. The August 6 event is clearly<br />
outside this area. The explosion plotted in the figure was a nuclear test explosion. The three<br />
other collapses plotted were two trona mine collapses in Wyoming <strong>and</strong> a collapse <strong>of</strong> an<br />
explosion test cavity.<br />
Figure 112 - Source Type Plot from Ford et al. (2008).<br />
An analysis <strong>of</strong> the source depth for the August 6 event was conducted by Ford et al. (2008)<br />
Different depths for the event were assumed <strong>and</strong> the source type <strong>and</strong> variance reduction were<br />
calculated. Variance reduction is a measure <strong>of</strong> fit; the greater the reduction, the better the fit.<br />
Figure 113 shows the variance reduction results from the analyses in the inset box <strong>and</strong> the source<br />
type for the different assumed depths. As indicated, the shallowest depths (shown in red) result<br />
in the best fit. Even at depths up to 5 km, the source type remains as a closing crack <strong>and</strong> does<br />
not indicate the double-couple mechanism typical <strong>of</strong> natural tectonic earthquakes.<br />
N-10
Figure 113 – Depth Analysis <strong>of</strong> August 6, 2007 event from Ford et al 2008.<br />
Ford et al. (2008) 3 noted that while the primary <strong>and</strong> dominant source mechanism was a closing<br />
crack, the seismic record could not be explained by a pure vertical crack closure alone. Love<br />
waves that have motion horizontal to the direction <strong>of</strong> travel were present <strong>and</strong> can not be<br />
produced by the vertical closure. Possible explanations <strong>of</strong>fered included that the collapse was<br />
uneven or that there was sympathetic shear on a ro<strong>of</strong> fault adding a shear component to the<br />
collapse.<br />
Pechmann et al. (2008) 2 similarly noted that while the event was dominantly implosional, there<br />
was a shear component. The most likely explanation <strong>of</strong>fered was slip on a steeply dipping crack<br />
in the mine ro<strong>of</strong> with a strike <strong>of</strong> approximately 150 degrees <strong>and</strong> motion downward on the east<br />
side.<br />
Given that the event initiated at the west edge <strong>of</strong> the collapse area <strong>and</strong> seismic events occurred in<br />
the following 37 hours at the east edge <strong>of</strong> the collapse area (see Figure 109), the most likely<br />
explanation is that the event began at the western edge <strong>of</strong> the area <strong>and</strong> progressed eastward. The<br />
eastern edge, where the collapsed stopped, would have resulted in residual stress at the<br />
cantilevered edge <strong>and</strong> continued seismic activity.<br />
Additionally, careful examination <strong>of</strong> the seismic waveforms by the UUSS did not reveal any<br />
indication <strong>of</strong> an event immediately preceding the main August 6, 2007 event. There was no<br />
evidence that the collapse was caused by an immediately preceding natural occurring event.<br />
N-11
Duration <strong>of</strong> Seismic Events<br />
It was initially reported in the media <strong>and</strong> by others that the August 6, 2007, event lasted four<br />
minutes. According to UUSS seismologists, the recorded length <strong>of</strong> vibratory motion <strong>of</strong> a<br />
seismograph will be orders <strong>of</strong> magnitude longer than the actual duration <strong>of</strong> the seismic source<br />
event. This is due to the arrival <strong>of</strong> seismic waves from many different <strong>and</strong> indirect paths. For<br />
example, the August 16 event generated one seismic record 63 seconds long 2 when the actual<br />
event was nearly instantaneous.<br />
It is not straight forward to estimate the duration <strong>of</strong> a source event from the seismic record. The<br />
duration <strong>of</strong> the August 6 accident can be estimated by eye witness reports. One witness stated<br />
that the mine <strong>of</strong>fice building shook for several seconds <strong>and</strong> the shaking subsided quickly. None<br />
<strong>of</strong> the smaller events was reported to have any significant duration by underground witnesses.<br />
The building shaking may represent the collapse event <strong>and</strong> residual vibrations. The best estimate<br />
for the duration <strong>of</strong> the August 6, 2007, event is a few seconds.<br />
N-12
Appendix O - Images <strong>of</strong> March 10, 2007, Coal Outburst Accident<br />
North Barrier Section after March 2007 Coal Outburst Accident<br />
The following images were taken on March 16, 2007, during an investigation <strong>of</strong> the March 10,<br />
2007, coal burst by Michael Hardy <strong>and</strong> Leo Gilbride <strong>of</strong> AAI <strong>and</strong> Laine Adair <strong>and</strong> Gary Peacock<br />
<strong>of</strong> GRI. A location diagram was inserted into each photo by the accident investigation team.<br />
The green arrow indicates the camera view point as determined from AAI’s notes.<br />
O-1
O-2
O-3
O-4
O-5
O-6
O-7
O-8
O-9
O-10
O-11
O-12
Appendix P- ARMPS Method Using Barrier Width Modified Based<br />
on Bearing Capacity<br />
To account for the bleeder pillar being used as part <strong>of</strong> the barrier system, the bleeder pillar load<br />
bearing capacity is added to the load bearing capacity <strong>of</strong> the barrier to approximate the total load<br />
bearing capacity <strong>of</strong> the barrier system. This analysis method modifies the barrier width so that<br />
the load bearing capacity is adjusted to include a bleeder pillar. This process addresses those<br />
cases where the section pillar remains alongside the barrier pillar separating Active Gob <strong>and</strong> 1 st<br />
Side Gob. The process involves mathematically modifying the barrier pillar system as outlined<br />
below:<br />
1. Establish input parameters for mining geometry (i.e. overburden, pillar size, mining<br />
height, etc.).<br />
2. Determine conventional stability factors by modeling the section as if all pillars are<br />
extracted. Note the PStF, BPStF, <strong>and</strong> remnant BPStF.<br />
3. Note the load bearing capacity <strong>of</strong> the actual barrier width at the AMZ.<br />
4. Note the load bearing capacity <strong>of</strong> the pillar that will be left alongside the barrier pillar.<br />
5. Determine the equivalent load bearing capacity <strong>of</strong> a modified barrier system with the<br />
following:<br />
Equivalent Barrier<br />
Capacity (tons)<br />
=<br />
Original Barrier<br />
Capacity (tons)<br />
+<br />
Pillar Capacity ( tons)<br />
x AMZ Breath<br />
Pillar Crosscut Center<br />
6. Model the section with an Active Gob as retreating without the unmined section pillar<br />
(pillar line <strong>and</strong> section reduced by one pillar).<br />
7. Modify the barrier width using the input screen, recalculate, <strong>and</strong> check the resultant<br />
barrier Capacity at the AMZ. Continue modifying the barrier width using this iterative<br />
process until the Equivalent Barrier Capacity is achieved.<br />
8. Assign the resultant PStF for the AMZ, BPStF, <strong>and</strong> remnant BPStF as the values for the<br />
section pillars <strong>and</strong> the modified barrier pillar system stability values.<br />
P-1
Appendix Q - Finite Element Analysis <strong>of</strong> Barrier Pillar Mining<br />
at Cr<strong>and</strong>all Canyon <strong>Mine</strong><br />
by<br />
William G. Pariseau<br />
University <strong>of</strong> Utah<br />
Q-1
FINITE ELEMENT ANALYSIS OF BARRIER<br />
PILLAR MINING AT CRANDALL CANYON<br />
Prepared for the <strong>Mine</strong> <strong>Safety</strong> <strong>and</strong> <strong>Health</strong> <strong>Administration</strong><br />
Arlington, Virginia<br />
by<br />
William G. Pariseau<br />
University <strong>of</strong> Utah<br />
Salt Lake City, Utah<br />
May 26, 2008
CONTENTS<br />
INTRODUCTION 1<br />
FORMULATION <strong>of</strong> the PROBLEM 2<br />
<strong>Mine</strong> Geology 3<br />
<strong>Mine</strong> Geometry 5<br />
Premining Stress 7<br />
Rock Properties 7<br />
Mining Sequence 10<br />
Boundary Conditions 10<br />
FINITE ELEMENT ANALYSIS 11<br />
Main Entry Mining 12<br />
Longwall Panel Mining 16<br />
Node Displacements <strong>and</strong> Subsidence<br />
Element <strong>Safety</strong> Factor Distributions<br />
Barrier Pillar Entry Mining 23<br />
North Barrier Pillar Mining<br />
South Barrier Pillar Mining<br />
DISCUSSION 30<br />
CONCLUSION 34<br />
REFERENCES 35
INTRODUCTION<br />
This report discusses finite element analysis <strong>of</strong> mining in barrier pillars at the Cr<strong>and</strong>all<br />
Canyon <strong>Mine</strong> in central Utah. Analyses are two-dimensional <strong>and</strong> represent vertical crosssections<br />
from surface to about 1,000 ft (300m) below the mining horizon, the Hiawatha seam.<br />
The finite element program is UT2. This computer code has been in service for many years <strong>and</strong><br />
well validated through numerous bench-mark comparisons with known problem solutions. UT2<br />
has been used in many rock mechanics studies through the years, most recently in the study <strong>of</strong><br />
inter-panel barrier pillars used in some Utah coal mines.<br />
The study objective is to develop a better underst<strong>and</strong>ing <strong>of</strong> the strata mechanics<br />
associated with recent events (August, 2007) at the Cr<strong>and</strong>all Canyon <strong>Mine</strong>. This mine is in the<br />
Wasatch coal field in central Utah, west <strong>of</strong> Price, Utah. There are three coal seams <strong>of</strong> interest in<br />
the stratigraphic column <strong>of</strong> the Wasatch Plateau, namely the Hiawatha seam <strong>and</strong> the overlying<br />
Cottonwood <strong>and</strong> Blind Canyon seams. Mining is not always feasible in every seam.<br />
The Cr<strong>and</strong>all Canyon property is developed from outcrop, as are almost all coal mines in<br />
Utah. Relief is high in the topography <strong>of</strong> the Wasatch Plateau region; depth <strong>of</strong> overburden<br />
increases rapidly with distance into a mine. Depth to the Hiawatha seam at Cr<strong>and</strong>all Canyon<br />
varies with surface topography <strong>and</strong> ranges roughly between 1,500 <strong>and</strong> 2,000 ft (450 to 600 m).<br />
Thickness is also variable <strong>and</strong> <strong>of</strong> the order <strong>of</strong> 8 ft (2.4 m). Development consists <strong>of</strong> five<br />
nominally 20-ft (6-m) wide main entries separated by 70-ft (21-m) wide pillars driven in an eastwest<br />
direction. Length <strong>of</strong> these main entries is about 17,700 ft (4,210 m). Six longwall panels<br />
were mined on either side <strong>of</strong> the main entries from entry ends near a major fault (Joe’s Valley<br />
1
fault) that strikes in a north-south direction. These panels were roughly 780 ft (234 m) wide by<br />
4,700 ft (1,140 m) long on the north side <strong>of</strong> the main entries <strong>and</strong> 810 ft (243 m) wide by 7,040 ft<br />
(2,112 m) long on the south side. Panels were parallel to the main entries.<br />
FORMULATION OF THE PROBLEM<br />
Finite element analysis is a mature subject <strong>and</strong> a popular method for solving boundary<br />
value problems in the mechanics <strong>of</strong> solids <strong>and</strong> other fields as well [e.g., Zienkiewicz, 1977;<br />
Bathe, 1982; Oden, 1972; Desai <strong>and</strong> Abel, 1972; Cook, 1974]. In stress analysis, equations <strong>of</strong><br />
equilibrium, strain-displacement relationships, <strong>and</strong> stress-strain laws are requirements met under<br />
the constraints <strong>of</strong> tractions <strong>and</strong> displacements specified at the boundaries <strong>of</strong> a region <strong>of</strong> interest.<br />
The method is popular, especially in engineering, because <strong>of</strong> a relative ease <strong>of</strong> implementation<br />
compared with traditional finite difference methods. The method has important advantages in<br />
coping with non-linearity <strong>and</strong> complex geometry.<br />
Finite element analysis <strong>of</strong> mining involves computation <strong>of</strong> stress, strain, <strong>and</strong> displacement<br />
fields induced by excavation. Rock response to an initial application <strong>of</strong> load is considered<br />
elastic. Indeed the elastic material model is perhaps the de facto st<strong>and</strong>ard model in solid<br />
mechanics. However, the range <strong>of</strong> a purely elastic response is limited by material strength.<br />
Beyond the elastic limit, flow <strong>and</strong> fracture occur, collectively, plastic deformation, i.e.,<br />
“yielding”. Although strictly speaking inelastic deformation is elastic-plastic deformation,<br />
“plastic” is used for brevity. Plastic deformation may be time-dependent <strong>and</strong> various<br />
combinations <strong>of</strong> elastic <strong>and</strong> plastic deformation are possible, e.g., elastic-viscoplastic<br />
deformation allows for time-dependent plasticity beyond the elastic limit.<br />
2
Generally, excavation takes place in initially stressed ground, so changes in stress are<br />
computed. When stress changes are added to the initial stresses, post-excavation stresses are<br />
obtained. These stresses may then be used to determine a local factor <strong>of</strong> safety, the ratio <strong>of</strong><br />
strength to stress in an element. A safety factor greater than 1.0 indicates a stress state in the<br />
range <strong>of</strong> a purely elastic response to load. A computed safety factor less than 1.0 indicates stress<br />
beyond the elastic limit, while a safety factor <strong>of</strong> 1.0 is at the elastic limit where further loading<br />
would cause yielding. Unloading from the elastic limit induces an elastic diminution <strong>of</strong> stress.<br />
<strong>Safety</strong> factors less than 1.0 are physically impossible because yielding prevents stress from<br />
exceeding the elastic limit. However, in a purely elastic analysis, computed safety factors may be<br />
less than 1.0.<br />
Elastic analyses <strong>of</strong>fer the important advantages <strong>of</strong> speed <strong>and</strong> simplicity. Although safety<br />
factor distributions based on elastic analysis may differ from elastic-plastic analyses, the<br />
differences are not considered important especially in consideration <strong>of</strong> questions that may arise<br />
about the plastic portion <strong>of</strong> an elastic-plastic material model. Generally, the effect <strong>of</strong> yielding is<br />
to “spread the load” by reducing peak stresses that would otherwise arise while increasing the<br />
region <strong>of</strong> elevated stress.<br />
<strong>Mine</strong> Geology<br />
A drill hole log <strong>of</strong> hole DH-7 was used to define the stratigraphic column at Cr<strong>and</strong>all<br />
Canyon. This hole is centrally located in the area <strong>of</strong> interest. Figure 1 shows a color plot <strong>of</strong> the<br />
stratigraphic column used in subsequent analyses. The Hiawatha seam is the thin gray line at the<br />
1,601 ft (480 m) depth. A thickness <strong>of</strong> 8 ft (3 m) is indicated. Ro<strong>of</strong> <strong>and</strong> floor are s<strong>and</strong>stone.<br />
3
Figure 1. Stratigraphic column, formation names, depths in feet, seam names, <strong>and</strong> thicknesses<br />
(in parentheses in feet). There are 11 layers in the column.<br />
4
<strong>Mine</strong> Geometry<br />
The overall region used for analysis is shown in Figure 2 where the colors correspond to<br />
the same colors <strong>and</strong> rock types shown in the stratigraphic column (Figure 1). Details <strong>of</strong> the main<br />
entry geometry are shown in Figure 3. Elements in the mesh shown in Figures 2 <strong>and</strong> 3 are<br />
approximately 10 ft wide <strong>and</strong> 10 ft high (3.0x3.0 m), except at seam level where element height<br />
is 8 ft (2.4 m). Element size is a compromise between interest in detail at seam level <strong>and</strong> a larger<br />
view <strong>of</strong> panel <strong>and</strong> barrier pillar mining beyond the main entry development.<br />
Figure 2. Overall finite element mesh geometry. There are 172,368 elements <strong>and</strong> 173,283 nodes<br />
in the mesh.<br />
The mine geometry changes with development <strong>of</strong> the main entries <strong>and</strong> subsequent mining<br />
<strong>of</strong> longwall panels parallel to the mains <strong>and</strong> on both sides. Barrier pillars 450 ft (135 m) wide are<br />
left on both sides <strong>of</strong> the main entries as shown near seam level in Figure 4. Only 100 ft (30 m) <strong>of</strong><br />
the future longwall panels are shown in Figure 4. Panels in the analyses are eventually mined<br />
2,600 ft (780 m) on the north <strong>and</strong> south sides <strong>of</strong> the main entries. Panels, barrier pillars, main<br />
entries <strong>and</strong> entry pillars account for the 6,480 ft (1,944 m) wide mesh. Cross-cuts are not<br />
included in two-dimensional analyses.<br />
5
Figure 3. Geometry <strong>of</strong> the main entries. Coal seam elements are 10x8 ft (3.0x2.4 m).<br />
Figure 4. Exp<strong>and</strong>ed view at seam level showing main entries, adjacent barrier pillars, <strong>and</strong> 100 ft<br />
(30 m) <strong>of</strong> future longwall panel excavation.<br />
6
Premining Stress<br />
The premining stress field is associated with gravity loading only. This simple stress<br />
field assumes that the vertical stress before mining is the product <strong>of</strong> average specific weight <strong>of</strong><br />
material times depth, or to a reasonable approximation, 1 psi per foot <strong>of</strong> depth (23 kPa/m <strong>of</strong><br />
depth). Horizontal stresses are equal in all directions <strong>and</strong> are computed as one-fourth <strong>of</strong> the<br />
vertical premining stress. Thus, at the top <strong>of</strong> the Hiawatha seam, the vertical premining stress is<br />
1,601 psi (11.04 MPa) <strong>and</strong> the horizontal stresses are 400 psi (2.76 MPa). Shear stresses relative<br />
to compass coordinates (x=east, y=north, z=up) are nil. Water <strong>and</strong> gas are considered absent, so<br />
these stresses are also the effective stresses before mining. When the depth <strong>of</strong> cover changes, the<br />
premining stresses also change in accordance with the assumed vertical stress gradient <strong>and</strong> ratio<br />
<strong>of</strong> horizontal to vertical premining stress.<br />
Rock Properties<br />
Rock properties <strong>of</strong> importance to the present study are the elastic moduli <strong>and</strong> strengths.<br />
The various strata in the geologic column are assumed to be homogeneous <strong>and</strong> isotropic, so only<br />
two independent elastic properties are required, <strong>and</strong> also only two independent strengths for each<br />
material. Young’s modulus (E) <strong>and</strong> Poisson’s ratio () are the primary elastic properties <strong>and</strong><br />
most easily measured. These properties are shown in Table 1 <strong>and</strong> were adapted from Jones<br />
(1994), Rao (1974), <strong>and</strong> from laboratory tests on core from holes near coal mines in the Book<br />
Cliffs field in central Utah. Unconfined compressive <strong>and</strong> tensile strengths, Co <strong>and</strong> To,<br />
respectively, are the basic strength properties <strong>and</strong> are also shown in Table 1. Other properties<br />
such as shear modulus <strong>and</strong> shear strength may be computed from the properties given in Table 1<br />
on the basis <strong>of</strong> isotropy.<br />
7
Table 1. Rock Properties.<br />
Material<br />
Property<br />
E<br />
6<br />
(10 psi)<br />
C o<br />
3<br />
(10 psi)<br />
T o<br />
2<br />
(10 psi)<br />
1. North Horn Formation 2.6 0.26 11.80 7.0<br />
2. Price River Formation 3.2 0.26 9.98 3.8<br />
3. Castle Gate S<strong>and</strong>stone 3.0 0.22 9.59 4.3<br />
4. S<strong>and</strong>+Siltstone 3.1 0.24 13.50 11.9<br />
5. Blind Canyon Coal 0.43 0.12 4.13 2.8<br />
6. Ro<strong>of</strong>/Floor Siltstone 2.8 0.23 12.18 12.9<br />
7. Cottonwood Coal 0.43 0.12 4.13 2.8<br />
8. Ro<strong>of</strong> S<strong>and</strong>stone 3.4 0.26 14.50 10.9<br />
9. Hiawatha Coal 0.43 0.12 4.13 2.8<br />
10. Floor S<strong>and</strong>stone 3.4 0.26 11.72 11.7<br />
11. Masuk Shale 2.2 0.35 10.30 0.60<br />
Compressive strength <strong>of</strong> rock is generally dependent on confining pressure as shown in<br />
laboratory tests. The well-known Mohr-Coulomb strength criterion is one way <strong>of</strong> expressing<br />
confining pressure dependency. This criterion may be expressed in terms <strong>of</strong> the major <strong>and</strong> minor<br />
principal stress at failure in the form<br />
(1)<br />
where<br />
are the major principal stress, minor principal stress, cohesion <strong>and</strong> angle<br />
<strong>of</strong> internal friction, respectively, <strong>and</strong> compression is positive. The left side <strong>of</strong> (1) is the<br />
maximum shear stress, while the sum <strong>of</strong> the principal stresses on the right side is a mean normal<br />
stress in the plane <strong>of</strong> the major <strong>and</strong> minor principal stresses. Cohesion <strong>and</strong> angle <strong>of</strong> internal<br />
friction may be expressed in terms <strong>of</strong> the unconfined compressive <strong>and</strong> tensile strengths. Thus,<br />
8
(2)<br />
An alternative form <strong>of</strong> (1) that shows the direct dependency <strong>of</strong> compressive strength on confining<br />
pressure is<br />
(3)<br />
where C p <strong>and</strong> p are compressive strength under confining pressure <strong>and</strong> confining pressure,<br />
respectively. Equation (3) has applicability to pillar strength because <strong>of</strong>ten a pillar is much wider<br />
than it is high <strong>and</strong> has a core confined by horizontal stress. The ratio <strong>of</strong> unconfined compressive<br />
strength to tensile strength in (3) is <strong>of</strong>ten 10 or greater <strong>and</strong> thus multiplies the confining pressure<br />
effect by an order <strong>of</strong> magnitude or more.<br />
Often the increase <strong>of</strong> compressive strength with confining pressure is non-linear <strong>and</strong><br />
moreover the intermediate principal stress may influence strength. A criterion that h<strong>and</strong>les both<br />
possibilities is a non-linear form <strong>of</strong> the well-known Drucker-Prager criterion that may be<br />
expressed as<br />
(4)<br />
where compression is positive <strong>and</strong><br />
are second invariant <strong>of</strong> deviatoric stress,<br />
first invariant <strong>of</strong> stress, an exponent, <strong>and</strong> material properties, respectively. The variable J 2 is a<br />
measure <strong>of</strong> shear stress intensity, while I 1 is a measure <strong>of</strong> the mean normal stress that includes the<br />
three principal stresses. The last two, A <strong>and</strong> B, may be expressed in terms <strong>of</strong> the unconfined<br />
compressive <strong>and</strong> tensile strengths, while the exponent (N) is decided upon by test data. A value<br />
9
<strong>of</strong> 1 reduces (4) to the original Drucker-Prager criterion. A value <strong>of</strong> 2 allows for non-linearity<br />
<strong>and</strong> more realistic fits to test data. A value N = 2 is used in this study. The maximum value <strong>of</strong><br />
1/2<br />
J 2 for the given mean normal stress (I 1 / 3) can be extracted from (4). The ratio <strong>of</strong> this<br />
maximum value to the actual value is a factor <strong>of</strong> safety for the considered point. Thus, an<br />
1/2 1/2<br />
element factor <strong>of</strong> safety fs = J 2 (strength) / J 2 (stress). This ratio has an analogy to the ratio <strong>of</strong><br />
shear strength to shear stress. Uniaxial compression <strong>and</strong> tension are special cases included in this<br />
definition <strong>of</strong> element safety factor. Other definitions are certainly possible, but the one described<br />
here is embedded in UT2 <strong>and</strong> serves the important purpose <strong>of</strong> indicating the possibility <strong>of</strong> stress<br />
exceeding strength <strong>and</strong> thus the possibility <strong>of</strong> yielding.<br />
Mining Sequence<br />
The mining sequence involves several stages: (1) excavation <strong>of</strong> the main entries, (2)<br />
excavation <strong>of</strong> panels on either side <strong>of</strong> the main entries, (3) entry excavation in the north barrier<br />
pillar, (4) entry excavation in the south barrier pillar. Main entries are excavated in strata<br />
initially stressed under gravity loading alone. Stress changes induced by mining entries are<br />
added to the initial stresses to obtain the final stresses at the end <strong>of</strong> main entry excavation. These<br />
final stresses are the initial stresses for the next stage <strong>of</strong> excavation (panel mining) <strong>and</strong> so on.<br />
Boundary Conditions<br />
Displacements normal to the sides <strong>and</strong> bottom <strong>of</strong> the mesh shown in Figure 2 are not<br />
allowed, that is, they are fixed at zero. The top surface <strong>of</strong> the mesh is free to move as mining<br />
dictates. Initial conditions are boundary conditions in time. These are the stresses at the start <strong>of</strong><br />
each excavation stage.<br />
10
There is a possibility that computed seam closure, the relative displacement between ro<strong>of</strong><br />
<strong>and</strong> floor, may exceed mining height. This event is physically impossible <strong>and</strong> thus must be<br />
prohibited by appropriate boundary conditions. Because the bottom <strong>of</strong> the mesh is fixed in the<br />
vertical direction, floor heave is somewhat restricted relative to a mesh <strong>of</strong> greater vertical extent.<br />
Ro<strong>of</strong> sag is not restricted, so specification <strong>of</strong> ro<strong>of</strong> sag in an amount that prevents overlap <strong>of</strong> floor<br />
heave is a reasonable physical constraint to impose as an internal boundary condition. Where<br />
overlap <strong>of</strong> ro<strong>of</strong> <strong>and</strong> floor does not occur, no constraint is necessary.<br />
FINITE ELEMENT ANALYSIS<br />
The main results <strong>of</strong> an analysis are stress, strain <strong>and</strong> displacements induced by mining.<br />
Visualization <strong>of</strong> information derived from these basic results assists in underst<strong>and</strong>ing strata<br />
mechanics associated with mining <strong>and</strong> in assessment <strong>of</strong> overall safety <strong>of</strong> a particular mining plan.<br />
Color contours <strong>of</strong> element safety factors are especially helpful. In two-dimensional analyses,<br />
variables such as widths <strong>of</strong> entries, pillars, panels <strong>and</strong> barriers may be changed at will as may<br />
other input data including stratigraphy <strong>and</strong> rock properties. The list <strong>of</strong> parameters is long; a<br />
design parameter study on the computer could be lengthy, indeed. However, in a case study, the<br />
input is fixed <strong>and</strong> thus computation time is greatly reduced. When the stratigraphic column<br />
extends to the surface, subsidence may be extracted from displacement output. If the actual<br />
subsidence pr<strong>of</strong>ile is known, a match between finite element model output <strong>and</strong> mine<br />
measurements may be used to constrain the model in a reasonable manner.<br />
11
Main Entry Mining<br />
Figure 5 shows before <strong>and</strong> after views <strong>of</strong> main entry mining. The “before” view is just<br />
the mesh shown in Figure 3, but to the same scale as the “after” view that shows the distribution<br />
<strong>of</strong> the element safety factors according to the color scale in the figure. The three yellow b<strong>and</strong>s<br />
are coal seams <strong>and</strong> show almost a uniform safety factor <strong>of</strong> 2.7 away from the main entries.<br />
Pillars between the entries <strong>and</strong> ribs <strong>of</strong> the outside entries show a slightly lower safety factor <strong>of</strong><br />
2.2. Ro<strong>of</strong>s <strong>and</strong> floors show much higher safety factors (greater than 4.5) because <strong>of</strong> the greater<br />
strength <strong>of</strong> ro<strong>of</strong> <strong>and</strong> floor strata. Pillar safety factors are with respect to compressive stress as<br />
inspection <strong>of</strong> the stress output file shows. A safety factor <strong>of</strong> 2 to 4 in compression is suggested in<br />
the literature [Obert <strong>and</strong> Duvall 1967], so the main entry system is considered safe.<br />
Stress concentration in great detail is not obtained in this analysis stage because <strong>of</strong> the<br />
relatively coarse mesh that uses 10x8 ft (3.0x2.4m) coal seam elements about an entry 20 ft (6 m)<br />
wide by 8 ft (2.4 m) high. In fact, element stresses are average stresses over the area enclosed by<br />
an element. Stresses in a pillar rib element are average stresses over the 10 ft (3 m) distance into<br />
the rib <strong>and</strong> over the full mining height <strong>of</strong> 8 ft (2.4 m). A highly refined mesh would reveal<br />
details about an entry <strong>and</strong> perhaps compressive stress concentrations enough to cause yielding at<br />
entry ribs <strong>and</strong> tensile stress concentrations possibly high enough to cause ro<strong>of</strong> <strong>and</strong> floor failure.<br />
Such effects would necessarily be localized within about a half-element thickness (5 ft, 1.5 m)<br />
because no failure in ribs, ro<strong>of</strong>, <strong>and</strong> floor is indicated in elements adjacent to the main entries in<br />
Figure 5. Figure 6 shows the distribution <strong>of</strong> vertical <strong>and</strong> horizontal stress across the main entries<br />
<strong>and</strong> pillars. The U-shape pattern is typical <strong>of</strong> vertical stress after mining. The horizontal stress<br />
increases from zero at the ribs with distance into the rib rather rapidly because <strong>of</strong> element size.<br />
12
Figure 5. Element safety factor distribution. (a) before mining main entries, (b) after mining.<br />
13
Figure 6. Stress distribution across the main entries <strong>and</strong> pillars after excavation. Sv=vertical<br />
stress, Sh=horizontal stress. Dashed lines are premining values.<br />
The average vertical stress in each pillar in Figure 6 is shown by the horizontal lines<br />
labeled P1, P2, P3, <strong>and</strong> P4. These values are obtained from the finite element analysis <strong>and</strong> have<br />
an overall average <strong>of</strong> 2,021 psi (13.9 MPa). A tributary area or extraction ratio calculation gives<br />
a slightly higher average <strong>of</strong> 2,057 psi (14.2 MPa) because <strong>of</strong> the assumption <strong>of</strong> an infinitely long<br />
row <strong>of</strong> entries <strong>and</strong> pillars. The average vertical pillar stress is well below the unconfined<br />
compressive strength <strong>of</strong> coal. In fact, the ratio <strong>of</strong> strength to average vertical stress is a safety<br />
factor <strong>of</strong> sorts with a value <strong>of</strong> 2.0. Because the vertical stress varies across a pillar <strong>and</strong> horizontal<br />
stress increases confinement with distance into a pillar, the local element safety factor varies<br />
14
through a pillar. This variation is shown in Figure 7 where data are from finite element results<br />
<strong>and</strong> the local factor <strong>of</strong> safety (fs) is based on the formulation used in UT2. Also shown in Figure<br />
7 is a normalized vertical stress obtained by dividing the post-mining vertical stress (Sv) by the<br />
premining vertical stress (So), in essence, a stress concentration factor for vertical stress. The<br />
local safety factor is least at the pillar ribs where confinement is nil <strong>and</strong> vertical stress is high <strong>and</strong><br />
greatest at the core <strong>of</strong> the pillar where confinement is high <strong>and</strong> vertical stress is less concentrated<br />
than at the rib. The close agreement between the tributary area calculation <strong>of</strong> vertical pillar stress<br />
after mining <strong>and</strong> the finite element results provides a check on the finite element analysis.<br />
Figure 7. Pillar safety factor distribution from UT2 data <strong>and</strong> normalized vertical stress across the<br />
main entries <strong>and</strong> pillars.<br />
15
Longwall Panel Mining<br />
Six longwall panels were mined on the north <strong>and</strong> south sides <strong>of</strong> the main entries that were<br />
excavated in an east-west direction. For the most part, two panel entries were used for<br />
development. The chain pillars <strong>of</strong> the panel entries undoubtedly are lost as a panel is mined <strong>and</strong><br />
are not considered in analysis <strong>of</strong> panel excavation effects on the main entries. Six panels<br />
approximately 780 ft to 810 ft (234 m to 243 m) wide were excavated on each side <strong>of</strong> the main<br />
entries. Barrier pillars approximately 450 ft (135 m) wide separate the nearest <strong>of</strong> these panels<br />
from the main entries. In the second stage <strong>of</strong> finite element analysis, panel mining extends 2,600<br />
ft (780 m) on each side <strong>of</strong> the barrier pillars. The geometry <strong>of</strong> this stage <strong>of</strong> analysis is shown in<br />
Figures 2, 3, <strong>and</strong> 4.<br />
Node Displacements <strong>and</strong> Subsidence. The first analysis <strong>of</strong> panel mining was only partially<br />
successful. While the solution process proceeded monotonically <strong>and</strong> convergence was excellent,<br />
ro<strong>of</strong> <strong>and</strong> floor displacements over the central portions <strong>of</strong> the excavated panels indicated seam<br />
closure greater than seam thickness, a physical impossibility. A correction was applied in the<br />
second analysis that prevented excess seam closure. In this analysis, seam closure was set in a<br />
way that allowed maximum surface subsidence over the panel centers to approximate observed<br />
surface subsidence while preventing ro<strong>of</strong>-floor overlap. Thus, seam level ro<strong>of</strong> sag was restricted<br />
over the horizontal length <strong>of</strong> 1,300 ft (390 m) from panel centers (mesh sides). No restrictions<br />
on floor heave were imposed. Subsidence pr<strong>of</strong>iles across panels 13 through 17 on the south side<br />
<strong>of</strong> the main entries that were plotted for the years 1999 through 2002 indicated formation <strong>of</strong> a flat<br />
subsidence trough with about 5 ft (1.5 m) <strong>of</strong> surface subsidence.<br />
16
Figure 8a shows displacements in the form <strong>of</strong> a deformed mesh after a second attempt at<br />
panel mining. The displacement scale is exaggerated relative to the distance scale in order to<br />
visualize the overall displacement pattern. Maximum displacement <strong>of</strong> 63 inches or about 5 ft<br />
(160 cm or about 1.5 m) occurs at the mesh sides, that is, over the centers <strong>of</strong> panel mining.<br />
Interestingly, 18 inches (46 cm) <strong>of</strong> subsidence occurs over the center <strong>of</strong> the main entries. Floor<br />
heave (upward displacement) is also maximum at the mesh sides but diminishes with distance to<br />
the main entries. At 130 ft (39 m) from the outside barrier pillar ribs, floor heave diminishes to<br />
zero. With further distance from the mesh sides towards the mesh center <strong>and</strong> center <strong>of</strong> the main<br />
entries, floor displacement is downwards indicating that the barrier pillars <strong>and</strong> entry pillars<br />
depress the floor under the weight transferred from panel mining. Figure 8b is a close up view <strong>of</strong><br />
the deformed mesh about the main entries <strong>and</strong> only hints at entry ro<strong>of</strong> sag <strong>and</strong> floor rise. The<br />
rough agreement between maximum subsidence obtained from finite element analysis <strong>and</strong> that<br />
observed in actual subsidence pr<strong>of</strong>iles, although indirectly imposed through seam closure,<br />
suggests the finite element model <strong>of</strong> panel mining is reasonable.<br />
17
Figure 8. Displacements after panel <strong>and</strong> entry mining. (a) overall, (b) entries.<br />
18
Element <strong>Safety</strong> Factor Distributions. Element safety factor distributions reveal at a glance areas<br />
that have reached the elastic limit <strong>and</strong> are therefore subject to yielding <strong>and</strong> areas well below the<br />
elastic limit <strong>and</strong> <strong>of</strong> much less concern. <strong>Safety</strong> <strong>and</strong> stability <strong>of</strong> an entry surrounded by an<br />
extensive zone <strong>of</strong> yielding would surely be threatened. A pillar with all elements stressed beyond<br />
the elastic limit would also be <strong>of</strong> great concern. Absence <strong>of</strong> extensive zones <strong>of</strong> yielding would<br />
be reassuring.<br />
Figure 9 shows the overall distribution <strong>of</strong> element safety factors in two ways, one without<br />
contours that supplement the color coding <strong>and</strong> one with contours. The seemingly faded color is a<br />
result <strong>of</strong> the plot density that brings white element borders into close proximity <strong>and</strong> allows only a<br />
tiny area for coloring. The jumps in contours occur across strata interfaces where discontinuities<br />
in material properties occur. Disruption <strong>of</strong> contours occurs at seam level across portions <strong>of</strong> the<br />
seam that have been excavated (panels <strong>and</strong> entries). Symmetry <strong>of</strong> the contour pattern is apparent<br />
<strong>and</strong> as the pattern should be. The dark (black) regions <strong>of</strong> yielding are extensive. Near the<br />
surface above the main entries strata flexure leads to tensile failure. Much <strong>of</strong> the ro<strong>of</strong> <strong>and</strong> floor<br />
yield is also tensile.<br />
An exp<strong>and</strong>ed half-mesh view is shown in Figure 10 where the yield zones are more<br />
clearly seen. Strata flexure in tension <strong>and</strong> failure is indicated near seam level in the ro<strong>of</strong> outside<br />
the barrier pillar rib. Floor failure below is also evident in Figure 10. Interestingly, yielding is<br />
small in the immediate s<strong>and</strong>stone floor, but is extensive in the Masuk shale below.<br />
19
Figure 9. Whole mesh element safety factor distributions. (a) without line contours, (b) with.<br />
20
Figure 10. A half-mesh view <strong>of</strong> element safety factors showing dark (black) zones <strong>of</strong> yielding<br />
mainly in horizontal tension associated with strata flexure.<br />
Yielding under high compressive stress penetrates the barrier pillar from the panel side a<br />
distance <strong>of</strong> 110 ft (33 m). Thus, about 25% <strong>of</strong> the barrier yields after panel excavation. This<br />
penetration is accompanied graphically by large horizontal excursions <strong>of</strong> the safety factor contour<br />
lines in Figure 11 which shows details <strong>of</strong> the element safety factor distribution in the vicinity <strong>of</strong> a<br />
barrier pillar. Half <strong>of</strong> the main entries are included in Figure 11. The remainder <strong>of</strong> the barrier<br />
pillar while not yielding is highly stressed with element safety factors no greater than 1.34.<br />
Yielding in the two overlying coal seams is evident in a region above the barrier pillar.<br />
21
Figure 11. Element safety factors about a barrier pillar after panel mining.<br />
Details <strong>of</strong> the element safety factor distribution about the main entries is shown in Figure<br />
12. The pink <strong>and</strong> red zones indicate relatively low safety factors. The highest safety factor in the<br />
main entry pillars is 1.34, the same peak value in the barrier pillars on either side <strong>of</strong> the main<br />
entries. Thus, all pillar element safety factors are less than the minimum <strong>of</strong> 2 recommended by<br />
Obert <strong>and</strong> Duvall (1967). Ro<strong>of</strong> <strong>and</strong> floor safety factors are in the 4 to 5 range. Although mesh<br />
refinement would lead to lower safety factors at the ro<strong>of</strong> <strong>and</strong> floor <strong>of</strong> an entry, there appears to be<br />
no significant threat to ro<strong>of</strong> <strong>and</strong> floor safety at this stage <strong>of</strong> mining.<br />
22
Figure 12. Distribution <strong>of</strong> element safety factors about the main entries after panel mining.<br />
Barrier Pillar Entry Mining<br />
Barrier pillar entry mining in the analysis consists <strong>of</strong> four entries 20 ft (6 m) wide<br />
separated by pillars 60 ft (18 m) wide. Two sets <strong>of</strong> such entries were mined, one on the north<br />
side <strong>and</strong> one on the south side <strong>of</strong> the original main entries. The north side barrier pillar entries<br />
were separated from the north side longwall panels by a pillar 140 ft (42 m) wide <strong>and</strong> from the<br />
main entries by a pillar 50 ft (15 m) wide. The south side barrier pillar entries were separated<br />
from the south side longwall panels by a 120 ft (36 m) wide pillar <strong>and</strong> from the original main<br />
entries by a 70 ft (21 m) pillar. These dimensions were estimated using the distance function in a<br />
drawing <strong>of</strong> the mine geometry. Without doubt, the as-mined dimensions differ from these<br />
23
nominal dimensions. Provided such dimensional differences are small, finite element results<br />
should differ only slightly as well <strong>and</strong> not affect inferences from analysis results concerning<br />
overall safety <strong>of</strong> the mining plan.<br />
North Barrier Pillar Mining. The third stage <strong>of</strong> analysis follows the first <strong>and</strong> second stages <strong>of</strong><br />
main entry development <strong>and</strong> panel mining. This stage involves further entry <strong>and</strong> pillar<br />
development in the north barrier pillar. Mining geometry is illustrated in Figure 13 <strong>and</strong> shows<br />
four additional entries <strong>and</strong> associated pillars. Only 100 ft (30 m) <strong>of</strong> the 2,600 ft (780 m) <strong>of</strong> prior<br />
panel mining is shown in Figure 13. Mining height is 8 ft (2.4 m) as before.<br />
Figure 13. North barrier pillar entry geometry.<br />
The distribution <strong>of</strong> element safety factors after entry development in the north barrier<br />
pillar is shown in Figure 14. Most elements in the north side barrier pillar are now at yield. Rib<br />
elements in pillars adjacent to the original main entries are also at yield. The outside entry <strong>of</strong> the<br />
original main entries shows ribs yielding in the pillar between it <strong>and</strong> the new north side barrier<br />
pillar entry. The south outside entry ribs shows yielding extending 10 ft (3 m) into the ribs. The<br />
highest safety factor in any pillar element in Figure 14 is 1.2.<br />
24
Figure 14. Element safety distribution after entry development in the north barrier pillar.<br />
South Barrier Pillar Mining. The fourth <strong>and</strong> last stage <strong>of</strong> analysis is entry development in the<br />
south barrier pillar <strong>and</strong> follows entry development in the north barrier pillar. Mining geometry is<br />
illustrated in Figure 15 <strong>and</strong> shows four additional entries <strong>and</strong> associated pillars in the south<br />
barrier pillar. Only 100 ft (30 m) <strong>of</strong> prior panel mining is shown in Figure 15. Mining height is<br />
8 ft (2.4 m). Entry <strong>and</strong> pillar widths in the south barrier pillar development are 20 ft (6 m) <strong>and</strong> 60<br />
ft (18 m), respectively. Four additional entries are developed in the south barrier pillar.<br />
Figure 15. South barrier pillar mining geometry.<br />
25
The distribution <strong>of</strong> element safety factors after entry development in the south barrier<br />
pillar is shown in Figure 16. Almost all elements in the south side barrier pillar are now at yield.<br />
Indeed all pillar elements across the mining horizon are close to yield. Peak vertical stress in the<br />
barrier pillars exceeds 38,400 psi (264.8 MPa), over 9 times the unconfined compressive strength<br />
<strong>of</strong> the coal. Horizontal stress exceeds 7,300 psi (50.3 MPa). Even so this high confining<br />
pressure is insufficient to prevent yielding. The lowest vertical pillar stress is about 6,000 psi<br />
(41.4 MPa), almost half again greater than the unconfined compressive strength <strong>of</strong> the coal; the<br />
lowest horizontal pillar stress is about 1,500 psi (10.3 MPa). Any release <strong>of</strong> horizontal<br />
confinement would likely result in rapid destruction <strong>of</strong> pillars. Additionally, entries nearest to<br />
the mined panels are showing reduced ro<strong>of</strong> <strong>and</strong> floor safety factors. Yield zones extend to depth<br />
in the floor. Overlying coal seams are also yielding or are very close to yielding over portions <strong>of</strong><br />
the barrier pillars, as seen in Figure 16.<br />
Figure 16. Element safety distribution after entry development in the south barrier pillar.<br />
26
Figure 17 shows the distribution <strong>of</strong> element safety factors about the original main entries<br />
after entry mining in the north <strong>and</strong> south barrier pillars. Ro<strong>of</strong> <strong>and</strong> floor element safety factors<br />
have decreased significantly from the original values obtained during development prior to<br />
longwall panel mining <strong>and</strong> range between 2 <strong>and</strong> 4, as seen in the color code. Ro<strong>of</strong> <strong>and</strong> floor<br />
element safety factors about the new entries mined in the barrier pillars are lower, roughly in the<br />
range <strong>of</strong> 2 to 4 in Figure 17.<br />
Figure 17. Distribution <strong>of</strong> element safety factors about the original main entries after<br />
development in the north <strong>and</strong> south barrier pillars.<br />
The distribution <strong>of</strong> horizontal <strong>and</strong> vertical element stresses after main entry development,<br />
panel mining, <strong>and</strong> entry development in the north <strong>and</strong> south barrier pillars is shown in Figure 18<br />
where gaps are entry elements. The very high vertical stresses on the ribs <strong>of</strong> the barrier pillars<br />
27
adjacent to the panels mined north <strong>and</strong> south <strong>of</strong> the barrier pillars is striking. Although these<br />
extreme peaks in vertical stress diminish rapidly across the pillars, they remain well above the<br />
unconfined compressive strength <strong>of</strong> the coal, also shown in Figure 18. Recall the analysis is<br />
elastic. If yielding were allowed as in an elastic-plastic analysis, these peaks would diminish <strong>and</strong><br />
the extent <strong>of</strong> yielding would likely spread across regions <strong>of</strong> the pillars that have not yielded<br />
according to the elastic results. Horizontal confinement in rib elements at the ribs <strong>of</strong> the barrier<br />
pillars, where the vertical stress is high, is because <strong>of</strong> averaging over the width <strong>of</strong> rib elements.<br />
The actual horizontal stress at the rib must be zero. The high analysis value is associated with<br />
mesh refinement <strong>and</strong> the use <strong>of</strong> a 10 ft (3 m) wide element. A lower horizontal stress would<br />
enhance the spread <strong>of</strong> pillar yielding. Again, purely elastic behavior leads to an underestimate <strong>of</strong><br />
the extent <strong>of</strong> yielding that is indicated by elements with a safety factor less than one.<br />
A tributary area calculation <strong>of</strong> the average pillar stress across the entire seam is also<br />
shown in Figure 18 as is the finite element analysis result. These two values agree within one<br />
percent <strong>and</strong> lend credence to the analysis. In essence, the calculation shows that the requirement<br />
for equilibrium <strong>of</strong> stress in the vertical direction is satisfied in the course <strong>of</strong> four stages <strong>of</strong><br />
mining. Any analysis result, regardless <strong>of</strong> method, should meet this requirement.<br />
Figure 19 shows the distribution <strong>of</strong> element safety factors at seam level. <strong>Safety</strong> factors<br />
less than one are a consequence <strong>of</strong> a purely elastic calculation. <strong>Safety</strong> factors less than one<br />
indicate a potential for shedding stress to adjacent elements.<br />
28
Figure 18. Post-excavation pillar stress distribution. Sv=premining vertical stress. Sp=average<br />
pillar stress, fem=finite element method, trib=tributary area, Co=unconfined compressive<br />
strength.<br />
Figure 19. Post-excavation element safety factor distribution.<br />
29
DISCUSSION<br />
Several questions that <strong>of</strong>ten arise about finite element analysis involve input data, twodimensional<br />
analysis, <strong>and</strong> interpretation <strong>of</strong> output results. A brief discussion <strong>of</strong> these questions<br />
may not alleviate concerns, but does allow for some explanation <strong>and</strong> expression <strong>of</strong> opinion.<br />
The first issue here is the proverbial one about quality <strong>of</strong> input data <strong>and</strong> consequences for<br />
output results. In fact, this question is present in all engineering analysis <strong>and</strong> is not unique to the<br />
finite element method or other computer-based models for stress analysis or for the analysis <strong>of</strong><br />
business plans <strong>and</strong> so forth. Generally, the problem <strong>of</strong> mine excavation using UT2 is a wellposed<br />
mathematical problem in solid mechanics, so small variations in input data lead to only<br />
small variations in output. However, if there are errors in input, then the output will also be<br />
erroneous. For this reason, checks on results are important when available. An extraction ratio<br />
calculation after main entry excavation indicates reliable output at this stage <strong>of</strong> analysis.<br />
Subsidence results in agreement with mine observations, although indirectly imposed, also<br />
indicate reliable output.<br />
Another question is the use <strong>of</strong> two-dimensional analyses in a three-dimensional world <strong>of</strong><br />
underground coal mining. Here the long drive <strong>of</strong> main entries, over three miles, <strong>and</strong> the<br />
extensive mining on both sides <strong>of</strong> the main entries suggests a tunnel-like geometry amenable to<br />
two-dimensional analysis in a vertical cross-section. Depth varies over the main entries because<br />
<strong>of</strong> topography <strong>and</strong> certainly influences analysis results because greater depth is associated with<br />
higher premining stress. Depths ranged to 2,000 ft (600 m) or more. A depth <strong>of</strong> 1,601 ft (480 m)<br />
used in the analyses here is therefore relatively shallow. For this reason, any adverse results<br />
30
would be <strong>of</strong> even more concern at greater depth. Thus, an optimistic view is taken using a<br />
relatively shallow depth.<br />
Another question concerns the role <strong>of</strong> cross-cuts that are not seen in a vertical section<br />
across the mains <strong>and</strong> through the pillars between entries. The effect is to produce an optimistic<br />
or lower stress in pillars because the additional load transferred to pillars from cross-cuts is not<br />
taken into account. An adjustment can be made to increase pillar load (Pariseau, 1981) but this<br />
was not done for the sake <strong>of</strong> analysis clarity. Cross-cuts also lead to greater ro<strong>of</strong> spans at entry<br />
intersections with cross-cuts <strong>and</strong> thus more complex strata flexure in ro<strong>of</strong> <strong>and</strong> floor, but again<br />
this complication was avoided with error on the side <strong>of</strong> optimism. A threat to ro<strong>of</strong> or floor safety<br />
in two-dimensional analysis would indicate a greater threat in a three-dimensional analysis.<br />
Mesh refinement is always a question <strong>of</strong> interest in any numerical analysis <strong>of</strong> stress.<br />
Large elements average out stress <strong>and</strong> may mask yielding that would be observed with smaller<br />
elements. Large is relative to excavation size. Tabular excavations are very wide compared to<br />
height <strong>and</strong> thus represent a challenge for numerical analysis. A compromise is always necessary<br />
between desire for detail <strong>and</strong> problem size <strong>and</strong> run time limitations. In any case, a coarse mesh<br />
results in optimistic output, lower element stresses <strong>and</strong> also lower displacements. For example, a<br />
ro<strong>of</strong> element 10x10 ft (3.0x3.0 m) over a 20-ft (6 m) wide entry would certainly mask stress<br />
concentration in the ro<strong>of</strong> compared with ro<strong>of</strong> elements 1x1 ft (0.3x0.3 m). However, 100 more<br />
small elements per large element would be required. If this requirement were extended over the<br />
mesh used, more than 17 million elements would be needed, an impractical number for<br />
engineering applications.<br />
31
A more subtle question that arises in “stress analysis” concerns material behavior. A<br />
closely related question concerns relationships between laboratory <strong>and</strong> mine scale rock<br />
properties. These questions are <strong>of</strong> much interest in rock mechanics research for which there is no<br />
general consensus <strong>and</strong> that are well-beyond the scope <strong>of</strong> this report. An elastic material model<br />
was used here as were laboratory rock properties. Strengths were used to compute the limit to a<br />
purely elastic response <strong>and</strong> element safety factors. Generally, rock masses contain discontinuities<br />
such as joints <strong>and</strong> cleats that are absent in laboratory-scale test specimens. Consequently, rock<br />
masses tend to be weaker <strong>and</strong> more compliant than laboratory test results would indicate. The<br />
result is an optimistic analysis <strong>of</strong> stress because the higher laboratory moduli <strong>and</strong> strengths used<br />
lead to smaller displacements <strong>and</strong> less yielding. If an adverse result is observed using rock<br />
properties from laboratory tests, results for the mine would likely be worse.<br />
Inelastic behavior <strong>of</strong> rock under low confinement is likely to be “brittle” with inelasticity<br />
appearing in the form <strong>of</strong> cracking or “damage”. A falling compressive stress-strain curve is <strong>of</strong>ten<br />
observed in the laboratory in tests under displacement control past the peak <strong>of</strong> the curve.<br />
Without displacement control, fast, violent failure <strong>of</strong> the test specimen is likely. While a rising<br />
stress-strain curve beyond the elastic limit is strain-hardening, a falling curve indicates “strains<strong>of</strong>tening”.<br />
The first is intrinsically stable, while the latter is unstable. Introduction <strong>of</strong> strains<strong>of</strong>tening<br />
is likely to make a potentially adverse situation, say, with respect to pillar stress, a<br />
catastrophic case. Again, a purely elastic model is optimistic because <strong>of</strong> the avoidance <strong>of</strong><br />
complex inelastic behavior that may lead to catastrophic failures.<br />
32
A potentially important inelastic effect absent in elastic analyses is “caving”. Caving<br />
over longwall panels is considered to relieve load on shield supports at the face <strong>and</strong> on chain<br />
pillars in panel entries because the length <strong>of</strong> a cantilever ro<strong>of</strong> beam immediately above the<br />
supports is shortened by tensile failure <strong>and</strong> thus reduces “weight” on the supports. Caving<br />
certainly occurs over longwall panels. How high into the remote ro<strong>of</strong> caving propagates is an<br />
open question that is sometimes addressed by rules <strong>of</strong> thumb or experience in a particular mining<br />
district. Strata flexure still occurs above the caved zone <strong>and</strong> transfers load to pillars remaining.<br />
Thick, massive s<strong>and</strong>stones in ro<strong>of</strong> <strong>and</strong> floor may transfer load over large spans <strong>and</strong> if failure<br />
ensues, large scale collapse is possible. However, reliable caving models, those that initiate <strong>and</strong><br />
propagate caving from first principals, are not available, <strong>and</strong> thus, the question <strong>of</strong> caving effects<br />
is left open.<br />
CONCLUSION<br />
Finite element analysis <strong>of</strong> barrier pillar mining at Cr<strong>and</strong>all Canyon indicates a decidedly<br />
unsafe, unstable situation in the making. This conclusion is based on a two-dimensional elastic<br />
analysis <strong>of</strong> a vertical section transverse to the main entries <strong>and</strong> parallel longwall panels outside <strong>of</strong><br />
barrier pillars adjacent to the main entries. Elasticity is the de facto st<strong>and</strong>ard model for<br />
engineering design <strong>of</strong> bridges, skyscrapers, concrete dams <strong>and</strong> similar structures throughout the<br />
world. Approximations in the analyses here are generally on the optimistic side, so that an<br />
adverse situation evident in output data is likely to be worse. For example, complications such as<br />
damage in pillar ribs from locally high stress concentration is ignored. Another example is the<br />
neglect <strong>of</strong> load transfer to pillars from cross-cut excavation that would be in addition to load<br />
transfer associated with entry excavation. A relatively shallow depth <strong>of</strong> 1,601 ft (480 m) was<br />
33
used; actual depth ranges to 2,000 ft (600 m). No pillar extraction was considered after entry<br />
development in the barrier pillars. Transfer <strong>of</strong> load to the remaining pillars during pillar mining<br />
in the barrier pillars would increase stress about the entries <strong>and</strong> remaining pillars as would<br />
consideration <strong>of</strong> greater depth. Both increase outby the considered analysis section.<br />
Elastic behavior is optimistic because stress may exceed strength in a purely elastic<br />
analysis. Thus, if an unsafe condition is inferred from results <strong>of</strong> an elastic analysis, then caution<br />
is certainly indicated. In an elastic-plastic analysis, stresses above strength are relieved by<br />
fracture <strong>and</strong> flow <strong>of</strong> ground (“yielding”). Reduction <strong>of</strong> peak stress by yielding is likely to cause<br />
the zone <strong>of</strong> fracture <strong>and</strong> flow (yield zone) to spread to adjacent ground. Yielding by fracture is<br />
accompanied by a sudden loss <strong>of</strong> strength <strong>and</strong> is associated with fast failure. Glass breakage is<br />
an example <strong>of</strong> fast failure. Yielding by flow may also be accompanied by reduction in strength<br />
(“strain s<strong>of</strong>tening”) which is also unstable <strong>and</strong> may to lead to fast failure.<br />
However, yielding by flow may also be slow as loss <strong>of</strong> strength occurs in time.<br />
Unfortunately, time effects in strata mechanics are not well understood. Creep, that is, timedependent<br />
flow, to failure may occur in a matter <strong>of</strong> minutes, hours, or years. Elasticity may also<br />
be delayed, that is, strain may not occur instantaneously with stress. In this regard, there are<br />
many mathematical models <strong>of</strong> time-dependent (rheological) material behavior available for<br />
analysis, but reliable calculations for engineering design are problematic. Successful forecasts <strong>of</strong><br />
time to failure in rock mechanics are rare, if they exist at all. In any event, long-term strength is<br />
less than short term strength (determined by laboratory tests) used in elastic analysis here. Again,<br />
elastic analysis is optimistic because <strong>of</strong> the use <strong>of</strong> higher strength.<br />
34
A multi-stage mining sequence was followed in the analysis here. Main entries were<br />
mined first. A tributary area check on pillar stress confirmed finite element results. Entry ro<strong>of</strong>s,<br />
pillars, <strong>and</strong> floors were well within the elastic limit; no yielding was indicated.<br />
Panel mining on both sides <strong>of</strong> the main entries was done next. During this stage,<br />
displacements were constrained in the finite element model to prevent physically impossible<br />
overlap <strong>of</strong> ro<strong>of</strong> <strong>and</strong> floor strata at seam level during the panel mining stage. This constraint<br />
assisted in achieving reasonable agreement between measured subsidence <strong>and</strong> finite element<br />
results. Results indicated 25% <strong>of</strong> the barrier pillars yielded, while the remaining portions were<br />
near yield. Entry pillar safety factors decreased significantly to 1.3; ro<strong>of</strong> <strong>and</strong> floor safety factors<br />
also decreased but remained in the elastic domain.<br />
Entry mining in the north barrier pillar led to yielding <strong>of</strong> the remaining portion <strong>of</strong> this<br />
pillar <strong>and</strong> a significant penetration <strong>of</strong> yielding into the south barrier pillar. The highest safety<br />
factor in any pillar, including main entry pillars was 1.2; the lowest was 0.4. Subsequent entry<br />
development in the south barrier caused further yielding. The greatest vertical stress in a rib<br />
element was more than nine times the unconfined compressive strength <strong>of</strong> coal. Extensive zones<br />
<strong>of</strong> strata flexure <strong>and</strong> tensile yielding were observed in ro<strong>of</strong> <strong>and</strong> floor. A tributary area<br />
calculation <strong>of</strong> average vertical stress at the conclusion <strong>of</strong> the last mining stage showed close<br />
agreement with finite element results.<br />
The large excess <strong>of</strong> vertical rib stress over strength indicates a potential for rapid<br />
destruction <strong>of</strong> the rib with expulsion <strong>of</strong> the broken coal into the adjacent entry. The presence <strong>of</strong><br />
35
thick, strong s<strong>and</strong>stone in ro<strong>of</strong> <strong>and</strong> floor strata would reinforce this expectation. The broken coal<br />
could fill the entry <strong>and</strong> perhaps restore some horizontal confinement. If a bulking porosity <strong>of</strong><br />
0.25 is assumed, then rib failure would extend 60 ft (18 m) into a rib. The extent <strong>of</strong> failure into a<br />
single rib would be less, if both entry ribs failed. Photographs show entries partially filled with<br />
broken coal under intact ro<strong>of</strong>. If bottom coal were left, then floor heave could occur, <strong>and</strong><br />
similarly, if top coal were left. Failure <strong>of</strong> either top or bottom coal is a release mechanism <strong>of</strong><br />
horizontal confinement. Another expectation <strong>of</strong> large, horizontal motion <strong>of</strong> rib coal into entries<br />
would be evidence <strong>of</strong> shear slip at contacts between ro<strong>of</strong> <strong>and</strong> floor s<strong>and</strong>stones, perhaps in the<br />
form <strong>of</strong> “fault” gouge, that is, finely pulverized coal.<br />
In the opinion <strong>of</strong> the writer, were these finite element model results available in advance,<br />
mining in barrier pillars at Cr<strong>and</strong>all Canyon would not be justified.<br />
REFERENCES<br />
Bathe, K.-L., (1982) Finite Element Procedures in Engineering Analysis. Englewood Cliffs, N.<br />
J., Prentice-Hall, pp 735.<br />
Desai, C. S., <strong>and</strong> J. F. Abel (1972) Introduction to the Finite Element Method for Engineering<br />
Analysis. Van Nostr<strong>and</strong> Reinhold Co., N. Y., pp 477.<br />
Cook, R. D. (1972) Concepts <strong>and</strong> Applications <strong>of</strong> Finite Element Analysis. John Wiley & Sons,<br />
Inc., N. Y., pp 402.<br />
Jones, R. E. (1994) Investigation <strong>of</strong> S<strong>and</strong>stone Escarpment Stability in the Vicinity <strong>of</strong> Longwall<br />
Mining Operations. M. S. Thesis, Department <strong>of</strong> Mining Engineering, University <strong>of</strong> Utah.<br />
Obert, L. <strong>and</strong> W. I. Duvall (1967) Rock Mechanics <strong>and</strong> the Design <strong>of</strong> Structures in Rock. John<br />
Wiley & Sons, Inc., N. Y., pg 490.<br />
Oden, J. T. (1972) Finite Elements <strong>of</strong> Nonlinear Continua. N.Y., McGraw-Hill, pp 432.<br />
36
Pariseau, W. G. (1981) Inexpensive but Technically Sound <strong>Mine</strong> Pillar Design Analysis. Intl. J.<br />
for Numerical <strong>and</strong> Analytical Methods in Geomechanics. Vol. 5, No. 4, pg 429-447.<br />
Pariseau, W. G. (2007) Finite Element Analysis <strong>of</strong> Inter-Panel Barrier Pillar Width at the<br />
Aberdeen (Tower) <strong>Mine</strong>. Department <strong>of</strong> Mining Engineering, University <strong>of</strong> Utah <strong>and</strong> Bureau <strong>of</strong><br />
L<strong>and</strong> Management, Salt Lake City, Utah.<br />
Rao, T. V. (1974) Two Dimensional Stability Evaluation <strong>of</strong> a Single Entry Longwall Mining<br />
System. M. S. Thesis, Department <strong>of</strong> Mining Engineering, University <strong>of</strong> Utah.<br />
rd<br />
Zienkiewicz, O. C. (1977) The Finite Element Method (3 ed). N. Y., McGraw-Hill, pp 787.<br />
37
Appendix R - Description <strong>of</strong> BEM Numerical Models<br />
AAI developed numerical models for Cr<strong>and</strong>all Canyon <strong>Mine</strong> as early as 1995. Between 1995<br />
<strong>and</strong> 2004, AAI performed several design/modeling projects using a program called EXPAREA.<br />
According to AAI:<br />
“This program was developed at the University <strong>of</strong> Minnesota by Dr. S. Crouch <strong>and</strong><br />
Dr. Starfield (Starfield <strong>and</strong> Crouch (1973), St. John (1978)). It was initially used<br />
for Project Salt Vault in the early days <strong>of</strong> the Nuclear Waste program. It uses the<br />
displacement discontinuity method. The development <strong>of</strong> the program <strong>and</strong> later<br />
variations such as MULSIM were further developed at the University <strong>of</strong> Minnesota<br />
under funding from the USBM [US Bureau <strong>of</strong> <strong>Mine</strong>s]. AAI has used the program<br />
since 1979 for design <strong>of</strong> underground thin-seam mines, particularly for coal<br />
mines.”<br />
However, in 2006, AAI elected to use another program, LaModel 5 , to model ground behavior at<br />
the mine. According to NIOSH 26 :<br />
“LAMODEL is s<strong>of</strong>tware that uses boundary-elements for calculating the stresses<br />
<strong>and</strong> displacements in coal mines or other thin, tabular seams or veins. It can be<br />
used to investigate <strong>and</strong> optimize pillar sizes <strong>and</strong> layout in relation to pillar stress,<br />
multiseam stress, or bump potential (energy release). LAMODEL simulates the<br />
overburden as a stack <strong>of</strong> homogeneous isotropic layers with frictionless interfaces,<br />
<strong>and</strong> with each layer having the identical elastic modulus, Poisson's Ratio, <strong>and</strong><br />
thickness. This "homogeneous stratification" formulation does not require specific<br />
material properties for each individual layer, <strong>and</strong> yet it still provides a realistic<br />
suppleness to the overburden that is not possible with the classic, homogeneous<br />
isotropic elastic overburden used in previous boundary element formulations such<br />
as MULSIM or BESOL. LAMODEL consists <strong>of</strong> three separate programs -<br />
LAMPRE, LAMODEL, <strong>and</strong> LAMPLT. You must install all three programs to use<br />
LAMODEL:<br />
LAMPRE is the pre-processor that facilitates creating the input file for LAMODEL.<br />
LAMPRE accepts all <strong>of</strong> the numerical parameters input for LAMODEL <strong>and</strong> allows<br />
graphical input <strong>of</strong> the material codes for the seam grids. Also, a "Material Wizard"<br />
helps generate reasonable coal properties <strong>and</strong> appropriate yield zones on coal<br />
pillars.<br />
LAMODEL calculates the stresses <strong>and</strong> displacements at the seam level from the<br />
user’s input file. Model runs can take several minutes to several days depending on<br />
the computer speed <strong>and</strong> model complexity. The output from LAMODEL is stored<br />
for subsequent analysis by LAMPLT, the post-processing program.<br />
LAMPLT is the post-processor that allows the user to plot <strong>and</strong> analyze the output<br />
from LAMODEL.”<br />
R-1
Appendix S - Back-Analysis <strong>of</strong> the Cr<strong>and</strong>all Canyon <strong>Mine</strong> Using<br />
the LaModel Program<br />
by<br />
Keith A. Heasley, Ph.D., P.E.<br />
West Virginia University<br />
S-1
Back Analysis <strong>of</strong> the<br />
Cr<strong>and</strong>all Canyon <strong>Mine</strong><br />
Using the LaModel Program<br />
By<br />
Keith A. Heasley, Ph.D., P.E.<br />
June 20, 2008
Executive Summary<br />
On August 6 th , 2007, the Cr<strong>and</strong>all Canyon <strong>Mine</strong> in Utah collapsed entrapping six miners. It<br />
appeared that a large area <strong>of</strong> pillars in the Main West <strong>and</strong> South Barrier sections <strong>of</strong> the mine had<br />
bumped in a brief time period, filling the mine entries with coal from the failed pillars <strong>and</strong><br />
entrapping the six miners working in the South Barrier section. Ten days later, during the heroic<br />
rescue effort, another bump occurred thereby killing three <strong>of</strong> the rescue workers, including one<br />
federal inspector, <strong>and</strong> injuring six other rescue workers. A few days after the August 16 th<br />
incident, a panel <strong>of</strong> ground control experts determined that the Main West area was structurally<br />
un-stable <strong>and</strong> underground rescue attempts halted. Subsequently the mine was ab<strong>and</strong>oned <strong>and</strong><br />
sealed.<br />
The objective <strong>of</strong> this investigation is to utilize the LaModel boundary-element program along<br />
with the best available information to back-analyze the August 6 th , 2007 collapse at the Cr<strong>and</strong>all<br />
Canyon <strong>Mine</strong> in order to better underst<strong>and</strong> the geometric <strong>and</strong> geo-mechanical factors which<br />
contributed to that collapse. Ultimately, it is hoped that this back-analysis will help determine<br />
improvements in mine design that can be made in the future to eliminate similar type events.<br />
In order to determine the optimum parameter values for matching the observed mine<br />
behavior, to assess the sensitivity <strong>of</strong> the model results to the input values, <strong>and</strong> to investigate<br />
various triggering mechanisms, an extensive parametric analysis was performed. This analysis<br />
examined: different overburden properties, gob properties, coal behavior <strong>and</strong> triggering<br />
mechanisms. In all, over 230 different models were run to perform the parameter optimization,<br />
sensitivity analysis <strong>and</strong> trigger investigation.<br />
Based on this extensive back analysis <strong>of</strong> the Cr<strong>and</strong>all Canyon <strong>Mine</strong> using the LaModel<br />
program <strong>and</strong> with the benefit <strong>of</strong> hindsight from the March bump <strong>and</strong> August collapse, a number<br />
<strong>of</strong> conclusions can be made concerning the mine design <strong>and</strong> August 6th collapse:<br />
1) Overall, the Main West <strong>and</strong> adjacent North <strong>and</strong> South Barrier sections were primed for a<br />
massive pillar collapse because <strong>of</strong> the large area <strong>of</strong> equal size pillars <strong>and</strong> the near unity safety<br />
factors. This large area <strong>of</strong> undersized pillars was the fundamental cause <strong>of</strong> the collapse.<br />
a. The pillars <strong>and</strong> inter-panel barriers in this portion <strong>of</strong> the Cr<strong>and</strong>all Canyon <strong>Mine</strong><br />
essentially constitute a large area <strong>of</strong> similar size pillars, one <strong>of</strong> the essential ingredients<br />
for a massive pillar collapse.<br />
b. The high overburden (2200 ft) was causing considerable development stress on the pillars<br />
in this area, <strong>and</strong> bringing pillar development safety factors below 1.4.<br />
c. Considerable longwall abutment stress was overriding the barrier pillars between the<br />
active sections <strong>and</strong> the old longwall gobs.<br />
2) The abutment stress from the active North Barrier retreat section was key to the March 10 th<br />
bump occurrence <strong>and</strong> the modeling indicated that the North Barrier abutment stress<br />
contributed to the August 6 th pillar collapse.<br />
3) From the modeling, it is not clear exactly what triggered the August collapse. A number <strong>of</strong><br />
factors or combination <strong>of</strong> factors could have been the final perturbation that initiated the<br />
collapse <strong>of</strong> the undersized pillars in the Main West area.<br />
4) LaModel analysis demonstrated that the active pillar recovery mining in the South Barrier<br />
section could certainly have been the trigger that initiated the August collapse; however, the<br />
modeling by itself does not indicate if the active mining was the most likely trigger.<br />
ii
Table <strong>of</strong> Contents<br />
Page<br />
Executive Summary .....................................................................................................ii<br />
List <strong>of</strong> Figures.................................................................................................................v<br />
1. Objective ....................................................................................................................1<br />
2. Background...............................................................................................................1<br />
2.1 The Cr<strong>and</strong>all Canyon <strong>Mine</strong>...................................................................................1<br />
2.2 The LaModel Program..........................................................................................1<br />
2.2.1 Calibrating LaModel.................................................................................2<br />
2.2.1.1 Rock Mass Stiffness...................................................................3<br />
2.2.1.2 Gob Stiffness..............................................................................4<br />
2.2.1.3 Coal Strength..............................................................................8<br />
2.2.1.4 Post-Failure Coal Behavior........................................................9<br />
2.2.2 LaModel <strong>and</strong> Bumps...............................................................................10<br />
2.2.3 LaModel <strong>and</strong> Massive Pillar Collapses...................................................11<br />
2.2.4 LaModel <strong>and</strong> Time <strong>and</strong> Homogeneity....................................................11<br />
2.2.5 Pillar <strong>Safety</strong> Factors in LaModel............................................................12<br />
3. The LaModel Analysis ........................................................................................15<br />
3.1 Approach………….............................................................................................15<br />
3.2 Basic Calibration Points......................................................................................15<br />
3.2.1 Main West...............................................................................................15<br />
3.2.2 North Barrier...........................................................................................15<br />
3.2.3 South Barrier...........................................................................................18<br />
3.2.4 Results <strong>of</strong> the August 6 th Collapse..........................................................18<br />
3.3 The LaModel Grid ..............................................................................................18<br />
3.4 Calibrating the Critical Parameters.....................................................................19<br />
3.4.1 Determining the Rock Mass Lamination Thickness...............................19<br />
3.4.2 Determining the Gob Stiffness................................................................21<br />
3.4.3 Determining the Coal Strength ...............................................................22<br />
3.4.3.1 Back Analysis <strong>of</strong> the North Barrier Bump...............................23<br />
3.5 Analyzing the August 6 th Collapse .....................................................................26<br />
3.5.1 Primary Results.......................................................................................26<br />
3.5.2 Triggering the Collapse <strong>of</strong> the South Barrier Section.............................30<br />
3.5.2.1 Reduced Coal Strength.............................................................31<br />
iii
Page<br />
3.5.2.2 Joint Slip ..................................................................................31<br />
3.5.2.3 S<strong>of</strong>ter Southern Gob.................................................................36<br />
3.6 Parametric Analysis ............................................................................................36<br />
3.7 Final Back Analysis Model.................................................................................38<br />
4. Summary……………..............................................................................................42<br />
5. Conclusions…………….........................................................................................43<br />
References………………..............................................................................................45<br />
iv
List <strong>of</strong> Figures<br />
Page<br />
2.1 Conceptualization <strong>of</strong> the abutment angle....................................................................6<br />
2.2 Suggested stability factors for the ARMPS deep-cover database...............................7<br />
2.3 Stress-strain <strong>and</strong> safety factor curves for the North Barrier 60 X 70 pillar..............14<br />
3.1 Map <strong>of</strong> the Main West area.......................................................................................16<br />
3.2 Rib <strong>and</strong> pillar failure in the North Barrier section as <strong>of</strong> March 16 th 2007................17<br />
3.3 Overburden stress as calculated by LaModel ...........................................................20<br />
3.4 Average gob stress as a function <strong>of</strong> lamination thickness <strong>and</strong> final gob modulus ...22<br />
3.5 Analysis <strong>of</strong> North Barrier bump ...............................................................................24<br />
3.6 Plot <strong>of</strong> pillar <strong>and</strong> element safety factors for step 3 ...................................................27<br />
3.7 Plot <strong>of</strong> pillar <strong>and</strong> element safety factors for step 5 ...................................................28<br />
3.8 Plot <strong>of</strong> pillar safety factors with coal strength adjusted in Main West.....................29<br />
3.9 Plot <strong>of</strong> pillar <strong>and</strong> element safety factors for step 6 with 4 pillars removed ..............32<br />
3.10 Plot <strong>of</strong> pillar safety factors for weakened coal in the Main West.............................33<br />
3.11 Plot <strong>of</strong> pillar safety factors for the model with a joint at crosscut 137 .....................34<br />
3.12 Plot <strong>of</strong> pillar safety factors for s<strong>of</strong>ter gob in the southern panels .............................35<br />
3.13 Final model <strong>of</strong> Cr<strong>and</strong>all Canyon <strong>Mine</strong> – steps 3 & 5 ...............................................40<br />
3.14 Final model <strong>of</strong> Cr<strong>and</strong>all Canyon <strong>Mine</strong> – step 9........................................................41<br />
v
1. Objective<br />
The objective <strong>of</strong> this investigation is to utilize the LaModel boundary-element program<br />
along with the best available information to back-analyze the August 6 th , 2007 collapse at the<br />
Cr<strong>and</strong>all Canyon <strong>Mine</strong> in order to better underst<strong>and</strong> the geometric <strong>and</strong> geo-mechanical<br />
factors which contributed to that collapse. A secondary objective <strong>of</strong> this work is to perform a<br />
parametric analysis <strong>of</strong> the pertinent input parameters to assess the sensitivity <strong>of</strong> the model<br />
results to the input values. Ultimately, it is hoped that this back-analysis will help determine<br />
improvements in mine design that can be made in the future to eliminate similar type events.<br />
2.1 The Cr<strong>and</strong>all Canyon <strong>Mine</strong><br />
2. Background<br />
On August 6 th , 2007, the Cr<strong>and</strong>all Canyon <strong>Mine</strong> in Utah collapsed entrapping six miners.<br />
It appeared that a large area <strong>of</strong> pillars in the Main West <strong>and</strong> South Barrier sections <strong>of</strong> the<br />
mine had bumped in a brief time period, filling the mine entries with coal from the failed<br />
pillars <strong>and</strong> entrapping the six miners working in the South Barrier section. The seismic event<br />
associated with the initial accident registered 3.9 on the Richter scale. Ten days later during<br />
the heroic rescue effort, another bump occurred thereby killing three <strong>of</strong> the rescue workers,<br />
including one federal inspector, <strong>and</strong> injuring six other rescue workers. A few days after the<br />
August 16 th incident, a panel <strong>of</strong> ground control experts determined that the Main West area<br />
was structurally unstable <strong>and</strong> posed a significant risk to anyone entering the area. At this<br />
point, underground rescue attempts halted <strong>and</strong> subsequently the mine was ab<strong>and</strong>oned <strong>and</strong><br />
sealed.<br />
2.2 The LaModel Program<br />
The LaModel program is used to model the stresses <strong>and</strong> displacements on thin tabular<br />
deposits such as coal seams. It use the displacement-discontinuity (DD) variation <strong>of</strong> the<br />
boundary-element method, <strong>and</strong> because <strong>of</strong> this formulation, it is able to analyze large areas <strong>of</strong><br />
single or multiple-seam coal mines (Heasley, 1998). LaModel is unique among boundary<br />
element codes because the overburden material includes laminations which give the model a<br />
very realistic flexibility for stratified sedimentary geologies <strong>and</strong> multiple-seam mines. Using<br />
LaModel, the total vertical stresses <strong>and</strong> displacements in the coal seam are calculated, <strong>and</strong><br />
also, the individual effects <strong>of</strong> multiple-seam stress interactions <strong>and</strong> topographic relief can be<br />
separated <strong>and</strong> analyzed individually.<br />
Since LaModel’s original introduction in 1996, it has continually been upgraded (based<br />
on user requests) <strong>and</strong> modernized as operating systems <strong>and</strong> programming languages have<br />
changed. The present program is written in Micros<strong>of</strong>t Visual C++ <strong>and</strong> runs in the windows<br />
operating system. It can be used to calculate convergence, vertical stress, overburden stress,<br />
element safety factors, pillar safety factors, intra-seam subsidence, etc. on single <strong>and</strong> multiple<br />
seams with complex geometries <strong>and</strong> variable topography. Presently, the program can<br />
analyze a 1000 x 1000 grid with 6 different material models <strong>and</strong> 26 different individual in-<br />
- 1 -
seam materials. It uses a forms-based system for inputting model parameters <strong>and</strong> a graphical<br />
interface for creating the mine grid. Also, it includes a utility referred to as a “Wizard” for<br />
automatically calculating coal pillars with a Mark-Bienawski pillar strength <strong>and</strong> another<br />
utility to assist with the development <strong>of</strong> “st<strong>and</strong>ard” gob properties. Recently, the LaModel<br />
program was interfaced with AutoCAD to allow mine plans <strong>and</strong> overburden contours to be<br />
automatically imported into the corresponding seam <strong>and</strong> overburden grids. Also, the output<br />
from LaModel can be downloaded into AutoCAD <strong>and</strong> overlain on the mine map for<br />
enhanced analysis <strong>and</strong> graphical display.<br />
2.2.1 Calibrating LaModel:<br />
The accuracy <strong>of</strong> a LaModel analysis depends entirely on the accuracy <strong>of</strong> the input<br />
parameters. Therefore, the input parameters need to be calibrated with the best available<br />
information, either: measured, observed, or empirically or numerically derived. However, in<br />
calibrating the model, the user also needs to consider that the mathematics in LaModel are<br />
only a simplified approximation <strong>of</strong> the true mechanical response <strong>of</strong> the overburden <strong>and</strong><br />
because <strong>of</strong> the mathematical simplifications built into the program, the input parameters may<br />
need to be appropriately adjusted to reconcile the program limitations.<br />
In particular, after many years <strong>of</strong> experience with the program, it is clear that in many<br />
situations the overburden model in LaModel is not as flexible as the true overburden. The<br />
laminated overburden model in LaModel is inherently more flexible than a homogeneous<br />
elastic overburden as used in previous displacement-discontinuity codes <strong>and</strong> it is more<br />
flexible than a stratified elastic model without bedding plane slip as used in many finiteelement<br />
programs. However, using reasonable values <strong>of</strong> input parameters, the LaModel<br />
program still does not produce the level <strong>of</strong> seam convergence <strong>and</strong>/or surface subsidence as<br />
measured in the field. It is believed that this displacement limitation in the model may be<br />
due to the lack <strong>of</strong> any consideration for vertical joint movement in the program. The<br />
laminated model makes a good attempt at simulating bedding plane slip in the overburden,<br />
but it does not consider any overburden movement due to vertical/sub-vertical joint slip,<br />
thereby limiting the amount <strong>of</strong> calculated displacements.<br />
Knowing the inherent limitations <strong>of</strong> LaModel, the user can either calibrate for realistic<br />
stress output or for realistic displacement output. In general, it is not possible to accurately<br />
model both with the same set <strong>of</strong> material parameters. If the user calibrates the model to<br />
produce realistic stress values, then the input parameters are optimized to match as closely as<br />
possible the observed/measured stress levels from the field, <strong>and</strong> it is likely that the calculated<br />
displacement values will be low. On the other h<strong>and</strong>, if the user optimizes the input<br />
parameters to produce realistic displacement/subsidence values, then generally, the<br />
calculated stress values will be inaccurate. Historically, the vast majority <strong>of</strong> LaModel users<br />
have been interested in calculating realistic stresses <strong>and</strong> loads, <strong>and</strong> in this back-analysis <strong>of</strong><br />
the pillar stability at the Cr<strong>and</strong>all Canyon <strong>Mine</strong> realistic stress <strong>and</strong> load calculations are also<br />
the primary objective.<br />
When actually building a model, the geometry <strong>of</strong> the mining in the seams <strong>and</strong> the<br />
topography are fairly well known <strong>and</strong> fairly accurately discretized into LaModel grids. The<br />
most critical input parameters with regard to accurately calculating stresses <strong>and</strong> loads, <strong>and</strong>,<br />
therefore, pillar stability <strong>and</strong> safety factors, are then:<br />
- 2 -
• The Rock Mass Stiffness<br />
• The Gob Stiffness<br />
• The Coal Strength<br />
These three parameters are always fundamentally important to accurate modeling with<br />
LaModel <strong>and</strong> particularly so in simulations analyzing abutment stress transfer (from gob<br />
areas) <strong>and</strong> pillar stability as in the Cr<strong>and</strong>all Canyon <strong>Mine</strong> situation. During model<br />
calibration, it is critical to note that these parameters are strongly interrelated, <strong>and</strong> because <strong>of</strong><br />
the model geo-mechanics, the parameters need to be calibrated in the order shown above.<br />
With this sequence <strong>of</strong> parameter calibration, the calibrated value <strong>of</strong> the subsequent<br />
parameters is determined by the chosen value <strong>of</strong> the previous parameters, <strong>and</strong> changing the<br />
value <strong>of</strong> any <strong>of</strong> the preceding parameters will require re-calibration <strong>of</strong> the subsequent<br />
parameters. The model calibration process as it relates to each <strong>of</strong> these parameters is<br />
discussed in more detail below.<br />
2.2.1.1 Rock Mass Stiffness: The stiffness <strong>of</strong> the rock mass in LaModel is primarily<br />
determined by two parameters, the rock mass modulus <strong>and</strong> the rock mass lamination<br />
thickness. Increasing the modulus or increasing the lamination thickness <strong>of</strong> the rock mass<br />
will increase the stiffness <strong>of</strong> the overburden. With a stiffer overburden: 1) the extent <strong>of</strong> the<br />
abutment stresses will increase, 2) the convergence over the gob areas will decrease <strong>and</strong> 3)<br />
the multiple seam stress concentrations will be smoothed over a larger area. When<br />
calibrating for realistic stress output, the rock mass stiffness should be calibrated to produce a<br />
realistic extent <strong>of</strong> abutment zone at the edge <strong>of</strong> the critical gob areas. Since changes in either<br />
the modulus or lamination thickness cause a similar response in the model, it is most efficient<br />
to keep one parameter constant <strong>and</strong> only adjust the other. When calibrating the rock mass<br />
stiffness, it has been found to be most efficient to initially select a rock mass modulus <strong>and</strong><br />
then solely adjust the lamination thickness for the model calibration.<br />
In calibrating the lamination thickness for a model based on the extent <strong>of</strong> the abutment<br />
zone, it would be best to use specific field measurements <strong>of</strong> the abutment zone from the<br />
mine. However, <strong>of</strong>ten these field measurements are not available. In this case, visual<br />
observations <strong>of</strong> the extent <strong>of</strong> the abutment zone can <strong>of</strong>ten be used. Most operations<br />
personnel in a mine have a fairly good idea <strong>of</strong> how far the stress effects can be seen from an<br />
adjacent gob.<br />
Without any field measurements or observations, general historical field measurements<br />
can be used. For instance, historical field measurements would indicate that, on average, the<br />
extent <strong>of</strong> the abutment zone (D) at depth (H) (with both terms expressed in units <strong>of</strong> ft) should<br />
be (Mark <strong>and</strong> Chase, 1997; Mark, 1992):<br />
or that 90% <strong>of</strong> the abutment load should be within:<br />
D = 9.3 H<br />
(2.1)<br />
D = 5 H<br />
(2.2)<br />
Once the extent <strong>of</strong> the abutment zone (D) at a given site is determined, an equation<br />
recently derived from the fundamental laminated overburden model can be used to determine<br />
- 3 -
the lamination thickness (t) required to match that abutment extent based on the value <strong>of</strong><br />
some <strong>of</strong> the other site parameters:<br />
t<br />
2<br />
2<br />
2Es<br />
12(1−<br />
v ) ⎛ D- d ⎞<br />
= × ⎜ ⎟<br />
(2.3)<br />
E×<br />
M<br />
⎜ ln(1 - Lg)<br />
⎟<br />
⎝ ⎠<br />
Where:<br />
E = The elastic modulus <strong>of</strong> the overburden<br />
v = The Poisson’s Ratio <strong>of</strong> the overburden<br />
E s = The elastic modulus <strong>of</strong> the seam<br />
M = The seam thickness<br />
d = The extent <strong>of</strong> the coal yielding at the edge <strong>of</strong> the gob<br />
L g = The fraction <strong>of</strong> gob load within distance D<br />
As mentioned previously, there is a practical trade-<strong>of</strong>f between getting a realistic stress<br />
distribution <strong>and</strong> getting realistic convergence. Equation 2.3 provides an optimum lamination<br />
thickness to use for matching the desired abutment stress extent; it should not be used for<br />
determining the optimum lamination thickness for accurately calculating displacement <strong>and</strong>/or<br />
subsidence values. Furthermore, when using equation 2.3, the user is fairly accurately<br />
matching the “global” stress transfer in the field with the global stress transfer in the model.<br />
In many practical mining situations, the more “local” stress transfer between adjacent pillars<br />
or between adjacent multiple seams is probably determined by the local flexing <strong>of</strong> the thinner<br />
strata laminations in the immediate ro<strong>of</strong> or interburden. To optimally match these more local<br />
effects or to compromise between matching global <strong>and</strong> local stress transfer, a thinner<br />
lamination thickness than determined by equation 2.3 may be appropriate.<br />
2.2.1.2 Gob Stiffness: In a LaModel analysis with gob areas, an accurate input stiffness for<br />
the gob (in relation to the stiffness <strong>of</strong> the rock mass) is critical to accurately calculating pillar<br />
stresses <strong>and</strong> safety factors. The relative stiffness <strong>of</strong> the gob determines how much<br />
overburden weight is carried by the gob; <strong>and</strong> therefore, not transferred to the surrounding<br />
pillars as an abutment stress. This means that a stiffer gob carries more load <strong>and</strong> the<br />
surrounding pillars carry less, while a s<strong>of</strong>ter gob carries less load <strong>and</strong> the surrounding pillars<br />
carry more. In LaModel, three models are available to simulate gob behavior: 1) linearelastic,<br />
2) bilinear <strong>and</strong> 3) strain-hardening. The gob wizard available in LamPre is designed<br />
to assist the user in developing strain-hardening input parameters.<br />
In the strain hardening model, the stiffness <strong>of</strong> the gob is primarily determined by<br />
adjusting the “Final Modulus” (Heasley, 1998; Pappas <strong>and</strong> Mark, 1993; Zipf, 1992). A<br />
higher final modulus gives a stiffer gob <strong>and</strong> a lower modulus value produces a s<strong>of</strong>ter gob<br />
material. Given that the behavior <strong>of</strong> the gob is so critical in determining the pillar stresses<br />
<strong>and</strong> safety factors, it is a sad fact that our knowledge <strong>of</strong> insitu gob properties <strong>and</strong> stresses is<br />
very poor.<br />
For a calibrated LaModel analysis, it is imperative that the gob stiffness be calibrated<br />
with the best available information on the amount <strong>of</strong> abutment load (or gob load) experienced<br />
at that mine. Once again, it would be best to use specific field measurements <strong>of</strong> the abutment<br />
load or gob load from the mine in order to determine realistic gob stiffness. However, these<br />
- 4 -
types <strong>of</strong> field measurements are quite rare (<strong>and</strong> sometimes <strong>of</strong> questionable accuracy). Also,<br />
visual observations are not very useful for estimating abutment loads or gob loads; <strong>and</strong><br />
therefore, general empirical information is quite <strong>of</strong>ten the only available data.<br />
In order to calibrate the gob stiffness for a practical situation, it is best to consider a<br />
number <strong>of</strong> general guiding factors. For a first approximation, a comparison <strong>of</strong> the present<br />
gob width <strong>and</strong> the critical gob width for the given depth can provide some insight. For a<br />
critical (or supercritical) panel width (where the maximum amount <strong>of</strong> subsidence has been<br />
achieved), it would be expected that the peak gob load in the middle <strong>of</strong> the panel would<br />
approach the insitu overburden load. As the depth increases from the critical situation <strong>and</strong><br />
the gob width becomes more subcritical, a laminated overburden analysis with a linear gob<br />
material would suggest that the peak gob load would increase linearly with depth from the<br />
load level in the critical case (Chase et al., 2002; Heasley, 2000).<br />
The critical depth (H c ) for a given gob width (P) <strong>and</strong> abutment angle (ß) can be<br />
calculated as:<br />
P<br />
H c<br />
= (2.4)<br />
2×<br />
tan( ß )<br />
Where:<br />
P = Panel Width (ft)<br />
β = Abutment Angle<br />
<strong>and</strong> then the expected average gob stress (s gob-lam-av ) at the actual seam depth (H) can be<br />
calculated as:<br />
⎛ H<br />
s =<br />
⎜<br />
gob-lam−av<br />
⎝ Hc<br />
Where:<br />
H = Seam Depth (ft)<br />
δ = Overburden Density (lbs/cu ft)<br />
⎞⎛<br />
Hc<br />
× δ ⎞ ⎛ H×<br />
δ<br />
⎟⎜<br />
⎟ = ⎜<br />
⎠⎝<br />
2 × 144 ⎠ ⎝ 288<br />
⎞<br />
⎟<br />
⎠<br />
(2.5)<br />
Equation 2.5, which is based on a laminated overburden <strong>and</strong> a linear elastic gob, implies that<br />
the average gob stress for a subcritical panel is solely a function <strong>of</strong> the depth <strong>and</strong> equal to<br />
half <strong>of</strong> the insitu stress. (In reality, gob material is generally considered to be strainhardening<br />
<strong>and</strong> therefore, equation 2.5 may underestimate the actual gob loading.)<br />
Another factor to consider in estimating the gob stiffness <strong>and</strong> the abutment loading is the<br />
abutment angle concept utilized in ALPS <strong>and</strong> ARMPS. In both these programs, an average<br />
abutment angle <strong>of</strong> 21º was determined from a large empirical database <strong>and</strong> is used to<br />
calculate the abutment loading. Using the abutment angle concept <strong>and</strong> the geometry shown<br />
in Figure 2.1, the average gob stress (s gob-sup-av ) for a supercritical panel can be calculated as:<br />
s<br />
gob-sup−av<br />
⎛ H×<br />
δ ⎞⎛ P − ×<br />
= ⎜ ⎟⎜<br />
⎝ 144 ⎠⎝<br />
P<br />
( H tanß) ⎞ ⎟⎠<br />
(2.6)<br />
Where:<br />
H = Seam Depth (ft)<br />
δ = Overburden Density (lbs/cu ft)<br />
- 5 -
P = Panel Width (ft)<br />
β = Abutment Angle<br />
Similarly, the average gob stress (s gob-sub-av ) for a subcritical panel can be calculated from the<br />
geometry in Figure 2.1 as:<br />
s<br />
gob-sub−av<br />
P ⎛<br />
= ⎜<br />
4 ⎝<br />
1<br />
tanß<br />
⎞⎛<br />
δ ⎞<br />
⎟⎜<br />
⎟<br />
⎠⎝144⎠<br />
(2.7)<br />
Equation 2.7, which is based on the abutment angle concept <strong>of</strong> gob loading, implies that the<br />
average gob stress for a subcritical panel (with an assumed abutment angle) is solely a<br />
function <strong>of</strong> the panel width.<br />
H tanβ<br />
P/2<br />
H<br />
L S<br />
- Side Abutment Load<br />
β- Abutment Angle<br />
<strong>Mine</strong>d out panel<br />
Supercritical<br />
L SS<br />
P<br />
β<br />
Figure 2.1 Conceptualization <strong>of</strong> the abutment angle.<br />
Subcritical<br />
Recent work has noted that the concept <strong>of</strong> a constant abutment angle as used in ALPS<br />
<strong>and</strong> ARMPS appears to breakdown under deeper cover (see Figure 2.2)(Chase et al., 2002;<br />
Heasley, 2000). In particular, for room-<strong>and</strong>-pillar retreat panels deeper than 1250 ft, it was<br />
found that a stability factor <strong>of</strong> 0.8 (for strong ro<strong>of</strong>) could be successfully used in ARMPS, as<br />
opposed to a required stability factor <strong>of</strong> 1.5 for panels less than 650 ft deep. One <strong>of</strong> the more<br />
likely explanations for this reduction in allowable stability factor is that the actual pillar<br />
abutment loading may be less than predicted by using the constant abutment angle concept<br />
(Chase et al., 2002). Colwell found a similar situation with deep longwall panels in Australia<br />
where the measured abutment stresses were much less than predicted with a 21º abutment<br />
angle (Colwell et al., 1999).<br />
- 6 -
ARMPS Stability Factor<br />
2<br />
1.5<br />
1<br />
0.5<br />
Design Line<br />
Successful Case<br />
Unsuccessful Case<br />
0<br />
650 850 1050 1250 1450 1650 1850<br />
Depth <strong>of</strong> Cover (ft)<br />
Figure 2.2 Suggested stability factors for the ARMPS deep-cover database.<br />
The degree to which a constant abutment angle might overestimate the abutment loading<br />
can be investigated by comparing the recommended NIOSH stability factors for shallow <strong>and</strong><br />
deep cover. Below 650 ft, a stability factor greater than 1.5 is recommended but, at depths<br />
greater than 1250 ft, 0.8 is acceptable. Since higher coal strengths have not been correlated<br />
with greater depth, it is most likely that the lower stability factor recommendation is due to<br />
an overestimate <strong>of</strong> applied stress or load. Based on the NIOSH recommendations, it appears<br />
that the abutment loading based on the constant abutment angle <strong>of</strong> 21B could be as much as<br />
1.875 (1.5/0.8) times higher than actual loading experienced in the field. Implementing this<br />
adjustment produces the following equation for an adjusted average gob load for a subcritical<br />
panel based on the abutment angle concept (given without derivation):<br />
s<br />
gob-adj−av<br />
⎡ ⎛ 0.8 ⎞ ⎛<br />
= ⎢1<br />
−⎜<br />
⎟∗⎜<br />
⎣ ⎝ 1.5 ⎠ ⎝<br />
( 4H∗tanß)<br />
−P<br />
⎞⎤<br />
⎛ H∗δ<br />
⎟⎥ ∗⎜<br />
4H∗tanß<br />
⎠⎦<br />
⎝ 144<br />
⎞<br />
⎟<br />
⎠<br />
(2.8)<br />
Where:<br />
H = Seam Depth (ft)<br />
δ = Overburden Density (lbs/cu ft)<br />
P = Panel Width (ft)<br />
β = Abutment Angle<br />
The preceding discussion on gob stiffness <strong>and</strong> loading has produced several competing<br />
concepts/equations. Equation 2.5, which is based on a laminated overburden model <strong>and</strong> a<br />
linear elastic gob, implies that the average gob stress for a subcritical panel is solely a<br />
function <strong>of</strong> the depth. Equation 2.7, which is based on the abutment angle concept <strong>of</strong> gob<br />
loading, implies that the average gob stress for a subcritical panel is solely a function <strong>of</strong> the<br />
panel width. Equation 2.8 modifies the abutment angle concept in an attempt to produce<br />
more realistic results for panels deeper than 1250 ft.<br />
- 7 -
It is not entirely clear which concept or equation provides the most realistic estimates <strong>of</strong><br />
gob stress. From recent experience, Equation 2.7 appears to provide a lower bound for<br />
realistic gob stresses <strong>and</strong> Equation 2.8 appears to provide an upper bound. Equation 2.5 is<br />
between the bounds set by equations 2.7 & 2.8 <strong>and</strong> may provide a reasonable starting point<br />
for further calibration. Regardless <strong>of</strong> which equation is chosen as a starting point, it is clear<br />
that a realistic gob/abutment loading is critical to a realistic model result <strong>and</strong> that the gob<br />
stiffness should be carefully analyzed <strong>and</strong> calibrated in a realistic model.<br />
If the user desires to calibrate the abutment <strong>and</strong>/or gob loading in the model based on a<br />
laminated approximation or a specific abutment angle, then either equation 2.5, 2.7 or 2.8,<br />
depending on the situation, could be used to determine the average gob loading. Each <strong>of</strong><br />
these equations provides an estimate <strong>of</strong> average gob stress. After choosing among them, the<br />
user would need to run several models with various gob stiffnesses (in LaModel or LaM2D),<br />
measure the average gob loading in the model, <strong>and</strong> then choose the final gob modulus which<br />
best fits the estimated gob stress.<br />
2.2.1.3 Coal Strength: Accurate insitu coal strength is another value which is very difficult<br />
to obtain <strong>and</strong> yet is critical to determining accurate pillar safety factors. It is difficult to get a<br />
representative laboratory test value for the coal strength <strong>and</strong> scaling the laboratory values to<br />
accurate insitu coal pillar values is not very straightforward or precise (Mark <strong>and</strong> Barton,<br />
1997). For the default coal strength in LaModel, 900 psi (S i ) is used in conjunction with the<br />
Mark-Bieniawski pillar strength formula (Mark, 1999):<br />
Where:<br />
S p = Pillar Strength (psi)<br />
S i = Insitu Coal Strength (psi)<br />
w = Pillar Width<br />
l = Pillar Length<br />
h = Pillar Height<br />
2<br />
⎡ ⎛ w ⎞ ⎛ w ⎞⎤<br />
Sp = Si<br />
⎢0.64<br />
+ 0.54⎜<br />
⎟ − 0.18<br />
⎜<br />
⎟⎥<br />
(2.9)<br />
⎣ ⎝ h ⎠ ⎝ lh ⎠⎦<br />
This formula also implies a stress gradient from the pillar rib that can be calculated as:<br />
Where:<br />
s p (x) = Peak Coal Stress (psi)<br />
x = Distance into Pillar<br />
S i = Insitu Coal Strength (psi)<br />
h = Pillar Height<br />
⎛ ⎛ x ⎞⎞<br />
s<br />
p<br />
(x) = Si⎜0.64<br />
+ 2.16 ⎜ ⎟⎟<br />
(2.10)<br />
⎝ ⎝ h ⎠⎠<br />
The best technique to determine appropriate coal strength for LaModel is to back analyze<br />
a previous mining situation (similar to the situation in question) where the coal was close to,<br />
- 8 -
or past, failure. Back-analysis is an iterative process in which coal strength is increased or<br />
decreased to determine a value that provides model results consistent with the actual<br />
observed failure. This back analysis should, <strong>of</strong> course, use the previously determined<br />
optimum values <strong>of</strong> the lamination thickness <strong>and</strong> gob stiffness. If there are no situations<br />
available where the coal was close to failure, then the back-analysis can at least determine a<br />
minimum insitu coal strength with some thought <strong>of</strong> how much stronger the coal may be, or<br />
the default average <strong>of</strong> 900 psi can be used.<br />
The 900 psi insitu coal strength that is the default in LaModel comes from the databases<br />
used to create the ALPS <strong>and</strong> ARMPS program <strong>and</strong> is supported by considerable empirical<br />
data. It is the author’s opinion that insitu coal strengths calculated from laboratory tests are<br />
not more valid than the default 900 psi, due to the inaccuracies inherent to the testing <strong>and</strong><br />
scaling process for coal strength. If the LaModel user chooses to deviate very much from the<br />
default 900 psi, they should have a very strong justification, preferably a suitable back<br />
analysis as described above.<br />
2.2.1.4 Post-Failure Coal Behavior: The present underst<strong>and</strong>ing <strong>of</strong> the post failure behavior<br />
<strong>of</strong> coal pillars is very limited, <strong>and</strong> most <strong>of</strong> this underst<strong>and</strong>ing comes from the analysis <strong>of</strong> coal<br />
specimens tested in the laboratory, not pillars in the field (Barron, 1992; Das, 1986). It is<br />
generally understood that a slender coal specimen tested past its ultimate strength will<br />
initially reach maximum peak strength at the point <strong>of</strong> “failure” <strong>and</strong> then, with further strain,<br />
the specimen will “s<strong>of</strong>ten” (carry increasingly less load as it continues to be deformed) until<br />
the broken coal reaches a final “residual” strength. In general, as the specimen width-toheight<br />
ratio increases or the confining pressure on the specimen increases, the peak strength<br />
will increase, the residual strength will increase, <strong>and</strong> the s<strong>of</strong>tening modulus will flatten. At a<br />
particular width-to-height ratio (Das found this to be approximately 8:1) or confining stress,<br />
the specimen will no longer s<strong>of</strong>ten after elastic failure, but will become essentially “elasticplastic”.<br />
At higher width-to-height ratios or confining pressure, the coal specimens actually<br />
become “strain-hardening”, where they carry increasing load with increasing deformation<br />
after elastic failure. There is also some information that indicates that coal in the field may<br />
actually become pseudo-ductile at very high confining stresses (Barron, 1992; Heasley <strong>and</strong><br />
Barron, 1988).<br />
When the post-failure behavior <strong>of</strong> coal pillars needs to be accurately simulated (as is the<br />
case with this back-analysis <strong>of</strong> Cr<strong>and</strong>all Canyon <strong>Mine</strong>), “residual strength” <strong>and</strong> “residual<br />
strain” must be determined accurately. These parameters essentially define the pillar postfailure<br />
behavior. Some insights to residual strength <strong>and</strong> residual strain have been provided<br />
by laboratory tests where the peak <strong>and</strong> residual strength are seen to increase with increased<br />
confining pressure (or distance into the pillar) while the s<strong>of</strong>tening modulus decreases with<br />
increased confinement. These trends are also seen/assumed to be valid in the field.<br />
Some pioneering work in trying to accurately quantify the strain s<strong>of</strong>tening behavior <strong>of</strong><br />
coal pillars for boundary-element modeling was done by Karabin <strong>and</strong> Evanto (1999). In this<br />
work, they developed an equation from field measurements which estimated an ultimate<br />
residual stress level (s r ):<br />
Where:<br />
( 0.2254 ln ( x)<br />
) s (x)<br />
s (x) = ×<br />
r p<br />
(2.11)<br />
- 9 -
s r (x) = Residual Stress (psi)<br />
s p (x) = Peak Stress (psi)<br />
x = Distance into Pillar<br />
<strong>and</strong> the strain level (e r ) for the final residual stress:<br />
e (x) = 4 e (x)<br />
(2.12)<br />
r<br />
×<br />
p<br />
Where:<br />
e r (x)<br />
e p (x)<br />
x<br />
= Residual Strain (psi)<br />
= Peak Strain (psi)<br />
= Distance into Pillar<br />
These post-failure stress-strain relationships are consistent with trends in the<br />
load/deflection response <strong>of</strong> coal samples as described above; however, Karabin <strong>and</strong> Evanto<br />
certainly note that these properties are only “first approximations” <strong>and</strong> must be verified for<br />
accuracy. For use in LaModel or any boundary element model, these are some <strong>of</strong> the only<br />
post-failure coal properties calculations available. Certainly, this is an area for additional<br />
research. (It should be noted in equation 2.11 that the value, “0.2254” essentially determines<br />
the global magnitude <strong>of</strong> the residual stress in this strain-s<strong>of</strong>tening coal model <strong>and</strong> that the<br />
value <strong>of</strong> “4” in equation 2.12 essentially determines the global magnitude <strong>of</strong> the residual<br />
strain value in this strain-s<strong>of</strong>tening model. For LaModel calibration purposes, these single<br />
values can be adjusted in order to vary the residual strength or strain <strong>of</strong> the coal model.)<br />
2.2.2 LaModel <strong>and</strong> Bumps:<br />
The term “bump” is used in this report to describe the sudden violent failure <strong>of</strong> a coal<br />
pillar or rib which ejects coal into the adjacent openings. At the present time, the exact<br />
mechanics <strong>of</strong> coal bumps are not completely understood. However, a lot <strong>of</strong> research has<br />
been done to underst<strong>and</strong> the bump phenomenon, <strong>and</strong> a lot <strong>of</strong> progress has been made.<br />
Bumps are known to be associated with deep cover, competent strata <strong>and</strong> retreat mining<br />
which concentrates overburden stress. Also, it is known that bump behavior can be triggered<br />
in laboratory specimens by using a “s<strong>of</strong>t” loading system or by suddenly releasing confining<br />
stresses. The past bump research has produced many significant improvements in<br />
minimizing or eliminating coal bumps (in some situations) through better mine designs <strong>and</strong><br />
cut sequencing. However, in general, it is still not possible to precisely predict whether a<br />
particular pillar or mine plan will bump, nor is it generally possible to predict the exact<br />
timing <strong>of</strong> a bump event. Bump prediction can be readily compared to earthquake prediction.<br />
The general area <strong>and</strong> nature <strong>of</strong> certain earthquakes (bumps) are well understood, but<br />
predicting the exact timing, location <strong>and</strong> magnitude <strong>of</strong> the next earthquake (bump) is still<br />
beyond the present scientific capability.<br />
In LaModel, a bump is simply simulated as a pillar (or coal) failure. LaModel does not<br />
calculate any <strong>of</strong> the details <strong>of</strong> the coal or overburden failure mechanics; the program does not<br />
consider whether a bump occurs from simply overloading the coal or whether there is some<br />
external loading mechanism or sudden loss <strong>of</strong> confinement. However, coal that bumps has to<br />
be at, or very near, its ultimate failure strength at the time <strong>of</strong> the bump; therefore, it is<br />
reasonable to associate the point <strong>of</strong> coal failure in LaModel simulations with potential coal<br />
- 10 -
umps. Since LaModel does not have any dynamic capabilities, it cannot distinguish<br />
between a gentle controlled pillar failure <strong>and</strong> a violent pillar bump. However, that distinction<br />
can generally be determined from the geology <strong>and</strong>/or history <strong>of</strong> the mine. In some mines, the<br />
pillars fail gently while in other mines, with “bump-prone” conditions, pillar failure is likely<br />
to occur as a bump. Therefore, in a bump-prone mine or in bump-prone conditions, it can be<br />
assumed that any pillar failure could be a potential bump.<br />
2.2.3 LaModel <strong>and</strong> Massive Pillar Collapses:<br />
The term massive pillar collapse (also called “cascading pillar failures”, “domino-type<br />
failures” or “pillar runs”) refers to the situation in a room-<strong>and</strong>-pillar mine where a large area<br />
<strong>of</strong> undersized pillars dynamically fails. In a massive pillar collapse, it is generally assumed<br />
that one pillar fails (for some reason), it sheds its load to the adjacent pillars, causing them to<br />
fail, <strong>and</strong> so forth (Mark et al,, 1997). This phenomenon has occurred a dozen or so times in<br />
the U.S, <strong>and</strong> has been fairly well documented <strong>and</strong> analyzed (Mark et al., 1997; Zipf, 1996).<br />
The basic condition for a massive pillar collapse is a large area <strong>of</strong> pillars loaded almost to<br />
failure. Generally, the ro<strong>of</strong> <strong>and</strong> floor must be fairly competent or they would yield <strong>and</strong><br />
relieve the pressure on the pillars. Also, the pillars have to be strain-s<strong>of</strong>tening in order for<br />
them to shed load <strong>and</strong> propagate the collapse. (On initial inspection, the Cr<strong>and</strong>all Canyon<br />
<strong>Mine</strong> failure certainly appears to be consistent with a massive pillar collapse; however, the<br />
depth <strong>of</strong> the mine workings, the size <strong>of</strong> the collapse area <strong>and</strong> the bump-type failure set this<br />
failure outside <strong>of</strong> the previous database <strong>of</strong> massive pillar collapses.)<br />
In LaModel, a massive pillar collapse is simulated when a “small” change in the mining<br />
condition results in a “large” number <strong>of</strong> pillars failing over a “large” area. The small change<br />
in mining condition can be any one (or combination) <strong>of</strong> a number <strong>of</strong> items: an additional cut<br />
or two, the pulling <strong>of</strong> another pillar, a small drop in coal strength (e.g. deterioration over<br />
time), the sudden movement on a fault or joint, etc. Of course, in LaModel, as in reality, to<br />
accurately simulate the massive pillar collapse, a large area <strong>of</strong> pillars must be close to failure<br />
<strong>and</strong> they must be strain-s<strong>of</strong>tening.<br />
2.2.4 LaModel <strong>and</strong> Time <strong>and</strong> Homogeneity:<br />
A complete discussion <strong>of</strong> LaModel calibration must also address time <strong>and</strong> homogeneity.<br />
In a LaModel analysis, the solutions are static. The model converges on a static solution <strong>of</strong><br />
stresses <strong>and</strong> displacements based on the given geometry <strong>and</strong> material properties. In reality,<br />
we know that geologic materials change over time without necessarily any outside stress or<br />
displacement influence. Coal pillars can slough, weaken <strong>and</strong> fail, ro<strong>of</strong> rock can crack, s<strong>of</strong>ten<br />
<strong>and</strong> fall, <strong>and</strong> floors can heave, etc. In fact, the geo-mechanical environment in a mine is very<br />
dynamic. Not only is the geometry constantly changing due to the active mining, but the<br />
pillars, ro<strong>of</strong> <strong>and</strong> floor are continuously adjusting to the stresses through time. Generally, the<br />
geo-mechanical adjustment to new stresses initially occurs quickly <strong>and</strong> then slows<br />
exponentially as time advances.<br />
In a LaModel analysis, geologic materials are assumed to be perfectly homogeneous.<br />
The material behavior is identical at different locations in the model <strong>and</strong> the stresses <strong>and</strong><br />
displacements are continuous <strong>and</strong> smooth from one location to another <strong>and</strong> from one step to<br />
the next. In reality, we know that geologic material is not homogeneous. The rock <strong>and</strong> coal<br />
have bedding planes, joints <strong>and</strong> other discontinuities, <strong>and</strong> the intrinsic material properties can<br />
change dramatically (10-20% or more) in very short distances. Similarly, failure in a mine is<br />
- 11 -
not typically continuous <strong>and</strong> smooth. The ro<strong>of</strong> <strong>and</strong> floor can appear essentially stable <strong>and</strong><br />
then suddenly fail, pillars can suddenly slough or fail <strong>and</strong> certainly large cave/gob areas are<br />
known to advance in a stepwise fashion.<br />
Since LaModel does not inherently account for the effects <strong>of</strong> time or inhomogeneity, the<br />
user needs to consider these factors in the analysis <strong>and</strong> interpretation <strong>of</strong> any results. For<br />
instance, in a given cut sequence, LaModel may indicate that a certain pillar has just barely<br />
failed. In reality, considering time, it may take a little while for the pillar to ultimately fail,<br />
or considering homogeneity, the pillar may be a little weaker or stronger than modeled <strong>and</strong><br />
may fail a little sooner or later in the cut sequence. The static <strong>and</strong> homogenous nature <strong>of</strong><br />
LaModel actually resists sudden changes in stability. The classic example is the analysis <strong>of</strong> a<br />
large area <strong>of</strong> equal size (strain-s<strong>of</strong>tening) pillars. A LaModel analysis may show that all <strong>of</strong><br />
these “equal” pillars have exactly the same stability factor that is a bit greater than one; <strong>and</strong><br />
therefore, the area is stable. In reality, the pillars have some statistical distribution <strong>of</strong><br />
strength, <strong>and</strong> the stability factor <strong>of</strong> each individual pillar is slightly different. So, even if the<br />
average stability factor <strong>of</strong> the section is greater than one, once the weakest pillar fails <strong>and</strong><br />
sheds it load, this can overload the adjacent pillars <strong>and</strong> the whole section can collapse.<br />
To account for the assumptions regarding time <strong>and</strong> homogeneity inherent in LaModel,<br />
users must use some intuition to properly assess the realistic stability <strong>of</strong> the modeled mine<br />
plan. For example, the user needs to consider how the result might change if the material<br />
weakens over time, or if there is some variation in material properties. In an analysis <strong>of</strong> a<br />
massive pillar collapse with LaModel, small changes in material properties <strong>and</strong>/or geometry<br />
can cause large changes in pillar stability. Time dependent behavior or a local<br />
inhomogeneity in the material properties can have a large effect on the real stability <strong>of</strong> the<br />
situation <strong>and</strong> greatly affect the correspondence between the model <strong>and</strong> reality. Therefore, it<br />
is very difficult to “exactly” model unstable mining situations with LaModel; however, the<br />
general instability can easily be modeled.<br />
2.2.5 Pillar <strong>Safety</strong> Factors in LaModel:<br />
Recently, the capability <strong>of</strong> calculating safety factors was added to the LaModel program<br />
(Hardy <strong>and</strong> Heasley, 1996). For the strain-s<strong>of</strong>tening <strong>and</strong> elastic-plastic material models, the<br />
safety factor is calculated as the ratio between the peak strain defined for that particular<br />
element <strong>and</strong> the applied strain:<br />
ep<br />
SF = (2.13)<br />
ea<br />
Where:<br />
SF = <strong>Safety</strong> Factor<br />
e p = Peak Strain<br />
= Applied strain<br />
e a<br />
For the linear elastic model, which has no pre-defined peak stress or strain, the strain safety<br />
factor is set to a default value <strong>of</strong> 10 (in order to adjust the scaling).<br />
Conventionally, safety factors are calculated on a stress basis, rather than a strain basis.<br />
However, stress based calculations can be problematic when determining safety factors in the<br />
post-failure range in LaModel as inappropriate values result for the elastic-plastic <strong>and</strong> strains<strong>of</strong>tening<br />
material models. The strain-based safety factor calculation detailed above yields<br />
values equivalent to the stress-based calculation in the pre-failure range but also gives<br />
- 12 -
appropriate values in the post-failure range for all the materials. <strong>Safety</strong> factors below 1.0<br />
indicate that an element has failed. Values lower than 1.0 provide a measure <strong>of</strong> the amount<br />
<strong>of</strong> strain that has occurred beyond failure. For instance, an element which has compressed to<br />
twice the peak strain will generate a safety factor <strong>of</strong> 0.5. Therefore, the strain-based safety<br />
factor as shown in Equation 2.13 above is used throughout LaModel.<br />
In LaModel, the safety factor is initially calculated for each individual element <strong>and</strong> this<br />
value can be displayed in the output. However, most users desire to know the safety factor<br />
for the entire pillar. In order to provide a pillar safety factor, safety factors from each<br />
individual element comprising a pillar are averaged. This algorithm is easy to implement,<br />
but does not necessarily give a pillar safety factor which equates to the safety factor that<br />
would be determined from a traditional analysis <strong>of</strong> the full stress-strain curve for the pillar.<br />
The safety factor calculation is accurate for the stress-strain curve <strong>of</strong> the individual elements,<br />
but when the element safety factors are averaged over the pillar, the average does not give a<br />
traditional safety factor result.<br />
With strain-s<strong>of</strong>tening elements, the peak stress <strong>and</strong> peak strain are determined from the<br />
insitu coal strength, the coal modulus, <strong>and</strong> the distance <strong>of</strong> the element into the pillar (see<br />
equation 2.10). For the weaker elements at the edge <strong>of</strong> the pillar, the peak stress is reached at<br />
much lower levels <strong>of</strong> strain than the elements in the confined core <strong>of</strong> the pillar. After the<br />
edge elements reach peak stress, they s<strong>of</strong>ten as pillar strain continues <strong>and</strong> the interior<br />
elements move towards failure. At the point <strong>of</strong> peak pillar strength (the “traditional” point <strong>of</strong><br />
failure <strong>and</strong> a unity safety factor) only a few elements in the core <strong>of</strong> the pillar are still in the<br />
elastic range <strong>and</strong> have safety factors greater than one. Thus, the overall safety factor for the<br />
pillar calculated from an average <strong>of</strong> the elements will be much lower than one. The exact<br />
magnitude <strong>of</strong> this reduced safety factor is determined by: the size <strong>and</strong> shape <strong>of</strong> the pillar, the<br />
amount <strong>of</strong> strain-s<strong>of</strong>tening in the elements, <strong>and</strong> the flexibility <strong>of</strong> the rock mass. Since the<br />
pillar elements do not reach peak stress at the same time, the ultimate strength <strong>of</strong> the pillar is<br />
not the sum <strong>of</strong> the ultimate strengths <strong>of</strong> the elements. In particular, the pillar peak stress is<br />
affected by the degree <strong>of</strong> strain s<strong>of</strong>tening input to the elements. (For a pillar made <strong>of</strong> elasticperfectly<br />
plastic materials as generated by the LaModel coal wizard, the peak strength <strong>of</strong> the<br />
pillar will be the weighted sum <strong>of</strong> the peak strength <strong>of</strong> the elements.)<br />
For an individual pillar, a comparison between the pillar stress-strain curve <strong>and</strong> the<br />
averaged pillar safety factor calculated in LaModel can be observed by plotting these values<br />
on the same graph (see Figure 2.3). The exact values for these plots are determined by<br />
calculating the stress value <strong>and</strong> safety factor for each pillar element at various strain values.<br />
Next, at each strain level, the stress values <strong>and</strong> safety factors are weighted by the number <strong>of</strong><br />
each type <strong>of</strong> element in the pillar <strong>and</strong> then finally, the total weighted stress <strong>and</strong> safety factor<br />
values are averaged by the total number <strong>of</strong> elements in the pillar. The plot in Figure 2.3<br />
show the values for a 60 X 70 foot pillar as used in the North Barrier Section <strong>of</strong> the Cr<strong>and</strong>all<br />
Canyon <strong>Mine</strong>. With the amount <strong>of</strong> strain-s<strong>of</strong>tening in the elements <strong>of</strong> this pillar <strong>and</strong> the<br />
dimensions <strong>of</strong> the pillar, the peak stress in the pillar corresponds to a safety factor <strong>of</strong> 0.55,<br />
quite a bit below 1.0. (In the following analysis <strong>of</strong> the Cr<strong>and</strong>all Canyon <strong>Mine</strong>, the pillar<br />
safety factors where adjusted so that the point <strong>of</strong> peak stress corresponded to a pillar safety<br />
factor <strong>of</strong> 1.0. As an example, for this pillar, the pillar safety factor calculated by LaModel<br />
would be divided by 0.55 to get the adjusted safety factor.)<br />
- 13 -
Stress (psi)<br />
4000<br />
3500<br />
3000<br />
2500<br />
2000<br />
1500<br />
1000<br />
500<br />
Pillar Stress-Strain Curve<br />
Average Element <strong>Safety</strong> Factor<br />
Peak Stress, 3343<br />
<strong>Safety</strong> Factor, 0.55<br />
1.8<br />
1.6<br />
1.4<br />
1.2<br />
1.0<br />
0.8<br />
0.6<br />
0.4<br />
0.2<br />
Pillar <strong>Safety</strong> Factor<br />
0<br />
0.0<br />
0.0000 0.0200 0.0400 0.0600 0.0800 0.1000<br />
Strain<br />
Figure 2.3. Stress-strain <strong>and</strong> safety factor curves for the North Barrier 60 X 70 ft pillar.<br />
- 14 -
3. The LaModel Analysis<br />
3.1 Approach<br />
The major effort in this back-analysis was directed toward calibrating the critical rock<br />
mass, gob <strong>and</strong> coal properties to provide the best LaModel simulation <strong>of</strong> what we know<br />
happened at Cr<strong>and</strong>all Canyon <strong>Mine</strong>. Initially, the mine <strong>and</strong> overburden geometries <strong>of</strong> the<br />
Main West area <strong>of</strong> the mine were developed into LaModel mine <strong>and</strong> overburden grids. Then,<br />
the rock mass stiffness was calibrated against the expected abutment load distribution (i.e.,<br />
extent) consistent with empirical averages <strong>and</strong> local experience. Next, the gob behavior was<br />
calibrated to provide reasonable abutment <strong>and</strong> gob loading magnitudes. For the coal<br />
properties, the peak strength was primarily determined from back analyzing a March 10 th<br />
bump in the Main West North Barrier section, <strong>and</strong> the strain-s<strong>of</strong>tening behavior was<br />
optimized from the back-analysis <strong>of</strong> the August 6, 2007, event. Throughout the backanalysis,<br />
a wide range <strong>of</strong> reasonable input parameter values were investigated to optimize the<br />
agreement between the model <strong>and</strong> the observed reality. Also, a number <strong>of</strong> different events<br />
that could have triggered the August 6 th collapse were investigated with the basic model.<br />
3.2 Basic Calibration Points<br />
Knowledge <strong>of</strong> the actual mining conditions <strong>and</strong> the scenarios in which they occurred<br />
served as the basis for calibrating the LaModel model to the reality <strong>of</strong> the mining situation at<br />
Cr<strong>and</strong>all Canyon <strong>Mine</strong>. A number <strong>of</strong> particular locations, situations <strong>and</strong> conditions were<br />
used as distinct calibration points.<br />
3.2.1 Main West:<br />
During the initial mining <strong>of</strong> the Main West section, the pillars were assumed to be stable,<br />
although some difficulties were encountered in this area <strong>and</strong> the safety factor under the<br />
deepest cover was probably not very high (see Figure 3.1). When longwall Panel 12 to the<br />
north <strong>and</strong> Panel 13 to the South were being mined, the abutment stress effects were seen in<br />
the outside entries <strong>of</strong> Main West <strong>and</strong> additional support was installed. When the Main West<br />
section was eventually sealed, some <strong>of</strong> the intersections had fallen <strong>and</strong> the pillars were in<br />
poor shape.<br />
3.2.2 North Barrier:<br />
When the North Barrier Section was initially developed, the section was fairly stable.<br />
Under the lower cover at the western end <strong>of</strong> the section, the pillar retreat was fairly<br />
successful. As the retreat line moved under the deeper cover to the east, pillar line stresses<br />
increased <strong>and</strong> became untenable in the 137-138 crosscut area where a couple <strong>of</strong> pillar rows<br />
were then skipped. After mining a couple <strong>of</strong> pillars between crosscuts 134 <strong>and</strong> 135, a bump<br />
(pillar failure) occurred that effected: the two rows <strong>of</strong> pillars inby, a number <strong>of</strong> pillar ribs <strong>and</strong><br />
the barriers along the bleeder entry, <strong>and</strong> one to two rows <strong>of</strong> pillars outby crosscut 134 (see<br />
Figure 3.2). At this point, the section was ab<strong>and</strong>oned <strong>and</strong> sealed shortly after that.<br />
- 15 -
2000<br />
1600<br />
Model Grid Boundary<br />
1200<br />
1600<br />
2000<br />
2000<br />
1600<br />
1200 1200<br />
1600<br />
2000<br />
2000<br />
1600<br />
0 200 400 600<br />
Figure 3.1 Map <strong>of</strong> the Main West area.<br />
- 16 -
Figure 3.2 Rib <strong>and</strong> pillar failure in the North Barrier section as <strong>of</strong> March 16 th , 2007.<br />
- 17 -
3.2.3 South Barrier:<br />
When the South Barrier section was developed, the section was fairly stable. Also, as the<br />
section retreated to crosscut 142, the conditions were mostly manageable. There were some<br />
signs <strong>of</strong> high stress <strong>and</strong> some bumping noted in the section before the August 6 th , 2007<br />
collapse.<br />
3.2.4 Results <strong>of</strong> The August 6 th Collapse:<br />
Immediately after the August 6 th , 2007, collapse, it appeared that the pillars in the South<br />
Barrier Section inby crosscut 120 had bumped <strong>and</strong> filled the entries with coal. Stress effects<br />
from the collapse were visibly evident in the pillar ribs as far outby as crosscut 116 in the<br />
South Barrier <strong>and</strong> Main West Sections. On the inby end <strong>of</strong> the South Barrier, video from the<br />
drillholes revealed that there was still several feet <strong>of</strong> open entry at the intersections <strong>of</strong> cross<br />
cuts 137-138 <strong>and</strong> entry #2, but that the entries <strong>and</strong> crosscuts were bumped full <strong>of</strong> coal.<br />
Further inby the South Barrier section in the bleeder area at crosscut 142, the entry was half<br />
filled with bumped coal, <strong>and</strong> at the end <strong>of</strong> the bleeder at crosscut 147, the entry was wide<br />
open. Observations made during the rescue operation indicated that the remaining south<br />
barrier had certainly bumped on the north rib <strong>and</strong> subsequent analysis indicates that it may<br />
have completely failed under the deepest cover.<br />
A Richter 3.9 seismic event was associated with the collapse. Subsequent analysis <strong>of</strong> the<br />
initial part <strong>of</strong> this event locates it over the barrier pillar between the Main West <strong>and</strong> South<br />
Barrier sections at about crosscut 143. After the collapse, seismic activity was located along<br />
a North-South line through the whole Main West area around crosscut 120 <strong>and</strong> around<br />
crosscuts 141 to 146.<br />
3.3 The LaModel Grid<br />
The LaModel simulation <strong>of</strong> the Main West area encompassed the entire Main West,<br />
North Barrier <strong>and</strong> South Barrier Sections so that all <strong>of</strong> the areas <strong>of</strong> interest could be included<br />
within one grid. Thus, the west <strong>and</strong> east boundaries <strong>of</strong> the model were set as shown in Figure<br />
3.1. The north <strong>and</strong> south boundaries were established to include the full abutment loading<br />
from both the northern <strong>and</strong> southern longwall mining districts for at least a couple <strong>of</strong> panels.<br />
So, anticipating a symmetric boundary condition, model boundaries were set in the middle <strong>of</strong><br />
the longwall panels, 1-1/2 panels from the north <strong>and</strong> south barriers (see Figure 3.1).<br />
For determining an optimum element size, a number <strong>of</strong> factors were considered. First,<br />
the desired model area shown in Figure 3.1 is approximately 6000 X 4000 ft. Presently,<br />
LaModel is limited to a maximum grid size <strong>of</strong> 1000 X 1000 elements; therefore, the required<br />
element size must be greater than 6 ft. Second, the pillar sizes were examined. The pillars<br />
are 80 X 92 ft on centers in the North Barrier section, 90 X 92 ft on centers in the Main West<br />
section, <strong>and</strong> 80 X 130 ft on centers in the South Barrier section. Also, in this deep cover,<br />
high stress situation, it was desired to have a pillar yield zone that would extend completely<br />
through the 120 ft wide barriers to the north <strong>and</strong> south <strong>of</strong> the room-<strong>and</strong>-pillar sections. So,<br />
considering all <strong>of</strong> these factors, a 10 ft wide element was chosen. This width fits most <strong>of</strong> the<br />
pillar dimensions fairly well <strong>and</strong> can easily span the 6000 ft grid width. Also, with a 10 ft<br />
wide element, the 120 ft wide barrier will only require 12 yield zone elements to reach to the<br />
middle <strong>of</strong> the pillar (two element codes are required to define each yield zone in models<br />
developed for this report).<br />
18
Five <strong>and</strong> 6 ft wide elements were also considered. However, in the case <strong>of</strong> the 5 ft<br />
element, a 5000 ft wide grid would not span the desired model area, it does not fit the pillar<br />
dimensions any better than the 10 ft element, <strong>and</strong> it would take 24 yield elements to represent<br />
the larger barrier pillars. In the case <strong>of</strong> the 6 ft element, a 6000 ft grid just barely spans the<br />
desired model area, it does not fit the pillar dimensions any better than the 10 ft element, <strong>and</strong><br />
it would take 20 yield elements to cover the larger barrier pillars.<br />
In the final grid, 10 ft elements were used <strong>and</strong> overall dimensions were set at 570<br />
elements in the east-west direction <strong>and</strong> 390 elements in the north-south direction with a grid<br />
boundary as shown in Figure 3.1. The actual mine grid was automatically generated from the<br />
AutoCAD mine map <strong>of</strong> the Main West area with some manual editing to enforce 2 element<br />
entry widths <strong>and</strong> rectangular pillars.<br />
For inputting the overburden information to the model, an overburden grid was developed<br />
that was 1500 ft wider on all 4 sides than the model grid <strong>and</strong> used 100 ft wide elements on an<br />
87 X 69 element grid. This overburden grid was then automatically generated from the<br />
AutoCAD topographic lines as shown in Figure 3.1. The result <strong>of</strong> the overburden grid<br />
generation process is the calculated overburden stress on the coal seam as shown in Figure<br />
3.3. In the plotted overburden stress, it can be seen how the laminated model s<strong>of</strong>tens the<br />
effects <strong>of</strong> the ridges <strong>and</strong> valleys in the topography. Also, a couple other points should be<br />
noted in this plot. First, the north-south trending ridge centered over crosscuts 130 in both<br />
the North <strong>and</strong> South Barrier sections dominates the overburden stress. From the center part<br />
<strong>of</strong> this ridge, the overburden stresses drop quickly to both the east <strong>and</strong> west, or both the inby<br />
<strong>and</strong> outby ends <strong>of</strong> the North Barrier, Main West <strong>and</strong> South Barrier Sections. Also, the<br />
slightly higher overburden stress above longwall Panel 12 should be noted. This higher<br />
stress is probably carried to some extent by the abutment onto the North Barrier section.<br />
3.4 Calibrating the Critical Parameters<br />
3.4.1 Determining the Rock Mass Lamination Thickness:<br />
Equation 2.3 was used to determine an appropriate lamination thickness to give a realistic<br />
extent <strong>of</strong> the abutment zone in this model. In this equation, the rock mass was assumed to<br />
have an elastic modulus <strong>of</strong> 3,000,000 psi <strong>and</strong> a Poisson’s ratio <strong>of</strong> 0.25. The coal seam was<br />
assumed to have an elastic modulus <strong>of</strong> 300,000 psi <strong>and</strong> to average 8 ft thick. A “high<br />
average” overburden depth <strong>of</strong> 2000 ft was used resulting in a full abutment extent (Equation<br />
2.1) <strong>of</strong> 416 ft <strong>and</strong> 90% <strong>of</strong> the abutment load (Equation 2.2) within 224 ft. Using a yield zone<br />
depth <strong>of</strong> 40 ft (consistent with the extent <strong>of</strong> yielding actually observed in the model), the<br />
required lamination thickness was calculated as 533 ft. As part <strong>of</strong> the parametric analysis<br />
discussed later, lamination thicknesses <strong>of</strong> 300, 500 <strong>and</strong> 600 ft were investigated. Ultimately,<br />
the 500 ft value appeared to match the observed conditions best <strong>and</strong> was subsequently used<br />
in the optimum model.<br />
For Cr<strong>and</strong>all Canyon <strong>Mine</strong>, Equations 2.1 <strong>and</strong> 2.3 appear to be fairly appropriate. The<br />
mine noted the effects <strong>of</strong> increasing stresses in the Main West section when the adjacent<br />
longwalls were retreating <strong>and</strong> these longwalls are some 430 ft away. Also, the Wasatch<br />
Plateau area <strong>and</strong> the Cr<strong>and</strong>all Canyon <strong>Mine</strong> are known for stiff massive s<strong>and</strong>stones in the<br />
overburden which would help bridge <strong>and</strong> transfer the abutment stresses for considerable<br />
distances <strong>and</strong>, therefore, help justify thicker model lamination.<br />
19
(psi)<br />
2040<br />
1920<br />
1440<br />
Model Grid Boundary<br />
Overburden<br />
Stress<br />
2000<br />
1200<br />
2400<br />
1600<br />
2280<br />
2000<br />
2000<br />
2160<br />
1600<br />
1600<br />
1200<br />
1800<br />
1600<br />
1680<br />
2000<br />
2000<br />
1560<br />
1200<br />
1600<br />
0 200 400 600<br />
1320<br />
1200<br />
Figure 3.3. Overburden stress as calculated by LaModel.<br />
20
3.4.2 Determining the Gob Stiffness:<br />
A number <strong>of</strong> factors were examined to optimize gob loading <strong>and</strong> gob stiffness in the<br />
model. First, Equation 2.4 was used with an 800 ft wide panel at 2000 ft <strong>of</strong> cover <strong>and</strong> an<br />
abutment angle <strong>of</strong> 21º to calculate a critical seam depth <strong>of</strong> 1042 ft. Then, using Equation 2.5,<br />
the laminated overburden model would suggest that an average gob loading <strong>of</strong> 1125 psi<br />
would be appropriate. Next, the gob loading as used in ALPS <strong>and</strong> ARMPS was calculated<br />
using Equation 2.7 with an abutment angle <strong>of</strong> 21º <strong>and</strong> an overburden density <strong>of</strong> 162 lbs/cu ft.<br />
This results in an average gob stress <strong>of</strong> 586 psi <strong>and</strong> a corresponding abutment load <strong>of</strong> 1659<br />
psi. However, with the 2000+ feet <strong>of</strong> overburden the “correction” factor <strong>of</strong> 1.875 was<br />
applied to the abutment load resulting in a suggested average gob loading (Equation 2.8) <strong>of</strong><br />
1362 psi.<br />
From these various calculations <strong>of</strong> gob loading, the average gob stress value <strong>of</strong> 586 psi,<br />
(73% abutment load) as determined by the abutment angle concept, is considered a very<br />
lower bound. The average gob loading <strong>of</strong> 1362 psi, (38% abutment load) as determined by<br />
adjusting the abutment loading by the 1.875 “deep-cover” factor, is considered an upper<br />
bound. The actual gob loading is probably somewhere in between, but choosing the exact<br />
value is very difficult. In this mining situation at the very deepest part <strong>of</strong> the ARMPS deepcover<br />
database, the tendency might be to start on the high end <strong>of</strong> gob loading range,<br />
something in the 1000-1300 psi range, but with the stiff competent overburden at the mine,<br />
the gob loading would tend to be less.<br />
To investigate the appropriate final gob modulus to use in the model, a simple grid was<br />
built <strong>of</strong> the Cr<strong>and</strong>all Canyon <strong>Mine</strong> without any barrier mining in the Main West area. The<br />
depth was set at 2000 ft <strong>and</strong> then various combinations <strong>of</strong> lamination thickness <strong>and</strong> final gob<br />
modulus were input <strong>and</strong> the resultant average gob stress adjacent to the Main West area was<br />
determined. The results <strong>of</strong> this parametric analysis are shown in Table 1 <strong>and</strong> Figure 3.4. In<br />
these results, it is easy to see that, for a given lamination thickness, increasing the final gob<br />
modulus increases the average stress on the gob. Also, it is clear that for a given final gob<br />
modulus, increasing the lamination thickness reduces the average stress on the gob.<br />
In the parametric analysis discussed later, average gob stresses <strong>of</strong> 800 – 1400 psi were<br />
evaluated. Ultimately, gob stress around 900 psi (60% abutment loading) was determined to<br />
be best for matching the observed results. With the 500 ft lamination thickness this gob<br />
stress translates to a final gob modulus <strong>of</strong> 250,000 psi (see Table 1 <strong>and</strong> Figure 3.4).<br />
- 21 -
Table 3.1 Average Gob Stress as a function <strong>of</strong> lamination<br />
thickness <strong>and</strong> final gob modulus.<br />
Final<br />
Modulus<br />
(psi)<br />
Average Gob Stress (psi)<br />
Lamination Thickness<br />
300 ft 500 ft 600 ft<br />
100,000 680 435 365<br />
200,000 1066 763 662<br />
300,000 1305 1012 903<br />
400,000 1467 1198 1094<br />
500,000 1581 1340 1242<br />
600,000 1668 1449 1359<br />
700,000 1735 1538 1455<br />
1800<br />
1600<br />
Average Gob Stress (psi)<br />
1400<br />
1200<br />
1000<br />
800<br />
600<br />
400<br />
200<br />
300 ft Laminations<br />
500 ft Laminations<br />
600 ft Laminations<br />
0<br />
0 100,000 200,000 300,000 400,000 500,000 600,000 700,000 800,000<br />
Final Gob Modulus (psi)<br />
Figure 3.4 Average gob stress as a function <strong>of</strong> lamination thickness <strong>and</strong> final gob modulus.<br />
3.4.3 Determining the Coal Strength:<br />
In determining appropriate coal strength, a couple <strong>of</strong> simple analyses provided significant<br />
insight. The pillars in the Main West Section were certainly stable when they were mined,<br />
<strong>and</strong> the overburden stress plot (Figure 3.3) shows some 2200 psi <strong>of</strong> insitu stress. With 90 X<br />
92 ft centers <strong>and</strong> 20 ft wide openings, the extraction ratio would be 39.1% <strong>and</strong> the assumed<br />
tributary area stress on these pillars would be 3614 psi. Using the Mark-Bieniawski pillar<br />
- 22 -
strength formula, this implies that the insitu coal strength must be at least 943 psi. Similarly,<br />
evaluating the 80 X 92 ft pillars in the North Barrier section <strong>and</strong> the 80 X 130 ft pillars in the<br />
South Barrier section (with 18 ft wide entries), implies a minimum coal strength <strong>of</strong> 965 psi<br />
<strong>and</strong> 813 psi, respectively. This analysis assumes tributary area loading, but with the narrow<br />
panels <strong>and</strong> competent overburden, this may not be the case causing the true pillar loading to<br />
be somewhat less. From underground observations, these pillars did not appear to be too<br />
close to failure on development; <strong>and</strong> therefore, the insitu coal strength could be higher than<br />
the calculated minimum. However, considering that the Main West was showing<br />
considerable weakness when it was eventually sealed, the safety factors on development<br />
were certainly not excessive.<br />
Another simple analysis which can provide some insight is to compare the pillar design in<br />
the North Barrier section to the design in the South Barrier section. Based on the above<br />
analysis, <strong>and</strong> comparing the 965 psi minimum strength in the North Barrier to the 813 psi<br />
minimum strength in the South Barrier implies that the larger pillars in the South Barrier<br />
section provide a 16% stronger design than the pillars in the North Barrier section.<br />
3.4.3.1 Back Analysis <strong>of</strong> North Barrier Bump: Ultimately, the best information for<br />
computing the insitu coal strength at Cr<strong>and</strong>all Canyon <strong>Mine</strong> is the pillar bump that occurred<br />
on March 10 th , 2007, in the North Barrier Section (see Figure 3.2). A back-analysis <strong>of</strong> this<br />
event can provide reasonably reliable insitu coal strength to use in the further analysis <strong>of</strong> the<br />
subsequent collapse. To develop a back-analysis <strong>of</strong> the North Barrier Section bump, a six<br />
step LaModel run was developed to represent the cut sequence leading up to the bump. This<br />
model starts when the pillar retreat line is at crosscut 141, <strong>and</strong> retreats the pillar line one<br />
crosscut per step until the point when the bump occurred (i.e., after the pillars were pulled at<br />
crosscut 134 (see Figure 3.5)). For this back-analysis, Figure 3.2 was used as the primary<br />
calibration objective. This figure indicates that 2 rows <strong>of</strong> pillars inby crosscut 135 failed <strong>and</strong><br />
bumped <strong>and</strong> that 1 to 2 rows <strong>of</strong> pillars outby crosscut 134 failed <strong>and</strong> bumped, also, the<br />
failures appear to be more prevalent towards the north. To calibrate the model, the coal<br />
strength was adjusted until the calculated conditions matched the observed conditions as<br />
closely as possible. Figure 3.5 shows the results <strong>of</strong> this calibration process. (Note: the safety<br />
factors in Figure 3.5 were adjusted so that the peak pillar strength in the North Barrier pillars<br />
corresponds to a safety factor <strong>of</strong> 1.0. This same adjustment was made to all pillar safety<br />
factors plots in this report.)<br />
In the back-analysis <strong>of</strong> the North Barrier bump shown in Figure 3.5, the lamination<br />
thickness was set at 500 ft, the final modulus <strong>of</strong> the gob was set at 300,000 psi, <strong>and</strong> the coal<br />
strength was calibrated to an input value <strong>of</strong> 1325 psi (in the strain s<strong>of</strong>tening equations <strong>of</strong> 2.11<br />
<strong>and</strong> 2.12). For the strain s<strong>of</strong>tening coal behavior, the residual stress was calculated using<br />
equation 2.11 with a factor <strong>of</strong> 0.188 (essentially a 30% reduction from the peak stress), <strong>and</strong><br />
the residual strain was calculated with equation 2.12 using a peak stress multiplication factor<br />
<strong>of</strong> 2. The resultant pillar strength correlates to a Mark-Bieniawski pillar strength with an<br />
insitu coal strength <strong>of</strong> 927 psi.<br />
- 23 -
A. Retreat Line at XC 141<br />
B. Retreat Line at XC 140<br />
C. Retreat Line at XC 139<br />
D. Retreat Line at XC 138<br />
E. Retreat Line at XC 138.5<br />
F. Retreat Line at XC 134<br />
Figure 3.5 Analysis <strong>of</strong> North Barrier bump.<br />
- 24 -
The model results illustrated in Figure 3.5 agree reasonably well with the observed<br />
behavior. When the retreat line is at crosscut 141 (see Figure 3.5A), the model shows that<br />
two pillars on the retreat line have safety factors slightly less than one. This is a pretty<br />
typical response <strong>of</strong> a room-<strong>and</strong>-pillar retreat section. These pillars on the retreat line<br />
(although the model shows failure) may not fail in the short amount <strong>of</strong> time that they are<br />
under this stress condition, <strong>and</strong> <strong>of</strong>ten can be safely extracted. (However, if the section is<br />
allowed to sit idle for a length <strong>of</strong> time, these pillars may indeed fail.) As the North Barrier<br />
Section continues to retreat under deeper cover (the deepest cover is essentially crosscuts<br />
131-132, see Figure 3.1), safety factors on the retreat line decrease. When the retreat line is<br />
at crosscut 138 (see Figure 3.5D & E), the model now shows that two full rows <strong>of</strong> pillars on<br />
the retreat line have safety factors less than one. It was at this point that deteriorating ground<br />
conditions prompted mine personnel to stop recovering pillars, move the section a couple<br />
rows outby, <strong>and</strong> continue retreating. The mine then extracted two pillars between crosscut<br />
134 <strong>and</strong> 135 <strong>and</strong> the bump occurred. In the calibrated model, the extraction <strong>of</strong> the two pillars<br />
between crosscut 134 <strong>and</strong> 135 caused 4 pillars to fail outby, 2 pillars to fail to the north <strong>and</strong><br />
the 4 pillars inby to fail more, or s<strong>of</strong>ten considerably. These calibrated pillar conditions<br />
appear to match the observed conditions in Figure 3.2 fairly well. Also, this response in the<br />
model, where a small mining step causes a large amount <strong>of</strong> failure, is certainly indicative <strong>of</strong> a<br />
dynamic event, such as the bump in this case.<br />
It should also be noted in Figure 3.5, that as the North Barrier Section is retreated,<br />
considerable failure also occurs in the Main West Section. This response was seen in all <strong>of</strong><br />
the calibrated models indicating that if the coal strength is adjusted to fail at the pillar<br />
geometry <strong>of</strong> the bump, then pillars in the Main West will also fail. This reaction seems<br />
entirely reasonable considering that: 1) the pillars in the Main West are only about 2%<br />
stronger than the pillars in the North Barrier Section, 2) the overburden stress is a little<br />
greater over the Main West than either the North or South Barrier sections, <strong>and</strong> 3) the<br />
abutment loading from the North Barrier gob can easily transfer over the intervening 50 ft<br />
wide barrier just as it transfers further inby in the North Barrier section. It is not believed<br />
that this amount <strong>of</strong> failure in the Main West section actually occurred at this time. Some<br />
adjustments to the model to correct this apparent inconsistency in the sequence <strong>of</strong> observed<br />
failure are discussed later in section 3.5.1.<br />
In performing this back-analysis <strong>of</strong> the North Barrier Section with various sets <strong>of</strong><br />
parameter properties (see the parametric analysis section), a couple <strong>of</strong> important points<br />
become evident. First, once the coal strength is reduced in the calibration process to a<br />
development safety factor under the deepest cover <strong>of</strong> 1.4 or less, retreating the pillar line into<br />
the high stress, deep cover area will cause significant pillar failure at the retreat line (at some<br />
point) due to the combination <strong>of</strong> the high development stress from the deep cover <strong>and</strong> the<br />
abutment stress from the retreat line. The exact location <strong>of</strong> the significant pillar failure will<br />
move further west under the shallower cover if the coal is weaker or the failure point will<br />
move further east under the deeper cover if the coal is stronger. Second, it is apparent from<br />
the occurrence <strong>of</strong> the bump, <strong>and</strong> the model definitely indicates, that moving the face two<br />
rows <strong>of</strong> pillars outby the old retreat line was not sufficient to isolate it from the previous<br />
retreat line abutment stresses in the given conditions.<br />
- 25 -
3.5 Analyzing the August 6 th Collapse<br />
Once the optimum lamination thickness <strong>and</strong> gob modulus were developed (within the<br />
given resolution) <strong>and</strong> the coal strength was calibrated from the North Barrier bump, the<br />
parameters were set to use LaModel to back-analyze the August 6 th , 2007, collapse at the<br />
Cr<strong>and</strong>all Canyon <strong>Mine</strong>. For this collapse analysis, a six step model was developed:<br />
1. Development <strong>of</strong> the Main West Section<br />
2. Development <strong>of</strong> the North Barrier Section<br />
3. Final retreat <strong>of</strong> the North Barrier Section<br />
4. Development <strong>of</strong> the South Barrier Section<br />
5. Final retreat <strong>of</strong> the South Barrier Section<br />
6. Final retreat <strong>of</strong> the South Barrier Section, with bump triggers.<br />
When performing this back-analysis, a number <strong>of</strong> critical calibration conditions needed to<br />
be met. For step 1, the Main West Section should be stable on development. Similarly, for<br />
step 2, the North Barrier Section should be stable on development. For step 3, the pillar<br />
failure in the North Barrier Section should be consistent with Figure 3.2. For step 4, the<br />
South Barrier Section should be stable on development. Finally, for Step 6, after the bump<br />
event, pillar failure should cover the middle portion <strong>of</strong> the South barrier Section <strong>and</strong> extend<br />
outby to crosscut 122 to 124. Also, pillar failure (<strong>and</strong> pillar bumps) should extend into the<br />
face area at least to crosscut 138 with some moderate pillar bumping at crosscut 142 (as<br />
indicated by the drillholes).<br />
3.5.1 Primary Results:<br />
The primary results <strong>of</strong> the initial back-analysis model for the Cr<strong>and</strong>all Canyon <strong>Mine</strong> are<br />
shown in Figures 3.6-3.8. Figure 3.6 show the average pillar <strong>and</strong> individual element safety<br />
factors for step 3 which is the March 2007 bump geometry. Figure 3.6a is identical to Figure<br />
3.5f <strong>and</strong> pillar failure in this plot was discussed above. Figure 3.6b shows the individual<br />
element safety factors calculated in the model for the bump geometry (step 3). By examining<br />
the element safety factors, it can be seen that the 50 ft wide barrier between the Main West<br />
<strong>and</strong> the North Barrier sections is indicating substantial failure between crosscut 137 <strong>and</strong><br />
crosscut 144. Figure 3.6 also clearly shows the effect <strong>of</strong> the depth <strong>of</strong> cover on the pillar<br />
safety factors which increase rapidly as the cover drops below 2000 ft west <strong>of</strong> crosscut 145<br />
<strong>and</strong> east <strong>of</strong> crosscut 125. Similarly, under the deepest cover between crosscuts 129 <strong>and</strong> 134,<br />
many pillars have not yet failed but they have very low safety factors <strong>and</strong> are close to failure.<br />
Finally, this figure indicates that the abutment stress from the active retreat gob is one <strong>of</strong> the<br />
primary factors driving the bump <strong>and</strong> the pillar failure; <strong>and</strong> therefore, the pillar failure<br />
radiates out from the active gob area. In addition, the deep cover stress is seen as a<br />
significant factor in propagating the pillar failure to the east.<br />
Figure 3.7 shows the average pillar <strong>and</strong> individual element safety factors calculated by<br />
the model after the South Barrier section was developed <strong>and</strong> retreated to its final<br />
configuration. Several important observations can be made from this figure. First, on<br />
development <strong>and</strong> partial retreat, the pillars in the central portion <strong>of</strong> the South Barrier section<br />
(crosscuts 120–138) are shown to be fairly stable with the lowest safety factors.<br />
- 26 -
1600<br />
1600<br />
2000<br />
1600<br />
1600<br />
A. Pillar <strong>Safety</strong> Factors<br />
2000<br />
1600<br />
1600<br />
B. Element <strong>Safety</strong> Factors<br />
<strong>Safety</strong> Factor<br />
Figure 3.6 Plot <strong>of</strong> pillar <strong>and</strong> element safety factors for step 3.<br />
0.0 0.2 0.4 0.6 0.8 1.0 1.2 1.4 1.6 1.8 2.0<br />
- 27 -
1600<br />
1600<br />
2000<br />
1600<br />
A. Pillar <strong>Safety</strong> Factors<br />
1600<br />
2000<br />
1600<br />
B. Element <strong>Safety</strong> Factors<br />
Pillar <strong>Safety</strong> Factor<br />
1600<br />
Figure 3.7 Plot <strong>of</strong> pillar <strong>and</strong> element safety factors for step 5.<br />
0.0 0.2 0.4 0.6 0.8 1.0 1.2 1.4 1.6 1.8 2.0<br />
- 28 -
1600<br />
1600<br />
2000<br />
1600<br />
A. 3.8% Stronger Coal in Main West<br />
1600<br />
2000<br />
1600<br />
B. 5.7% Stronger Coal in Main West<br />
Pillar <strong>Safety</strong> Factor<br />
1600<br />
0.0 0.2 0.4 0.6 0.8 1.0 1.2 1.4 1.6 1.8 2.0<br />
Figure 3.8 Plot <strong>of</strong> pillar safety factors with coal strength adjusted in Main West.<br />
- 29 -
around 1.2-1.4. As previously noted, these pillars are about 16% stronger than the pillars in<br />
the Main West or North Barrier sections, <strong>and</strong> this stability is undoubtedly a result <strong>of</strong> this<br />
higher strength. Next, it can be seen by examining the pillar safety factors from crosscut<br />
139-145 in the South Barrier section that the stresses from the active retreat line/working<br />
section are fairly isolated from the potentially unstable pillars under the deeper cover to the<br />
east. The retreat line is under relatively shallow cover <strong>and</strong> there are five rows <strong>of</strong> fairly stable<br />
pillars (safety factors up to 1.8) between the active mining <strong>and</strong> the 2000 ft cover line.<br />
Finally, it can be seen by comparing Figure 3.7 with the previous Figure 3.6 that the<br />
small increase in stress from the development <strong>of</strong> the South Barrier section has caused<br />
considerable additional pillar failure in the Main West <strong>and</strong> North Barrier sections. Fourteen<br />
additional pillars have failed in the North Barrier section <strong>and</strong> 46 additional pillars have failed<br />
in the Main West section. There is no evidence to support whether this degree <strong>of</strong> failure<br />
actually did or did not occur. It does not seem reasonable that a failure <strong>of</strong> this magnitude<br />
could have gone unnoticed during development <strong>of</strong> the South Barrier section. However, the<br />
failure may have been very gradual. More likely, the difference in Main West pillar failure<br />
between Figure 3.6 <strong>and</strong> 3.7 was part <strong>of</strong> the collapse on August 6 th . Regardless, this model<br />
response certainly indicates how sensitive the Main West <strong>and</strong> North Barrier geometries are to<br />
any slight change in loading condition.<br />
To maintain general stability in the Main West through the final retreat position <strong>of</strong> the<br />
South Barrier does not take much <strong>of</strong> a change in the model. A 50 psi (3.8%) increase in coal<br />
strength in just the Main West reduces the number <strong>of</strong> failed pillars in the Main West from 76<br />
to 33 (see Figure 3.8a), <strong>and</strong> a 75 psi (5.7%) increase in coal strength reduces the pillar failure<br />
in the Main West to 12 pillars (see Figure 3.8b). However, either <strong>of</strong> these increases in coal<br />
strength in the Main West adversely affects the degree <strong>of</strong> fit to the March 2007 bump, but not<br />
too much (see Figure 3.8). The only strong justification for increasing the strength <strong>of</strong> the<br />
coal in the Main West in the model above the calibrated strength is to postpone the pillar<br />
failure until the August collapse. There is not much physical evidence that the Main West<br />
coal is any different than the coal in the North <strong>and</strong> South Barrier sections. On one h<strong>and</strong>, the<br />
coal in the Main West might be expected to be weaker than in the surrounding sections<br />
because it had been st<strong>and</strong>ing for 10+ years. However, there are a variety <strong>of</strong> possible<br />
explanations for pillars in this area not to exhibit lower strength. For example, the floor may<br />
have yielded enough over time to allow some overburden stress to bridge the section <strong>and</strong><br />
functionally reduce the pillar load or ro<strong>of</strong> falls <strong>and</strong>/or gobbed crosscuts may functionally<br />
provide additional confinement to the pillars. Any number <strong>of</strong> small changes in the loading<br />
condition <strong>of</strong> the Main West section could account for the pillars not failing at exactly the<br />
point indicated by the model. This is one point where the back-analysis model does not<br />
easily/smoothly match the perceived reality <strong>of</strong> the Cr<strong>and</strong>all Canyon <strong>Mine</strong>; however, certainly<br />
a 4-6% increase in the stability <strong>of</strong> the Main West pillars (for any number <strong>of</strong> possible reasons)<br />
would be easily conceivable considering the natural variability <strong>of</strong> the geologic <strong>and</strong> mining<br />
systems.<br />
3.5.2 Triggering the Collapse <strong>of</strong> the South Barrier Section:<br />
It can be seen in Figure 3.7a, that when the pillars in the Main West do start to fail, there<br />
is reluctance for the failure to propagate south past the barrier pillar <strong>and</strong> into the South<br />
Barrier Section. However, we know that this failure did occur on August 6 th . To investigate<br />
what possible conditions may have triggered the collapse, or what conditions or parameter<br />
- 30 -
changes are necessary to replicate the observed South Barrier failure in the model, a number<br />
<strong>of</strong> different trigger scenarios were investigated.<br />
A classic boundary-element technique used to check the stability <strong>of</strong> a potentially unstable<br />
mining plan is to simulate the extraction <strong>of</strong> a few pillars in the model (i.e., cause a small<br />
stress increase) <strong>and</strong> observe the magnitude <strong>of</strong> the resultant changes. In the optimized<br />
Cr<strong>and</strong>all Canyon <strong>Mine</strong> model, four pillars (with a safety factor around 1) were removed<br />
between crosscut 128 <strong>and</strong> 132 on the south side <strong>of</strong> the Main West. The results <strong>of</strong> this<br />
perturbation are shown in Figure 3.9; it can be observed that the removal <strong>of</strong> the pillars has<br />
indeed caused 25 pillars to fail in the South Barrier section between crosscuts 125 <strong>and</strong> 134.<br />
Comparing this figure with Figure 3.7, it can also be observed that additional pillars in the<br />
Main West have failed between crosscut 124 <strong>and</strong> 129, <strong>and</strong> that the stability <strong>of</strong> the barrier<br />
between the sections has greatly decreased. The final pillar failure results shown in the South<br />
Barrier section <strong>of</strong> Figure 3.9 are not quite as extensive as observed in the field, but it does<br />
demonstrate that a relatively small change in the model conditions can cause the pillar failure<br />
to continue into the South Barrier section.<br />
3.5.2.1 Reduced Coal Strength: The next triggering technique was to reduce the coal<br />
strength in the Main West by 50 psi or 3.8%. The results <strong>of</strong> this investigation are shown in<br />
Figure 3.10. Figure 3.10a shows that the small strength reduction has caused 37 pillars to fail<br />
in the South Barrier section between crosscuts 124 <strong>and</strong> 137, also many more pillars have<br />
failed in the Main West section. Figure 3.10b includes the removal <strong>of</strong> four pillars in the<br />
Main West <strong>and</strong> shows that the failure in the South Barrier section has encompassed the face<br />
area (crosscuts 137 to 139) <strong>and</strong> several pillars in the bleeder area (crosscuts 141 to 143). If<br />
Figures 3.8a <strong>and</strong> 3.10a are compared, it can be seen that a 7.7% reduction in the coal strength<br />
<strong>of</strong> the Main West pillars will cause 37 pillars to fail in the South Barrier section <strong>and</strong> 94<br />
additional pillars to fail in the Main West. This large number <strong>of</strong> pillar failures in the model<br />
due to a relatively small decrease in coal strength effectively simulates the observed August<br />
6 th collapse. Seeing these model results, it certainly seems reasonable <strong>and</strong> plausible that the<br />
strength <strong>of</strong> the Main West pillars may have degraded from the effects <strong>of</strong> time <strong>and</strong> the<br />
northern abutment stresses, <strong>and</strong> a massive pillar collapse initiated which swept through the<br />
Main West pillars <strong>and</strong> down through the South Barrier section.<br />
3.5.2.2 Joint Slip: The seismic event that accompanied the August 6 th collapse was<br />
analyzed by personnel at the University <strong>of</strong> Utah Seismological Stations. The seismic signal<br />
was consistent with a collapse event but there was a small component <strong>of</strong> shear. Thus, it<br />
seems plausible that movement along one <strong>of</strong> the pervasive vertical joint surfaces known to<br />
exist on the mine property may have initiated the collapse (or certainly have contributed to<br />
the collapse). In order to simulate this possibility, a simple joint model was added to a<br />
special version <strong>of</strong> LaModel as part <strong>of</strong> this investigation. This joint model simulates a<br />
frictionless vertical plane in the LaModel grid, such that the plane does not allow any transfer<br />
<strong>of</strong> shearing or bending stresses across the joint. Basically, the plane is inserted between two<br />
rows or columns <strong>of</strong> the LaModel grid, <strong>and</strong> the program calculates the modified seam stresses<br />
<strong>and</strong> displacements that result from the addition <strong>of</strong> the joint.<br />
- 31 -
1600<br />
1600<br />
2000<br />
1600<br />
A. Pillar <strong>Safety</strong> Factors<br />
1600<br />
2000<br />
1600<br />
B. Element <strong>Safety</strong> Factors<br />
Pillar <strong>Safety</strong> Factor<br />
1600<br />
0.0 0.2 0.4 0.6 0.8 1.0 1.2 1.4 1.6 1.8 2.0<br />
Figure 3.9 Plot <strong>of</strong> pillar <strong>and</strong> element safety factors for step 6 with 4 pillars removed.<br />
- 32 -
1600<br />
1600<br />
2000<br />
1600<br />
A. Step 5 - South Barrier Retreated<br />
1600<br />
2000<br />
1600<br />
B. Step 6 - 4 Pillars Removed in Main West<br />
Pillar <strong>Safety</strong> Factor<br />
1600<br />
0.0 0.2 0.4 0.6 0.8 1.0 1.2 1.4 1.6 1.8 2.0<br />
Figure 3.10 Plot <strong>of</strong> pillar safety factors for weakened coal in the Main West.<br />
- 33 -
1600<br />
1600<br />
2000<br />
1600<br />
A. Step 5 - South Barrier Retreated with a Fault<br />
1600<br />
2000<br />
1600<br />
B. Step 6 - 2 Pillars Removed in Main West with a Fault<br />
Pillar <strong>Safety</strong> Factor<br />
1600<br />
0.0 0.2 0.4 0.6 0.8 1.0 1.2 1.4 1.6 1.8 2.0<br />
Figure 3.11 Plot <strong>of</strong> pillar safety factors for the model with a joint at crosscut 137.<br />
- 34 -
1600<br />
1600<br />
2000<br />
1600<br />
A. Step 6 - 2 Pillars Removed in Main West<br />
1600<br />
2000<br />
1600<br />
B. Step 7 - 4 Pillars Removed in Main West<br />
Pillar <strong>Safety</strong> Factor<br />
1600<br />
0.0 0.2 0.4 0.6 0.8 1.0 1.2 1.4 1.6 1.8 2.0<br />
Figure 3.12 Plot <strong>of</strong> pillar safety factors for s<strong>of</strong>ter gob in the southern panels.<br />
- 35 -
For the analysis <strong>of</strong> a possible fault trigger, the joint was placed at crosscut 137 <strong>of</strong> the<br />
South Barrier section <strong>and</strong> oriented in a north-south direction between the columns <strong>of</strong> the<br />
LaModel grid. The results <strong>of</strong> this joint analysis are shown in Figure 3.11. Figure 3.11a<br />
indicates that the addition <strong>of</strong> the joint by itself does not cause any failure in the South Barrier<br />
section, but the joint with a couple pillars removed in the Main West causes 35 pillars to fail<br />
in the South Barrier section. This analysis indicates that a sudden change in stresses due to<br />
slip along a joint in the ro<strong>of</strong> certainly could have been a factor in triggering the collapse seen<br />
on August 6 th .<br />
3.5.2.3 S<strong>of</strong>ter Southern Gob: Given that pillars in the South Barrier section are 16%<br />
stronger than the pillars in the North Barrier section <strong>and</strong> 14% stronger than the pillars in the<br />
Main West section, <strong>and</strong> that overburden loading in the south appears a little less than in the<br />
Main West, one would anticipate that pillars in the Main West would have failed before the<br />
South Barrier pillars, as seen in the previous models. This actually may have occurred <strong>and</strong><br />
gone unnoticed, but it is also possible that failure in both areas occurred simultaneously. To<br />
account for this simultaneous failure, it seems reasonable to hypothesize that the abutment<br />
loading from the southern longwall panels may have been higher than the abutment loading<br />
from the northern longwall panels. In the north, longwall panel 12 (see Figure 3.1) was the<br />
last longwall in the northern district, whereas longwall panel 13 to the south <strong>of</strong> the South<br />
Barrier section was the first longwall panel in the southern district. This configuration may<br />
have resulted in a higher abutment load from the southern longwalls, or the southern geology<br />
may have been a little stiffer or more massive causing additional abutment load.<br />
To simulate additional abutment load from the southern longwall, the gob modulus in the<br />
south was reduced from 300,000 psi to 250,000 psi. Nominally, this reduces the average gob<br />
loading from 1013 psi to 888 psi, <strong>and</strong> increases the abutment load from 1187 psi to 1312 psi<br />
(10.5%). The results <strong>of</strong> this loading condition are shown in Figure 3.12 where it can be<br />
clearly seen that the increased southern abutment loading certainly increases the amount <strong>of</strong><br />
failure in the Southern Barrier section. By comparing Figure 3.12b with 3.8a, it can be seen<br />
that the s<strong>of</strong>ter southern gob has caused an additional 23 pillars to fail <strong>and</strong> caused the failure<br />
to encompass the face area in the South Barrier section. Also, the s<strong>of</strong>ter southern gob has<br />
made the South Barrier section more likely to fail as a “natural” extension <strong>of</strong> failure in the<br />
Main West (see Figure 3.12a)<br />
3.6 Parametric Analysis<br />
In order to assess the sensitivity <strong>of</strong> the model results to the input values <strong>and</strong> to determine<br />
the optimum parameter values for matching the observed mine behavior, an extensive<br />
parametric analysis was performed. This analysis examined: 3 different lamination<br />
thicknesses (300 ft, 500ft <strong>and</strong> 600 ft); final gob moduli ranging from 100,000 psi to 700,000<br />
psi; strain-s<strong>of</strong>tening coal strengths ranging from 1150 psi to 1450 psi (corresponding to a<br />
Mark-Bieniawski insitu coal strengths <strong>of</strong> 835 psi to 1115 psi); post-failure residual coal<br />
strength reductions <strong>of</strong> 20%, 30% <strong>and</strong> 40%, <strong>and</strong> several different mechanisms for triggering<br />
the collapse. In all, over 230 models were evaluated.<br />
In a back-analysis, such as this investigation <strong>of</strong> the Cr<strong>and</strong>all Canyon <strong>Mine</strong> collapse, there<br />
are an infinite number <strong>of</strong> parameter combinations that might be analyzed. The resolution <strong>of</strong><br />
each optimized parameter (<strong>and</strong> therefore the accuracy <strong>of</strong> the back-analysis) can always be<br />
- 36 -
further improved. Obviously, there is a practical time constraint <strong>and</strong> also, it is only<br />
reasonable to refine the parameters to within the overall accuracy <strong>of</strong> the general input values.<br />
In this case, with a geo-mechanical model, an accuracy <strong>of</strong> 10-20% seems more than<br />
sufficient. In this back-analysis, the smallest resolution <strong>of</strong> the critical parameters was:<br />
• Lamination Thickness 100 ft<br />
• Final Gob Modulus 50,000 psi<br />
• Coal Strength<br />
25 psi<br />
• Residual Strength Reduction 10%<br />
To investigate the optimum lamination thickness, 300 ft, 500 ft <strong>and</strong> 600 ft thicknesses<br />
were examined (with a fixed rock mass modulus <strong>of</strong> 3,000,000 psi). The 300 ft lamination<br />
thickness has an abutment extent <strong>of</strong> around 180 ft <strong>and</strong>, in general, it showed a relatively local<br />
influence <strong>of</strong> the abutment stresses from the gob areas. The longwall abutment stresses did<br />
not appropriately influence the North <strong>and</strong> South Barrier sections <strong>and</strong> the North Barrier<br />
section gob did not project sufficient abutment stress into the bump area. On the other h<strong>and</strong>,<br />
the 600 ft lamination thickness had an effective (90% <strong>of</strong> abutment load) abutment extent <strong>of</strong><br />
around 235 ft; however, this thickness had a tendency to over-extend the abutment zones <strong>and</strong><br />
cause the coal failures to travel further than observed. Of the three lamination thicknesses<br />
investigated, the 500 ft thickness appeared to be most realistic. If the lamination thickness<br />
were to be further refined, the next selection would be in the 300 to 500 ft range.<br />
A fairly wide range <strong>of</strong> final gob moduli <strong>and</strong> the resultant abutment loads were<br />
investigated. When the abutment loads reached 65-75% <strong>of</strong> the overburden load, it was found<br />
that the North <strong>and</strong> South Barrier sections were beginning to fail on development. Also, this<br />
high abutment loading produced stresses in the barrier sections that were very biased towards<br />
the gob, much more than was actually experienced. On the other end <strong>of</strong> the spectrum, when<br />
the abutment loading was reduced to 30-40% <strong>of</strong> the overburden load, the low abutment stress<br />
ceased to be much <strong>of</strong> a factor in the modeled failure. At this point, the pillar failures were<br />
primarily driven by just the tributary overburden load. In this scenario, very low coal<br />
strengths were required to recreate a wide spread failure in the model. However these low<br />
strength pillars were close to failure on development <strong>and</strong> this behavior was not observed.<br />
The abutment loading was ultimately found to be most realistic in the 55-65% range (highest<br />
in the south) resulting in a final gob modulus between 200,000 <strong>and</strong> 300,000 psi (with the 500<br />
ft lamination thickness).<br />
The coal strengths in the model were readily calibrated using the North Barrier bump<br />
geometry once a lamination thickness <strong>and</strong> abutment loading was determined. The calibrated<br />
coal strength essentially correlated with the modeled abutment loading. Increasing the<br />
abutment load required a corresponding increase in coal strength to calibrate the model.<br />
Conversely, decreasing the abutment load required a decrease in the coal strength for a<br />
realistic calibration. The final optimized strain-s<strong>of</strong>tening coal strength was in the 1300-1400<br />
psi range corresponding to Mark-Bieniawski formula insitu coal strengths <strong>of</strong> 910-980 psi.<br />
The final critical parameter that was investigated in the parametric analysis was the post<br />
failure coal behavior. In this investigation, coal strength reductions <strong>of</strong> 20%, 30% <strong>and</strong> 40%<br />
after pillar failure were examined. Essentially, the magnitude <strong>of</strong> strength reduction<br />
determines the tendency for the pillar failures to propagate (or run) <strong>and</strong> generate a massive<br />
pillar collapse. With the 20% reduction, it was difficult for the model to produce the pillar<br />
- 37 -
un that was observed. The pillars failed, but did not run across large areas <strong>of</strong> the sections.<br />
On the other h<strong>and</strong>, with the 40% reduction in coal strength, the pillar failures ran too far, out<br />
to around crosscut 115. Of the post-failure coal strength reductions examined, the 30% level<br />
produced the best results. If this value were to be further refined, it would be increased in<br />
order to get the pillar failures to spread further outby crosscut 124 in the South Barrier<br />
section as was observed.<br />
The magnitude <strong>of</strong> the post failure reduction in coal strength in this model necessary to<br />
simulate the observed pillar behavior is somewhat surprising. The classic laboratory tests by<br />
Das (1986) would indicate that a 60 ft wide pillar in an 8 ft seam (w/h=7.5) would be close to<br />
elastic, perfectly-plastic behavior <strong>and</strong> would not have much strain-s<strong>of</strong>tening behavior.<br />
Obviously, there was a massive pillar collapse; <strong>and</strong> therefore, the pillars had to exhibit<br />
significant strain-s<strong>of</strong>tening behavior. It is not clear whether this magnitude <strong>of</strong> strains<strong>of</strong>tening<br />
behavior is: typical for a pillar with a width-to-height <strong>of</strong> 7.5, a behavior unique to<br />
the seam at this mine, an effect <strong>of</strong> the bump-type pillar failure, a manifestation <strong>of</strong> the<br />
veracity/dynamics <strong>of</strong> the pillar collapse or has some other explanation.<br />
3.7 Final Back Analysis Model<br />
In the initial model analyzed in section 3.5 above, all <strong>of</strong> the coal <strong>and</strong> gob at different<br />
locations have identical properties. However, it was shown that this assumption causes the<br />
pillars in the Main West section to fail too soon <strong>and</strong> the pillars in the South Barrier to be<br />
difficult to fail. It was also shown that a small (
in to crosscut 146 in the bleeder area. This final model does a fairly good job <strong>of</strong> simulating<br />
most <strong>of</strong> the critical observation <strong>of</strong> the geo-mechanical behavior at the Cr<strong>and</strong>all Canyon <strong>Mine</strong>.<br />
- 39 -
1600<br />
1600<br />
2000<br />
1600<br />
1600<br />
A. Step 3 - North Barrier Bump<br />
2000<br />
1600<br />
1600<br />
B. Step 5 - South Barrier Retreated<br />
Pillar <strong>Safety</strong> Factor<br />
0.0 0.2 0.4 0.6 0.8 1.0 1.2 1.4 1.6 1.8 2.0<br />
Figure 3.13 Final model <strong>of</strong> Cr<strong>and</strong>all Canyon <strong>Mine</strong> – steps 3 & 5.<br />
- 40 -
1600<br />
1600<br />
2000<br />
1600<br />
1600<br />
A. Step 9 - Pillar <strong>Safety</strong> Factors<br />
2000<br />
1600<br />
1600<br />
B. Step 9 - Element <strong>Safety</strong> Factors<br />
<strong>Safety</strong> Factor<br />
Figure 3.14 Final model <strong>of</strong> Cr<strong>and</strong>all Canyon <strong>Mine</strong> - step 9.<br />
0.0 0.2 0.4 0.6 0.8 1.0 1.2 1.4 1.6 1.8 2.0<br />
- 41 -
4. Summary<br />
In this back analysis <strong>of</strong> the Cr<strong>and</strong>all Canyon <strong>Mine</strong>, a six step base model <strong>of</strong> the mining in<br />
the Main West area was initially developed. The mine grid for the model was sized to cover<br />
the entire area <strong>of</strong> interest with a 10 ft element size that sufficiently fit the pillar sizes <strong>and</strong><br />
entry widths. An appropriate overburden grid was also developed. This base model included<br />
a step for each <strong>of</strong> the critical stages in the mining <strong>of</strong> this area: development <strong>of</strong> the Main West<br />
Section, development <strong>of</strong> the North Barrier Section, final retreat <strong>of</strong> the North Barrier Section,<br />
development <strong>of</strong> the South Barrier Section, <strong>and</strong> final retreat <strong>of</strong> the South Barrier Section.<br />
Next, calibrated values for the critical input parameters: rock mass stiffness, gob stiffness<br />
<strong>and</strong> coal strength, were developed. The rock mass stiffness was calibrated against the<br />
expected abutment load distribution (i.e., extent) consistent with empirical averages <strong>and</strong> local<br />
experience. The gob behavior was calibrated to provide reasonable abutment <strong>and</strong> gob<br />
loading magnitudes. The peak strength <strong>of</strong> the coal was primarily determined from back<br />
analyzing the March 10 th bump in the Main West North Barrier section, <strong>and</strong> the strains<strong>of</strong>tening<br />
behavior was optimized from back-analysis <strong>of</strong> the August 6 th , 2007, event.<br />
Throughout this calibration process, a number <strong>of</strong> particular locations, situations, <strong>and</strong><br />
conditions were used as distinct calibration points.<br />
As part <strong>of</strong> calibrating the critical input parameters, a wide range <strong>of</strong> reasonable sets <strong>of</strong><br />
input parameter values were investigated (a parametric study) to optimize agreement between<br />
the model <strong>and</strong> the observed reality, <strong>and</strong> to assess the sensitivity <strong>of</strong> the model results to<br />
changes in the critical input parameters. Also, a number <strong>of</strong> different events that could have<br />
triggered the August 6 th collapse were investigated with the basic model. In total, over 230<br />
different sets <strong>of</strong> input parameters were evaluated, <strong>and</strong> from this extensive analysis a broad<br />
underst<strong>and</strong>ing <strong>of</strong> the factors that affected ground conditions at Cr<strong>and</strong>all Canyon <strong>Mine</strong> was<br />
developed. Also, a pretty clear picture <strong>of</strong> the range <strong>of</strong> reasonable input values for the critical<br />
parameters was developed: lamination thickness, 300-600 ft; gob load, 25-60% <strong>of</strong> insitu load;<br />
coal strength, 1250-1450 psi - 20-40% strain s<strong>of</strong>tening.<br />
In all <strong>of</strong> these models (with different sets <strong>of</strong> lamination thicknesses <strong>and</strong> gob loadings),<br />
once the coal strength was calibrated to the North Barrier bump, LaModel naturally showed<br />
that the pillars in the Main West were also close to failure. Once the South Barrier was<br />
subsequently developed, the model showed that it was very likely for the entire Main West<br />
<strong>and</strong> South Barrier sections to collapse upon the South Barrier development, or just a small<br />
perturbation was needed to initiate the collapse. Different sets <strong>of</strong> lamination thickness <strong>and</strong><br />
coal strength primarily just determined the exact timing <strong>and</strong> extent <strong>of</strong> the collapse. With the<br />
initial base model where all <strong>of</strong> the coal <strong>and</strong> gob in different areas are maintained at the same<br />
strength, the critical input parameters which best matched the known collapse conditions at<br />
the Cr<strong>and</strong>all Canyon <strong>Mine</strong> were: a lamination thickness = 500 ft, a gob load = 40% <strong>of</strong> insitu<br />
load, <strong>and</strong> a coal strength = 1325 psi with 30% strain s<strong>of</strong>tening (see Figures 3.5-3.12).<br />
In the initial optimized base model were all <strong>of</strong> the coal <strong>and</strong> gob have identical properties,<br />
it was noted that the pillars in the Main West section seemed to fail a little too soon (or too<br />
easy) while the pillars in the South Barrier seemed to resist failure. Relaxing the condition<br />
that all <strong>of</strong> the coal <strong>and</strong> gob have the same properties, a final model was developed that fits<br />
the known conditions a bit better than the optimized base model (See Figures 3.13 <strong>and</strong> 3.14).<br />
In this final model, the Main West coal strength was raised to 1400 psi while the rest <strong>of</strong> the<br />
coal strength was lowered slightly to 1300 psi, Also, the south gob load was decreased to<br />
- 42 -
36% <strong>of</strong> insitu load. With these two changes, the final model accurately simulates the March<br />
10 th , 2007 bump <strong>and</strong> minimizes the pillar failure in the Main West at that time. Also, the<br />
final model now more accurately simulates the final August 6 th collapse with the<br />
simultaneous failure <strong>of</strong> 106 pillars in the Main West <strong>and</strong> 59 pillars in the South Barrier<br />
section. The collapse runs from crosscut 123 in the South Barrier section completely through<br />
the active section to crosscut 146 in the South Barrier bleeder area (see Figure 3.14).<br />
5. Conclusions<br />
Based on the extensive back analysis <strong>of</strong> the Cr<strong>and</strong>all Canyon <strong>Mine</strong> using the LaModel<br />
program describe above, <strong>and</strong> with the benefit <strong>of</strong> hindsight from the March bump <strong>and</strong> August<br />
collapse, a number <strong>of</strong> conclusions can be made concerning the mine design <strong>and</strong> the August<br />
6 th collapse.<br />
1) Overall, the Main West <strong>and</strong> adjacent North <strong>and</strong> South Barrier sections were primed for a<br />
massive pillar collapse because <strong>of</strong> the large area <strong>of</strong> equal size pillars with near unity<br />
safety factors. This large area <strong>of</strong> undersized pillars was the fundamental cause <strong>of</strong> the<br />
collapse.<br />
a. The pillars <strong>and</strong> inter-panel barriers in this portion <strong>of</strong> the Cr<strong>and</strong>all Canyon <strong>Mine</strong><br />
essentially constitute a large area <strong>of</strong> similar size pillars. The pillars in the North<br />
Barrier <strong>and</strong> Main West section are essentially the same size <strong>and</strong> strength. Also, the<br />
inter-panel barrier pillars between the Main West section <strong>and</strong> the North <strong>and</strong> South<br />
Barrier sections have a comparable strength (+15%) to the pillars in the sections. The<br />
pillars in the South Barrier section are stronger than the pillars in the North Barrier<br />
<strong>and</strong> Main West sections, but only by about 16%. Therefore, the South Barrier section<br />
pillars might also be included as part <strong>of</strong> the large area <strong>of</strong> equal size pillars. This large<br />
area <strong>of</strong> similar size pillars is one <strong>of</strong> the essential ingredients for a massive pillar<br />
collapse (Mark et al., 1997; Zipf <strong>and</strong> Mark, 1996).<br />
b. The high overburden (2200 ft) was causing considerable development stress on the<br />
pillars in this area <strong>and</strong> bringing pillar development safety factors below 1.4.<br />
c. Considerable longwall abutment stress was overriding the barrier pillars between the<br />
active sections <strong>and</strong> the old longwall gobs. In the north, the abutment stress from<br />
Panel 12 was overriding the North Barrier section <strong>and</strong> in the south the abutment stress<br />
from Panel 13 was overriding the South Barrier Section.<br />
2) The abutment stress from the active North Barrier retreat section was key to the March<br />
10 th bump occurrence <strong>and</strong> the modeling indicated that the North Barrier abutment stress<br />
contributed to the August 6 th pillar collapse.<br />
3) From the modeling, it was not clear exactly what triggered the August collapse. A<br />
number <strong>of</strong> factors or combination <strong>of</strong> factors could have been the perturbation that<br />
initiated the collapse. Likely c<strong>and</strong>idates include: the active retreat mining in the South<br />
- 43 -
Barrier section, r<strong>and</strong>om pillar failure, a joint slip in the overburden, a gradual weakening<br />
<strong>of</strong> the coal over time, a change in the abutment loading, etc. The boundary element<br />
modeling identified a number <strong>of</strong> possible triggers, but by itself could not distinguish the<br />
most likely trigger.<br />
4) LaModel analysis demonstrated that the active pillar recovery mining in the South Barrier<br />
section could certainly have been the trigger that initiated the August collapse; however,<br />
the modeling by itself does not indicate if the active mining was the most likely trigger.<br />
Certainly removing more coal in the South Barrier section contributed to the ultimate<br />
collapse by applying additional load to the outby area that was primed to collapse. In<br />
fact, if the active mining was not the specific trigger on August 6 th , then it is fairly certain<br />
that as the South Barrier section had retreated further under the deeper cover, it would<br />
have eventually triggered the collapse <strong>of</strong> the undersized pillars in the Main West area.<br />
- 44 -
References<br />
Barron, K., 1992, “A Revised Model for Coal Pillars,” Proceedings <strong>of</strong> the Workshop on Coal<br />
Pillar Mechanics <strong>and</strong> Design, Bu<strong>Mine</strong>s IC 9315, p. 144-157.<br />
Chase, F., C. Mark <strong>and</strong> K. Heasley, 2002, “Deep Cover Pillar Extraction in the U.S.<br />
Coalfields,” Proceedings <strong>of</strong> the 21 st International Conference on Ground Control in Mining,<br />
Morgantown, WV, Aug. 6-8, p. 68-80.<br />
Das, M. N., 1986, “Influence <strong>of</strong> Width/Height ratio on Postfailure Behavior <strong>of</strong> Coal,”<br />
International Jounral <strong>of</strong> Mining <strong>and</strong> Geological Engineering, vol. 4, p. 79-87.<br />
Hardy, R. <strong>and</strong> K. A. Heasley, 2006, “Enhancements to the LaModel Stress Analysis<br />
Program”, Society <strong>of</strong> Mining Engineers Annual Meeting, St. Louis, Missouri, March 26-29,<br />
Pre-print 06-067, 7 pp.<br />
Heasley, K. A, 2000, “The Forgotten Denominator, Pillar Loading”, Proceedings <strong>of</strong> the 4 th<br />
North American Rock Mechanics Symposium, Seattle, WA, July 31-Aug. 3, p. 457-464.<br />
Heasley, K. A., 1998, "Numerical Modeling <strong>of</strong> Coal <strong>Mine</strong>s with a Laminated Displacement-<br />
Discontinuity Code", Ph.D. Dissertation, Colorado School <strong>of</strong> <strong>Mine</strong>s, May, 187 pp.<br />
Heasley, K. A. <strong>and</strong> K. Barron, 1988, “A Case Study <strong>of</strong> gate Pillar Response to Longwall<br />
Mining in Bump-Prone Strata,” Proceedings <strong>of</strong> the 3 rd Annual Longwall USA Exhibition <strong>and</strong><br />
Conference, Chicago, MacLean-Hunter, p. 92-105<br />
Karabin, G. <strong>and</strong> M. Evanto, 1999, “Experience with the Boundary-Element Method <strong>of</strong><br />
Numerical Modeling to Resolve Complex Ground Control Problems,” Proceedings <strong>of</strong> the<br />
Second International Workshop on Coal Pillar Mechanics <strong>and</strong> Design, NIOSH IC 9448, p.<br />
89-113.<br />
Mark, C., 1999, “Empirical Methods for Coal Pillar Design,” Proceedings <strong>of</strong> the Second<br />
International Workshop on Coal Pillar Mechanics <strong>and</strong> Design, NIOSH IC 9448, p. 145-154.<br />
Mark, C. <strong>and</strong> F. E. Chase, 1997, “Analysis <strong>of</strong> Retreat Mining Pillar Stability (ARMPS),”<br />
Proceedings <strong>of</strong> New Technology for Ground Control in Retreat Mining, NIOSH IC 9446, p.<br />
17-34.<br />
Mark, C. <strong>and</strong> T. M. Barton, 1997, “Pillar Design <strong>and</strong> Coal Strength,” Proceedings <strong>of</strong> New<br />
Technology for Ground Control in Retreat Mining, NIOSH IC 9446, p. 49-59.<br />
Mark, C., F.E. Chase <strong>and</strong> R. K. Zipf, 1997, “Preventing Massive Pillar Collapses in Coal<br />
<strong>Mine</strong>s,” Proceedings <strong>of</strong> New Technology for Ground Control in Retreat Mining, NIOSH IC<br />
9446, p. 35-48.<br />
- 45 -
Mark, C., 1992, “Analysis <strong>of</strong> Longwall Pillar Stability (ALPS); an update,” Proceedings <strong>of</strong><br />
the Workshop on Coal Pillar Mechanics <strong>and</strong> Design, Bu<strong>Mine</strong>s IC 9315, p. 238-249.<br />
Mark, C., 1990, “Pillar Design Methods for Longwall Mining, Bu<strong>Mine</strong>s IC 9247.<br />
Pappas, D. M. <strong>and</strong> C. Mark, 1993, “Behavior <strong>of</strong> Simulated Longwall Gob Material,”<br />
Bu<strong>Mine</strong>s RI 9458.<br />
Zipf, R. K. <strong>and</strong> C. Mark, 1996, “Design Methods to Control Violent Pillar Failures in Room<strong>and</strong>-Pillar<br />
<strong>Mine</strong>s,” Proceedings <strong>of</strong> the 15 th International Conference on Ground Control in<br />
Mining, Golden, CO, Colorado School <strong>of</strong> <strong>Mine</strong>s, p. 225-264.<br />
Zipf, R. K., 1992, “MULSIM/NL Theoretical <strong>and</strong> Programmer’s Manual,” Bu<strong>Mine</strong>s IC<br />
9321.<br />
- 46 -
Appendix T - Abutment Load Transfer<br />
The magnitude <strong>of</strong> abutment load transferred to mine workings adjacent to a gob area depends on<br />
the mechanical characteristics <strong>of</strong> the gob, the mechanical characteristics <strong>of</strong> the strata, <strong>and</strong> the<br />
extraction geometry (e.g. width, height, <strong>and</strong> overburden depth). Unfortunately, the mechanics <strong>of</strong><br />
caving strata is not well established in the mining literature. Predictions <strong>of</strong> abutment loads <strong>and</strong><br />
load distribution <strong>of</strong>ten rely on empirical relationships derived from field data or rules <strong>of</strong> thumb<br />
based on experience or theory. For example, one rule <strong>of</strong> thumb suggests that abutment loads<br />
would be anticipated at distance up to about one panel width away regardless <strong>of</strong> depth. Another<br />
relates the distance to overburden depth:<br />
W s = 9 .3 h<br />
where W s = width <strong>of</strong> the side abutment (or influenced zone), feet<br />
h = overburden depth, feet<br />
Experience has shown that these approaches provide useful insight. However, predictions <strong>of</strong><br />
magnitude <strong>and</strong> distribution become much more reliable when they are based on mine-specific<br />
measurements <strong>and</strong> observations.<br />
Between June 1995 <strong>and</strong> January 1996, Neil & Associates (NAA) conducted field studies in the<br />
6 th Right yield-abutment gateroad system at Cr<strong>and</strong>all Canyon <strong>Mine</strong>. This study provided data on<br />
ground behavior including information relative to abutment stress transfer. Measurements<br />
indicated that stress changes due to abutment loading could be detected at a distance <strong>of</strong> more<br />
than 280 feet ahead <strong>of</strong> the advancing longwall face. Similarly, changes were measured adjacent<br />
to the extracted panel (side abutment loads) more than 170 feet away. These measurements were<br />
made at a location beneath 1,100 feet <strong>of</strong> overburden.<br />
T-1
Appendix U - Coal Properties Input<br />
Agapito Associates Inc. (AAI) assigned calculated coal properties using a “method <strong>of</strong> slices”<br />
approach to approximate the load bearing capacity <strong>of</strong> pillars in LaModel. The method assumes<br />
that the strength <strong>of</strong> a pillar element is a function <strong>of</strong> its distance from the nearest rib. AAI<br />
modeled the Cr<strong>and</strong>all Canyon <strong>Mine</strong> workings using 5-foot elements. As illustrated in Table 15,<br />
eight sets <strong>of</strong> peak <strong>and</strong> residual strength values were calculated to correspond to depths up to 37.5<br />
feet from a pillar rib. These parameters were determined using the following relationships:<br />
x<br />
σ = [0.71 1.74( )]<br />
(Equation 1)<br />
v<br />
S i<br />
+<br />
where σ v = Confined coal strength<br />
S i = In situ coal unconfined strength<br />
x = Distance from the nearest rib<br />
h = Pillar height<br />
ε<br />
v<br />
= σ<br />
v<br />
/ E<br />
(Equation 2)<br />
where ε v = Peak strain<br />
σ v = Confined coal strength<br />
E = Coal elastic modulus<br />
σ<br />
r<br />
= 0 .2254 × ln( x)<br />
× σ v<br />
(Equation 3)<br />
where σ r = Residual stress<br />
x = Distance from the nearest rib, <strong>and</strong><br />
σ v = Confined coal strength<br />
ε<br />
r<br />
= 4 × ε v<br />
(Equation 4)<br />
where ε r = Residual strain<br />
ε v = Peak strain.<br />
h<br />
Table 15 - LaModel Confined Coal Strength<br />
These relationships are very similar to those that Karabin <strong>and</strong> Evanto 14 proposed to be used as a<br />
first approximation <strong>of</strong> stress <strong>and</strong> strain values for a strain s<strong>of</strong>tening coal model. AAI used a<br />
constant <strong>of</strong> 0.71 in the confined coal strength formula whereas Karabin <strong>and</strong> Evanto used 0.78.<br />
Also, Karabin <strong>and</strong> Evanto used two points to define the post-peak slope <strong>of</strong> the stress-strain curve<br />
whereas AAI used only one. As illustrated in Figure 114, the slope <strong>of</strong> the post-peak curve that<br />
U-1
AAI used departs somewhat from that proposed by Karabin <strong>and</strong> Evanto. However, this approach<br />
is reasonable given the assumptions inherent in using strain s<strong>of</strong>tening properties. Karabin <strong>and</strong><br />
Evanto acknowledged that information was lacking at the time that they wrote their paper:<br />
“The strain-s<strong>of</strong>tening approach has been identified as a reasonable method <strong>of</strong><br />
describing coal seam behavior. While that concept has been widely discussed,<br />
little specific information is available concerning the actual construction <strong>of</strong> a<br />
strain-s<strong>of</strong>tening model.”<br />
Unfortunately, little research has been done to improve our underst<strong>and</strong>ing <strong>of</strong> strain-s<strong>of</strong>tening<br />
behavior in coal since this was written.<br />
Elastic<br />
Stress-Strain<br />
Relationship<br />
Strain-S<strong>of</strong>tening<br />
Model<br />
Peak Strength - σ v<br />
AAI Unloading Path (i.e. from peak values<br />
directly to second residual values <strong>of</strong> σ <strong>and</strong> ε)<br />
Peak<br />
Strain<br />
ε p<br />
First<br />
Residual<br />
Strain<br />
ε r1<br />
First Residual Strength - σ r1<br />
Second Residual Strength - σ r2<br />
Stress (psi)<br />
Second<br />
Residual<br />
Strain<br />
ε r2<br />
Strain<br />
Figure 114 - General Strain-S<strong>of</strong>tening Element Characteristics<br />
Traditionally, strain s<strong>of</strong>tening properties have been deployed in a displacement-discontinuity<br />
pillar model as a series <strong>of</strong> concentric rings with the weakest material on the perimeter <strong>and</strong><br />
progressively stronger materials approaching the center (see Figure 115) 14 . In reality, pillar<br />
corners experience less confinement <strong>and</strong>, therefore, have lower peak strengths. However, this<br />
simplification (i.e., not considering corner effects) has proven to be generally acceptable. At<br />
least one BEM program, BESOL, assigned yielding properties in this manner when the user<br />
elected to use the program’s “automatic yield allocation” feature.<br />
U-2
I<br />
I<br />
I<br />
I<br />
I<br />
I<br />
I<br />
I<br />
I<br />
I<br />
I<br />
I<br />
I<br />
I<br />
I<br />
I<br />
I<br />
I I<br />
I<br />
I I<br />
I I<br />
I<br />
I I<br />
I<br />
I<br />
H<br />
H<br />
H H<br />
H<br />
H H<br />
H H<br />
H<br />
H H<br />
H<br />
I<br />
H<br />
H<br />
H<br />
H<br />
G<br />
G<br />
G<br />
G<br />
G G<br />
G G<br />
G<br />
G<br />
G<br />
F<br />
F<br />
F<br />
F F<br />
F F<br />
F<br />
F<br />
G<br />
F<br />
E<br />
E<br />
E E<br />
E E<br />
E<br />
F<br />
G<br />
F<br />
E<br />
H<br />
G<br />
H<br />
G<br />
H<br />
G<br />
H<br />
H<br />
H<br />
H<br />
G<br />
G<br />
F<br />
E<br />
F<br />
E<br />
F<br />
E<br />
F<br />
F<br />
D<br />
D<br />
D<br />
D<br />
D<br />
C<br />
C<br />
C<br />
D<br />
C<br />
B<br />
C<br />
D<br />
C<br />
C<br />
C<br />
D<br />
D<br />
D<br />
D<br />
E<br />
E<br />
E<br />
E<br />
E<br />
D<br />
D<br />
D<br />
D<br />
D<br />
E<br />
E<br />
E<br />
E E<br />
E E<br />
E<br />
F<br />
F<br />
F<br />
F<br />
F<br />
F<br />
G<br />
F<br />
F<br />
F<br />
F F<br />
F F<br />
F<br />
F<br />
G<br />
G<br />
G<br />
G<br />
G G<br />
G G<br />
G<br />
G<br />
G<br />
G<br />
G<br />
G<br />
G<br />
G<br />
G<br />
G<br />
G<br />
G<br />
G<br />
H<br />
H<br />
H<br />
H<br />
H<br />
H<br />
H<br />
H<br />
H<br />
H<br />
H<br />
H<br />
H H<br />
H<br />
H H<br />
H H<br />
H<br />
H H<br />
H<br />
H<br />
I<br />
I I<br />
I I<br />
I<br />
I I<br />
I I<br />
I<br />
I I<br />
I I<br />
I<br />
I<br />
I<br />
I<br />
I<br />
I<br />
I<br />
I<br />
I<br />
I<br />
I<br />
Figure 115 - Traditional Strain-S<strong>of</strong>tening Element Distribution<br />
The LaModel preprocessor, LamPre, has an automatic yield property allocation feature.<br />
However, the “apply yield zone” utility in LaModel distributes properties in the manner<br />
illustrated in Figure 116. This distribution provides a separate element designation (i.e., letter<br />
code) for corners so that modeled pillar strengths can be more consistent with empirically<br />
derived pillar strength formulas <strong>and</strong> the assumed stress gradient.<br />
LaModel provides up to 26 different material property inputs. These properties can be deployed<br />
manually in any manner deemed appropriate by the user. However, LamPre’s automatic<br />
yielding property allocation utility limits the depth <strong>of</strong> yielding to 4 elements. Although the<br />
utility utilizes nine material properties, the depth <strong>of</strong> the yield zone is still limited to four elements<br />
deep. One <strong>of</strong> the nine codes represents linear elastic behavior, four represent yielding ribs, <strong>and</strong><br />
four are slightly lower strength yielding elements used to more accurately represent reduced<br />
corner confinement.<br />
Models constructed by AAI utilized eight strain-s<strong>of</strong>tening material properties (as shown in Table<br />
1 <strong>of</strong> AAI’s July 2006 report). These properties are consistent with equations 2 through 5 using in<br />
situ coal strength (S i ) <strong>of</strong> 1640 psi <strong>and</strong> element depths (from the ribline) from 2.5 to 37.5 feet.<br />
However, the properties actually were deployed in AAI’s models as illustrated in Figure 116.<br />
One result <strong>of</strong> this element configuration is to limit the maximum depth <strong>of</strong> pillar yielding to 20<br />
feet when 5-foot elements are used. Another is to substantially increase the modeled pillar<br />
strength beyond the value that traditional pillar strength formulae (such as those used to<br />
determine Equation 2) would predict.<br />
U-3
I<br />
H<br />
H<br />
H<br />
H<br />
H<br />
H<br />
G<br />
F<br />
F<br />
F<br />
F<br />
H H<br />
H H<br />
H<br />
H H H<br />
H<br />
H H<br />
H H<br />
F<br />
F<br />
F F<br />
F<br />
F F F<br />
F<br />
F F<br />
F<br />
E<br />
D<br />
D D<br />
D<br />
D D D<br />
D<br />
D D<br />
E<br />
D<br />
D<br />
D<br />
C<br />
B<br />
B<br />
B<br />
B B B<br />
B<br />
B<br />
B<br />
A<br />
A<br />
A<br />
A A A<br />
A<br />
A<br />
B<br />
A<br />
A<br />
A<br />
A A A<br />
A<br />
A<br />
C<br />
B<br />
B<br />
D<br />
F<br />
D<br />
D<br />
G<br />
F<br />
F<br />
F<br />
I<br />
H<br />
H<br />
H<br />
H<br />
H<br />
H<br />
H<br />
H<br />
H<br />
H<br />
H<br />
H<br />
H<br />
H<br />
I<br />
F<br />
F<br />
F<br />
F<br />
F<br />
F<br />
F<br />
F<br />
G<br />
H<br />
D<br />
B<br />
A<br />
A<br />
A<br />
A<br />
A<br />
A<br />
A<br />
A<br />
B<br />
D<br />
F<br />
D<br />
D<br />
D<br />
D<br />
D<br />
D<br />
B<br />
B<br />
B<br />
B<br />
A<br />
A<br />
A<br />
A<br />
A<br />
A<br />
A<br />
A<br />
A<br />
A<br />
A<br />
A<br />
A<br />
A<br />
A<br />
A<br />
A<br />
A<br />
A<br />
A<br />
A<br />
A<br />
A<br />
A<br />
A A A<br />
A<br />
A<br />
A<br />
A<br />
A<br />
B<br />
A<br />
A<br />
A<br />
A A A<br />
A<br />
A<br />
C<br />
B<br />
B<br />
B<br />
B B B<br />
B<br />
B<br />
B<br />
B<br />
B<br />
B<br />
B<br />
C<br />
D<br />
D<br />
D<br />
D<br />
D<br />
D<br />
F<br />
F<br />
F<br />
F<br />
F<br />
F<br />
E<br />
D<br />
D D<br />
D<br />
D D D<br />
D<br />
D D<br />
E<br />
F<br />
F F<br />
F F<br />
F<br />
F F F<br />
F<br />
F F<br />
H G<br />
H H<br />
H H<br />
H<br />
H H H<br />
H<br />
H H<br />
H H<br />
H<br />
H<br />
H<br />
H<br />
H<br />
H<br />
H<br />
H<br />
H<br />
I<br />
Figure 116 - Strain-S<strong>of</strong>tening Element Distribution to Account for Corner Effects (as Deployed by AAI)<br />
If eight elements (“B” through “I”) are assigned yielding (e.g., strain-s<strong>of</strong>tening properties), as<br />
distributed <strong>and</strong> shown in Figure 115, any pillar 16 elements wide or less would be comprised <strong>of</strong><br />
“yieldable” elements. If 5-foot wide elements are employed, pillars up to 80 feet would be<br />
capable <strong>of</strong> yielding <strong>and</strong> transferring load to adjacent pillars once the peak strengths <strong>of</strong> the<br />
elements within the pillar were exceeded. In contrast, the same properties distributed as shown<br />
in Figure 116 will provide full yielding only for pillars up to 8 elements wide, which is 40 feet in<br />
width (8 elements x 5 feet/element). The group <strong>of</strong> elements labeled “A” in Figure 116<br />
corresponds to linear elastic elements that have no peak strength <strong>and</strong> cannot transfer load to<br />
adjacent structures. In effect, any pillar over 40 feet in width will be represented in the model<br />
with a linearly elastic core that will not fail.<br />
U-4
Appendix V - Rock Mass Properties<br />
AAI indicated in a written response to the investigation team that the rock mass modulus was<br />
modified from 1x10 6 psi used in their calibrated EXPAREA model to 2x10 6 psi to account for<br />
the reduced stiffness introduced by the laminated rock mass used in LaModel. However, the<br />
engineer who conducted the work subsequently indicated that he had used the default elastic<br />
modulus in LamPre (i.e. 3x10 6 psi) <strong>and</strong> evaluated the response <strong>of</strong> their model to lamination<br />
thicknesses <strong>of</strong> 25 <strong>and</strong> 50 feet. He noted no difference between the two thickness values <strong>and</strong><br />
opted to use 25 feet thereafter.<br />
In his dissertation, Heasley 5 provides equations that represent the relationship between<br />
convergence in the laminated overburden used in LaModel <strong>and</strong> homogeneous elastic rock masses<br />
used in other boundary element models. First, he notes that the seam convergence across a twodimensional<br />
slot for the laminated model (s l ) as a function <strong>of</strong> the distance from the panel<br />
centerline (x) can be determined as:<br />
2)<br />
12(1 −ν<br />
q 2 2<br />
s l<br />
( x)<br />
=<br />
( L − x )<br />
Equation 1<br />
t E<br />
where: s = seam convergence,<br />
x = distance from the panel centerline,<br />
υ = rock mass Poisson’s ratio,<br />
t = layer or lamination thickness,<br />
q = overburden stress,<br />
E = rock mass elastic modulus, <strong>and</strong><br />
L = half width <strong>of</strong> longwall panel.<br />
A comparable equation for convergence in a homogeneous, isotropic, elastic overburden (s h ) is<br />
provided by Jaeger <strong>and</strong> Cook 27 :<br />
2 q 2 2<br />
s h<br />
( x)<br />
= 4(1 −ν ) ( L − x )<br />
Equation 2<br />
E<br />
Heasley equates these relationships <strong>and</strong> solves for the lamination thickness (t) corresponding to<br />
the convergence at the center <strong>of</strong> the panel (x=0):<br />
2)<br />
12(1 −ν<br />
q 2<br />
2 q<br />
s<br />
l<br />
(0) = L = 4(1 −ν<br />
) L = s h<br />
(0)<br />
Equation 3<br />
t E<br />
E<br />
Assuming that the elastic modulus in both cases is constant, the result is:<br />
3 L<br />
t =<br />
Equation 4<br />
4<br />
2<br />
1−ν<br />
However, in the present case, AAI increased the modulus threefold. To account for dissimilar<br />
moduli, equations 1 <strong>and</strong> 2 can be solved in a similar manner to yield the following relationship:<br />
3 EHOMOGENEOUS<br />
L<br />
t =<br />
Equation 5<br />
4 E<br />
2<br />
LAMINATED 1−ν<br />
Equation 5 indicates that the required thickness is reduced by a factor <strong>of</strong> three as a result <strong>of</strong><br />
increasing the rock mass modulus for the laminated model. However, if we assume a panel halfwidth<br />
<strong>of</strong> 117 meters (385 feet or half the width <strong>of</strong> an average 770-foot wide longwall panel), the<br />
estimated lamination thickness is 35 meters (115 feet) which is more than four times greater than<br />
the 25-foot thickness that AAI used. The effect <strong>of</strong> thin laminations is that stress will be<br />
concentrated more at the edges <strong>of</strong> openings rather than be distributed farther away.<br />
V-1
Appendix W - <strong>MSHA</strong> Main West 2006 ARMPS<br />
As part <strong>of</strong> a plan review involving the AAI August 2006 analysis for pillar recovery in the Main<br />
West North <strong>and</strong> South Barriers inby crosscut 107, <strong>MSHA</strong> District 9 conducted an independent<br />
ARMPS study. Based on the 9 Left – 1 st North pillar recovery panel, <strong>MSHA</strong> established that a<br />
minimum ARMPS PStF should be 0.42. To assess the North Barrier section pillar recovery, a<br />
model was constructed where the sealed portion <strong>of</strong> the Main West entries <strong>and</strong> the North Barrier<br />
section entries were combined to form the 9-entry geometry shown in Figure 117. The projected<br />
South Barrier section pillar recovery was also studied. In a manner similar to the North Barrier<br />
section, the South Barrier section pillar recovery was modeled as the 9-entry geometry shown in<br />
Figure 118 where Main West <strong>and</strong> South Barrier section pillars are combined.<br />
In the North Barrier section analysis, the pillar extraction row included all nine entries as if pillar<br />
recovery included extracting pillars from Main West <strong>and</strong> the barrier separating Main West <strong>and</strong><br />
the North Barrier section. In the South Barrier section analysis, the pillar extraction row also<br />
included all nine entries with the barrier separating Main West <strong>and</strong> the South Barrier section<br />
modeled as an extracted section pillar. This layout generates low pillar stability values in order<br />
to model a worse case scenario, considering that only two pillars per row were to be recovered in<br />
the North <strong>and</strong> South Barrier sections, <strong>and</strong> not eight pillars per row as modeled by <strong>MSHA</strong>. The<br />
<strong>MSHA</strong> Main West 2006 analysis did not address barrier pillar stability factors.<br />
At 2,000 feet <strong>of</strong> overburden, the <strong>MSHA</strong> Main West 2006 ARMPS pillar stability values are<br />
under the 0.42 <strong>MSHA</strong> derived minimum criteria for the pillar stability values. The <strong>MSHA</strong><br />
analysis led to further discussion between Owens <strong>and</strong> GRI concerning the AAI study. After<br />
discussing <strong>MSHA</strong>’s concerns with GRI, Owens agreed with AAI’s analysis.<br />
At the time <strong>of</strong> the <strong>MSHA</strong> 2006 study, 80 x 92-foot center pillars were proposed for the South<br />
Barrier section. <strong>MSHA</strong> District 9 did not run ARMPS studies for the as-mined South Barrier<br />
section pillar design having 80 x 130-foot center pillars <strong>and</strong> a 40-foot barrier slab cut.<br />
W-1
Figure 117 - North Barrier <strong>MSHA</strong> 2006 ARMPS Model<br />
W-2
Figure 118 - South Barrier <strong>MSHA</strong> 2006 ARMPS Model<br />
W-3
Appendix X - <strong>Mine</strong> Ventilation Plan<br />
The mine ventilation plan in effect at the time <strong>of</strong> the accident was submitted January 5, 2006,<br />
<strong>and</strong> approved on July 27, 2006. The plan superseded all previously approved ventilation plans<br />
with exception <strong>of</strong> amendments for pillar recovery in South Mains, sealing <strong>of</strong> 1 st South Mains <strong>and</strong><br />
South Mains, <strong>and</strong> the ventilation map accepted on July 6, 2007. At the time <strong>of</strong> the accident,<br />
pillar recovery in South Mains had been completed. The approved plan to seal 1 st South Mains<br />
<strong>and</strong> South Mains had not been implemented.<br />
The plans to develop <strong>and</strong> recover pillars in the Main West barrier pillars consisted <strong>of</strong> five<br />
separate plan amendments. Separate plans were submitted for the development <strong>and</strong> recovery <strong>of</strong><br />
each barrier <strong>and</strong> a site specific plan for the drilling <strong>of</strong> drainage boreholes into an adjacent sealed<br />
area. An amendment to permanently seal the North Barrier section was also submitted. A<br />
description <strong>of</strong> each amendment follows.<br />
The amendment to the ventilation plan for the development <strong>of</strong> the North Barrier section dated<br />
November 10, 2006, was received by <strong>MSHA</strong> on November 15, 2006, <strong>and</strong> was approved on<br />
November 21, 2006. The plan states that a separate ro<strong>of</strong> control plan amendment would be<br />
submitted. Four entries were projected into the North Barrier. Entries were numbered from left<br />
to right with Nos. 1 <strong>and</strong> 2 entries projected to be intake air courses, No. 3 entry was projected as<br />
the isolated section belt, <strong>and</strong> No. 4 entry was projected as the return air course. The intake air<br />
split ventilated the Main West seals prior to ventilating the working section. The seals were to<br />
be examined in accordance with 30 CFR 75.360(b)(5).<br />
The ventilation plan amendment to recover pillars in the North Barrier section was dated <strong>and</strong><br />
received by <strong>MSHA</strong> on February 3, 2007, <strong>and</strong> was approved February 9, 2007. The plan required<br />
a measurement point location (MPL) to be established at the deepest point <strong>of</strong> penetration or at<br />
the edge <strong>of</strong> accumulated (ro<strong>of</strong>ed) water. The mine map provided after the accident indicated that<br />
mining was stopped short <strong>of</strong> the location shown on the approved plan. Pillar recovery was<br />
initiated approximately 92 feet inby crosscut 158. Measurements indicating the quantity, quality,<br />
<strong>and</strong> direction <strong>of</strong> air at the MPL were not recorded in the weekly examination record book as<br />
required by 30 CFR 75.364.<br />
A ventilation plan amendment to drill boreholes between the North Barrier section <strong>and</strong> the sealed<br />
portion <strong>of</strong> Main West dated February 8, 2007, was approved February 14, 2007. The stated<br />
intent <strong>of</strong> the boreholes was to drain any water that may accumulate in the North Barrier section<br />
into the sealed portion <strong>of</strong> Main West.<br />
The ventilation plan amendment to seal the North Barrier section dated March 14, 2007, was<br />
received by <strong>MSHA</strong> on March 15, 2007, <strong>and</strong> provisionally approved on March 16, 2007. The<br />
plan specifies that cementitious foam alternative seals would be installed in the four entries <strong>of</strong><br />
the North Barrier section between crosscuts 118 <strong>and</strong> 119. The stoppings in crosscut 118 were<br />
removed to establish ventilation across the seal line.<br />
The ventilation plan amendment to develop entries in the Main West South Barrier was received<br />
by <strong>MSHA</strong> on March 22, 2007, <strong>and</strong> approved on March 23, 2007. Four entries were projected<br />
into the Main West South Barrier. The No. 1 entry was projected to be an intake air course,<br />
Nos. 2 <strong>and</strong> 3 entries were projected as the section belt <strong>and</strong> common entries, <strong>and</strong> No. 4 entry was<br />
projected as the return air course.<br />
X-1
The ventilation plan amendment to recover pillars in the South Barrier section dated May 16,<br />
2007, was received by <strong>MSHA</strong> on May 21, 2007, <strong>and</strong> approved on June 1, 2007. The plan<br />
allowed pillar recovery between the Nos. 1 <strong>and</strong> 3 entries, <strong>and</strong> slabbing <strong>of</strong> the barrier south <strong>of</strong> the<br />
No. 1 entry (except between crosscuts 139 <strong>and</strong> 142). The ventilation plan depicted pillar<br />
recovery between the No. 1 <strong>and</strong> No. 2 entries <strong>and</strong> slabbing <strong>of</strong> the barrier to the south between<br />
crosscuts 139 to 142. However, the approved ro<strong>of</strong> control plan was revised to afford additional<br />
protection to the bleeder system by not permitting any pillar recovery between crosscuts 139 <strong>and</strong><br />
142, including slab cuts from the barrier (refer to South Barrier Section - Pillar Recovery Plan).<br />
The plan amendment approved June 1, 2007, shows an MPL location at the inby end <strong>of</strong> the<br />
bleeder entry as well as an alternate MPL location if water was allowed to accumulate. A copy<br />
<strong>of</strong> this amendment is included at the end <strong>of</strong> this appendix. The alternate location was to be at<br />
“the edge <strong>of</strong> accumulated (ro<strong>of</strong>ed) water.” The plan also states that “Entries will be maintained<br />
to keep the entries free <strong>of</strong> st<strong>and</strong>ing water in excessive depths which would prevent safe travel.”<br />
Mining was conducted approximately 40 feet inby crosscut 149.<br />
Mining conducted inby the last crosscut did not provide for an MPL to be established at the<br />
deepest point <strong>of</strong> penetration as required in the approved plan. The bleeder entry did not extend<br />
to the deepest point <strong>of</strong> penetration. Measurements indicating the quantity, quality <strong>and</strong> direction<br />
<strong>of</strong> the MPL were not recorded in the weekly examination record book as required by<br />
30 CFR 75.364.<br />
A revised ventilation map dated June 2007 was received by <strong>MSHA</strong> on July 2, 2007. Mining<br />
development was shown to crosscut 141 <strong>of</strong> the South Barrier section. The map depicted the<br />
section as being ventilated with 51,546 cubic feet per minute (cfm) <strong>of</strong> intake air at crosscut 121.<br />
The section regulator between crosscuts 107 to 108 is shown with an air quantity <strong>of</strong> 60,687 cfm.<br />
The return air includes 11,980 cfm <strong>of</strong> belt air being dumped through a regulator adjacent to the<br />
number 6 belt drive. The intake <strong>and</strong> return quantities on the map are also recorded in the weekly<br />
examination book for the week ending June 23, 2007 under the location “Main West #139-#39.”<br />
X-2
X-3
X-4
X-5
X-6
X-7
X-8
Appendix Y - Glossary <strong>of</strong> Mining Terms as used in this <strong>Report</strong><br />
Abutment - In coal mining, (1) the weight <strong>of</strong> the rocks above a narrow roadway is transferred to<br />
the solid coal along the sides, which act as abutments <strong>of</strong> the arch <strong>of</strong> strata spanning the roadway;<br />
<strong>and</strong> (2) the weight <strong>of</strong> the rocks over a longwall face is transferred to the front abutment, that is,<br />
the solid coal ahead <strong>of</strong> the face <strong>and</strong> the back abutment, that is, the settled packs behind the face.<br />
Act - The Federal <strong>Mine</strong> <strong>Safety</strong> <strong>and</strong> <strong>Health</strong> Act <strong>of</strong> 1977.<br />
Active workings - Any place in a coal mine where miners are normally required to work or<br />
travel.<br />
Advance - Mining in the same direction, or order <strong>of</strong> sequence; first mining as distinguished from<br />
retreat.<br />
Agent – Any person charged with responsibility for the operation <strong>of</strong> all or a part <strong>of</strong> a coal or<br />
other mine or the supervision <strong>of</strong> the miners in a coal or other mine.<br />
Air split - The division <strong>of</strong> a current <strong>of</strong> air into two or more parts.<br />
Air course - An entry or a set <strong>of</strong> entries separated from other entries by stoppings, overcasts,<br />
other ventilation control devices, or by solid blocks <strong>of</strong> coal or rock so that any mixing <strong>of</strong> air<br />
currents between each is limited to leakage. Also known as an airway.<br />
AMS Operator - The person(s) designated by the mine operator, who is located on the surface<br />
<strong>of</strong> the mine <strong>and</strong> monitors the malfunction, alert, <strong>and</strong> alarm signals <strong>of</strong> the AMS <strong>and</strong> notifies<br />
appropriate personnel <strong>of</strong> these signals.<br />
Angle <strong>of</strong> dip - The angle at which strata or mineral deposits are inclined to the horizontal plane.<br />
Angle <strong>of</strong> draw - In coal mine subsidence, this angle is assumed to bisect the angle between the<br />
vertical <strong>and</strong> the angle <strong>of</strong> repose <strong>of</strong> the material <strong>and</strong> is 20° for flat seams. For dipping seams, the<br />
angle <strong>of</strong> break increases, being 35.8° from the vertical for a 40° dip. The main break occurs over<br />
the seam at an angle from the vertical equal to half the dip.<br />
Angle <strong>of</strong> repose - The maximum angle from horizontal at which a given material will rest on a<br />
given surface without sliding or rolling.<br />
Arching - Fracture processes around a mine opening, leading to stabilization by an arching<br />
effect.<br />
Atmospheric Monitoring System (AMS) - A network consisting <strong>of</strong> hardware <strong>and</strong> s<strong>of</strong>tware<br />
meeting the requirements <strong>of</strong> 30 CFR 75.351 <strong>and</strong> 75.1103–2 <strong>and</strong> capable <strong>of</strong>: measuring<br />
atmospheric parameters; transmitting the measurements to a designated surface location;<br />
providing alert <strong>and</strong> alarm signals; processing <strong>and</strong> cataloging atmospheric data; <strong>and</strong>, providing<br />
reports. Frequently used for early-warning fire detection <strong>and</strong> to monitor the operational status <strong>of</strong><br />
mining equipment.<br />
Y-1
Azimuth - A surveying term that references the angle measured clockwise from any meridian<br />
(the established line <strong>of</strong> reference). The bearing is used to designate direction. The bearing <strong>of</strong> a<br />
line is the acute horizontal angle between the meridian <strong>and</strong> the line.<br />
Back-Analysis - A process in which known failures or successes are evaluated to determine the<br />
relationship <strong>of</strong> engineering parameters to outcomes.<br />
Barricading - Enclosing part <strong>of</strong> a mine to prevent inflow <strong>of</strong> noxious gasses from a mine fire or<br />
an explosion. If men are unable to escape, they retreat as far as possible, select some working<br />
place with plenty <strong>of</strong> space, short-circuit the air from this place, build a barricade, <strong>and</strong> remain<br />
behind it until rescued.<br />
Barrier - Barrier pillars are solid blocks <strong>of</strong> coal left between two mines or sections <strong>of</strong> a mine to<br />
prevent accidents due to inrushes <strong>of</strong> water, gas, or from explosions or a mine fire; also used for a<br />
pillar left to protect active workings from a squeeze.<br />
Beam - A bar or straight girder used to support a span <strong>of</strong> ro<strong>of</strong> between two support props or<br />
walls.<br />
Beam building - The creation <strong>of</strong> a strong, inflexible beam by bolting or otherwise fastening<br />
together several weaker layers. In coal mining this is the intended basis for ro<strong>of</strong> bolting.<br />
Bearing plate - A plate used to distribute a given load; in ro<strong>of</strong> bolting, the plate used between<br />
the bolt head <strong>and</strong> the ro<strong>of</strong>.<br />
Bed - A stratum <strong>of</strong> coal or other sedimentary deposit.<br />
Belt air course - The entry in which a belt is located <strong>and</strong> any adjacent entry(ies) not separated<br />
from the belt entry by permanent ventilation controls, including any entries in series with the belt<br />
entry, terminating at a return regulator, a section loading point, or the surface.<br />
Belt conveyor - A looped belt on which coal or other materials can be carried <strong>and</strong> which is<br />
generally constructed <strong>of</strong> flame-resistant material or <strong>of</strong> reinforced rubber or rubber-like substance.<br />
Bit - The hardened <strong>and</strong> strengthened device at the end <strong>of</strong> a drill rod that transmits the energy <strong>of</strong><br />
breakage to the rock. The size <strong>of</strong> the bit determines the size <strong>of</strong> the hole. A bit may be either<br />
detachable from or integral with its supporting drill rod.<br />
Bituminous coal – A middle rank coal (between sub-bituminous <strong>and</strong> anthracite) formed by<br />
additional pressure <strong>and</strong> heat on lignite. Usually has a high Btu value <strong>and</strong> may be referred to as<br />
"s<strong>of</strong>t coal."<br />
Bleeder entries - Special entries developed <strong>and</strong> maintained as part <strong>of</strong> the bleeder system <strong>and</strong><br />
designed to continuously move air from pillared areas into a return air course or to the surface <strong>of</strong><br />
the mine.<br />
Bleeder system - a ventilation network used to ventilate pillared areas in underground coal<br />
mines <strong>and</strong> designed to continuously dilute <strong>and</strong> move air-methane mixtures <strong>and</strong> other gases,<br />
Y-2
dusts, <strong>and</strong> fumes from the worked-out area away from active workings <strong>and</strong> into a return air<br />
course or to the surface <strong>of</strong> the mine.<br />
Borehole - Any deep or long drill-hole, usually associated with a diamond drill.<br />
Bottom - Floor or underlying surface <strong>of</strong> an underground excavation.<br />
Boss - Any member <strong>of</strong> the managerial ranks who is directly in charge <strong>of</strong> miners (e.g., “shiftboss,”<br />
“face-boss,” “fire-boss,” etc.).<br />
Brattice or brattice cloth - Fire-resistant fabric or plastic partition used in a mine passage to<br />
confine the air <strong>and</strong> force it into the working place; also termed “curtain,” “rag,” “line brattice,”<br />
“line canvas,” or “line curtain.”<br />
Bounce - A heavy sudden <strong>of</strong>ten noisy blow or thump; sudden spalling <strong>of</strong>f <strong>of</strong> the sides <strong>of</strong> ribs <strong>and</strong><br />
pillars due to the excessive pressure; any dull, hollow, or thumping sound produced by<br />
movement or fracturing <strong>of</strong> strata as a result <strong>of</strong> mining operations; also known as a bump.<br />
Bump – see definition for “Bounce.”<br />
Bump Prone Ground 28 – Strong, stiff ro<strong>of</strong> <strong>and</strong> floor strata not prone to failing or heaving when<br />
subjected to high stress (e.g., deep overburden); also can refer to locations where bumps or bursts<br />
have historically occurred.<br />
Burst - An explosive breaking <strong>of</strong> coal or rock in a mine due to pressure; the sudden <strong>and</strong> violent<br />
failure <strong>of</strong> overstressed rock resulting in the instantaneous release <strong>of</strong> large amounts <strong>of</strong><br />
accumulated energy where coal or rock is suddenly expelled from failed pillars. In coal mines<br />
they may or may not be accompanied by a copious discharge <strong>of</strong> methane, carbon dioxide, or coal<br />
dust; also called outburst; bounce; bump; rock burst.<br />
Can – A br<strong>and</strong> name type <strong>of</strong> floor-to-ro<strong>of</strong> support constructed <strong>of</strong> prefabricated steel sheet metal<br />
cylinders filled with light-weight concrete.<br />
Cap - A miner's safety helmet.<br />
Certified - Describes a person who has passed an examination to do a required job.<br />
Cleat - The vertical cleavage <strong>of</strong> coal seams. The main set <strong>of</strong> joints along which coal breaks<br />
when mined.<br />
Coal - A solid, brittle, more or less distinctly stratified combustible carbonaceous rock, formed<br />
by partial to complete decomposition <strong>of</strong> vegetation; varies in color from dark brown to black; not<br />
fusible without decomposition <strong>and</strong> very insoluble.<br />
Coal reserves - Measured tonnages <strong>of</strong> coal that have been calculated to occur in a coal seam<br />
within a particular property.<br />
Y-3
Coda Magnitude – The coda magnitude (M C ) is based on the length <strong>of</strong> the seismic signal <strong>and</strong><br />
calibrated to provide similar results with the local magnitude (M L ) or Richter scale for naturally<br />
occurring earthquakes.<br />
Competent rock - Rock which, because <strong>of</strong> its physical <strong>and</strong> geological characteristics, is capable<br />
<strong>of</strong> sustaining openings without any structural support except pillars <strong>and</strong> walls left during mining<br />
(stalls, light props, <strong>and</strong> ro<strong>of</strong> bolts are not considered structural support).<br />
Contact - The place or surface where two different kinds <strong>of</strong> rocks meet. Applies to sedimentary<br />
rocks, as the contact between a limestone <strong>and</strong> a s<strong>and</strong>stone, for example, <strong>and</strong> to metamorphic<br />
rocks; <strong>and</strong> it is especially applicable between igneous intrusions <strong>and</strong> their walls.<br />
Continuous mining machine - A machine that removes coal from the face <strong>and</strong> loads that coal<br />
into cars without the use <strong>of</strong> cutting machines, drills, or explosives.<br />
Contour - An imaginary line that connects all points on a surface having the same elevation.<br />
Convergence – Reduction <strong>of</strong> entry height; closure between the mine floor <strong>and</strong> the mine ro<strong>of</strong>.<br />
Core sample – A cylinder sample generally 1-5" in diameter drilled out <strong>of</strong> an area to determine<br />
the geologic <strong>and</strong> chemical analysis <strong>of</strong> the overburden <strong>and</strong> coal.<br />
Cover - The overburden <strong>of</strong> any deposit.<br />
Crib - A ro<strong>of</strong> support <strong>of</strong> prop timbers or ties, laid in alternate cross-layers, log-cabin style.<br />
Cribbing - The construction <strong>of</strong> cribs or timbers laid at right angles to each other, sometimes<br />
filled with earth, as a ro<strong>of</strong> support or as a support for machinery.<br />
Crosscut - A passageway driven between parallel entries or air courses for ventilation purposes.<br />
Curtain – see definition for “Brattice.”<br />
Cycle mining - A system <strong>of</strong> mining in more than one working place at a time, that is, a<br />
continuous mining machine takes a lift from the face <strong>and</strong> moves to another face while permanent<br />
ro<strong>of</strong> support is established in the previous working face.<br />
Depth - The word alone generally denotes vertical depth below the surface. In the case <strong>of</strong><br />
boreholes it may mean the distance reached from the beginning <strong>of</strong> the hole, the borehole depth,<br />
or the inclined depth.<br />
Detectors - Specialized chemical or electronic instruments used to detect mine gases.<br />
Development mining - Work undertaken to open up coal reserves prior to pillar recovery.<br />
Dilute - To lower the concentration <strong>of</strong> a mixture; in this case the concentration <strong>of</strong> any hazardous<br />
gas in mine air by addition <strong>of</strong> fresh intake air.<br />
Y-4
Dip - The inclination <strong>of</strong> a geologic structure (bed, vein, fault, etc.) from the horizontal; dip is<br />
always measured downwards at right angles to the strike.<br />
Double Difference Method – A technique to improve the precision <strong>of</strong> the location <strong>of</strong> seismic<br />
events by determining the relative location between multiple events. When combined with a<br />
known location, it can improve the accuracy <strong>of</strong> the locations.<br />
Drainage - The process <strong>of</strong> removing surplus ground or surface water either by artificial means or<br />
by gravity flow.<br />
Drift - A horizontal passage underground. A drift follows the vein, as distinguished from a<br />
crosscut that intersects it, or a level or gallery, which may do either.<br />
Drift mine – An underground coal mine in which the entry or access is above water level <strong>and</strong><br />
generally on the slope <strong>of</strong> a hill, driven horizontally into a coal seam.<br />
Dump - To unload; specifically, a load <strong>of</strong> coal or waste; the mechanism for unloading, e.g. a car<br />
dump (sometimes called tipple); or, the pile created by such unloading, e.g. a waste dump (also<br />
called heap, pile, tip, spoil pike, etc.).<br />
Entry - An underground horizontal or near-horizontal passage used for haulage, ventilation, or<br />
as a mainway; a coal heading; a working place where the coal is extracted from the seam in the<br />
initial mining; same as "gate" <strong>and</strong> "roadway," both British terms.<br />
Extraction - The process <strong>of</strong> mining <strong>and</strong> removal <strong>of</strong> cal or ore from a mine.<br />
Face – The exposed area <strong>of</strong> a coal bed from which coal is being extracted.<br />
Face cleat - The principal cleavage plane or joint at right angles to the stratification <strong>of</strong> the coal<br />
seam.<br />
Fall - A mass <strong>of</strong> ro<strong>of</strong> rock or coal which has fallen in any part <strong>of</strong> a mine.<br />
Fan signal - Automation device designed to give alarm if the main fan slows down or stops.<br />
Fault - A slip-surface between two portions <strong>of</strong> the earth's surface that have moved relative to<br />
each other. A fault is a failure surface <strong>and</strong> is evidence <strong>of</strong> severe earth stresses.<br />
Fault zone - A fault, instead <strong>of</strong> being a single clean fracture, may be a zone hundreds or<br />
thous<strong>and</strong>s <strong>of</strong> feet wide. The fault zone consists <strong>of</strong> numerous interlacing small faults or a<br />
confused zone <strong>of</strong> gouge, breccia, or mylonite.<br />
Feeder - A machine that feeds coal onto a conveyor belt evenly.<br />
Floor - That part <strong>of</strong> any underground working upon which a person walks or upon which<br />
haulage equipment travels; simply the bottom or underlying surface <strong>of</strong> an underground<br />
excavation.<br />
Y-5
Formation – Any assemblage <strong>of</strong> rocks which have some character in common, whether <strong>of</strong><br />
origin, age, or composition. Often, the word is loosely used to indicate anything that has been<br />
formed or brought into its present shape.<br />
Fracture - A general term to include any kind <strong>of</strong> discontinuity in a body <strong>of</strong> rock if produced by<br />
mechanical failure, whether by shear stress or tensile stress. Fractures include faults, shears,<br />
joints, <strong>and</strong> planes <strong>of</strong> fracture cleavage.<br />
Fresh Air Base – <strong>Mine</strong> rescue teams establish a fresh air base (FAB) under controlled<br />
ventilation at the entrance to unexplored areas. The FAB includes a hardwired communications<br />
system running to the surface comm<strong>and</strong> center. The FAB serves as a safe retreat <strong>and</strong> as a<br />
communication hub between the exploring teams <strong>and</strong> the comm<strong>and</strong> center.<br />
Gob - The term applied to that part <strong>of</strong> the mine from which the coal pillars have been recovered<br />
<strong>and</strong> the rock that falls into the void; also called goaf. Also, refers to loose waste in a mine.<br />
Grading - Digging up the bottom to give more headroom in roadways.<br />
Ground control - Measures taken to prevent ro<strong>of</strong> falls or coal bursts.<br />
Ground pressure - The pressure to which a rock formation is subjected by the weight <strong>of</strong> the<br />
superimposed rock <strong>and</strong> rock material or by diastrophic forces created by movements in the rocks<br />
forming the earth's crust. Such pressures may be great enough to cause rocks having a low<br />
compressional strength to deform <strong>and</strong> be squeezed into <strong>and</strong> close a borehole or other<br />
underground opening not adequately strengthened by an artificial support, such as casing or<br />
timber.<br />
Haulage - The horizontal transport <strong>of</strong> ore, coal, supplies, <strong>and</strong> waste.<br />
Haulageway - Any underground entry or passageway that is designed for transport <strong>of</strong> mined<br />
material, personnel, or equipment, usually by the installation <strong>of</strong> track or belt conveyor.<br />
Heaving - Applied to the rising <strong>of</strong> the bottom after removal <strong>of</strong> the coal.<br />
Horizon - In geology, any given definite position or interval in the stratigraphic column or the<br />
scheme <strong>of</strong> stratigraphic classification; generally used in a relative sense.<br />
Hydraulic - Of or pertaining to fluids in motion. Hydraulic cement has a composition which<br />
permits it to set quickly under water. Hydraulic jacks lift through the force transmitted to the<br />
movable part <strong>of</strong> the jack by a liquid. Hydraulic control refers to the mechanical control <strong>of</strong><br />
various parts <strong>of</strong> machines, such as coal cutters, loaders, etc., through the operation or action <strong>of</strong><br />
hydraulic cylinders.<br />
Immediate ro<strong>of</strong> - The ro<strong>of</strong> strata immediately above the coalbed, requiring support during the<br />
excavation <strong>of</strong> coal.<br />
Inby – Into the mine; in the direction <strong>of</strong> the working face.<br />
Y-6
In situ - In the natural or original position. Applied to a rock, soil, or fossil when occurring in the<br />
situation in which it was originally formed or deposited.<br />
Intake air - Air that has not yet ventilated the last working place on any split <strong>of</strong> any working<br />
section, or any worked-out area, whether pillared or nonpillared.<br />
Isopach - A line, on a map, drawn through points <strong>of</strong> equal thickness <strong>of</strong> a designated unit.<br />
Jackpot - A cap-shaped unit designed for pre-stressing prop-type supports developed by New<br />
Concept Mining.<br />
Joint - A divisional plane or surface that divides a rock <strong>and</strong> along which there has been no<br />
visible movement parallel to the plane or surface.<br />
Lamp - The electric cap lamp worn for visibility.<br />
Layout - The design or pattern <strong>of</strong> the main roadways <strong>and</strong> workings. The proper layout <strong>of</strong> mine<br />
workings is the responsibility <strong>of</strong> the manager aided by the planning department.<br />
Lift - The amount <strong>of</strong> coal obtained from a continuous mining machine in one mining cycle.<br />
Line Curtain - Fire-resistant fabric or plastic partition used in a mine passage to confine the air<br />
<strong>and</strong> force it into the working place; also termed “line brattice” or “line canvas.”<br />
Lithology - The character <strong>of</strong> a rock described in terms <strong>of</strong> its structure, color, mineral<br />
composition, grain size, <strong>and</strong> arrangement <strong>of</strong> its component parts; all those visible features that in<br />
the aggregate impart individuality <strong>of</strong> the rock. Lithology is the basis <strong>of</strong> correlation in coal mines<br />
<strong>and</strong> commonly is reliable over a distance <strong>of</strong> a few miles.<br />
Loading point – The point where coal or ore is loaded onto conveyors.<br />
Local Magnitude – The local magnitude (M L ) or Richter scale is a logarithmic scale originally<br />
devised by Charles Richter to quantify the intensity <strong>of</strong> California earthquakes <strong>and</strong> has been<br />
adopted for use around the world.<br />
Longwall mining – One <strong>of</strong> three major underground coal mining methods currently in use.<br />
Employs a steal plow, or rotation drum, which is pulled mechanically back <strong>and</strong> forth across a<br />
face <strong>of</strong> coal that is usually several hundred feet long. The loosened coal falls onto a conveyor for<br />
removal from the mine.<br />
Loose coal - Coal fragments larger in size than coal dust.<br />
Main entry - A main haulage road. Where the coal has cleats, main entries are driven at right<br />
angles to the face cleats.<br />
Main fan - A mechanical ventilator installed at the surface; operates by either exhausting or<br />
blowing to induce airflow through the mine.<br />
Man trip - A carrier <strong>of</strong> mine personnel, by rail or rubber tire, to <strong>and</strong> from the work area.<br />
Y-7
Methane – A potentially explosive gas formed naturally from the decay <strong>of</strong> vegetative matter,<br />
similar to that which formed coal. Methane, which is the principal component <strong>of</strong> natural gas, is<br />
frequently encountered in underground coal mining operations <strong>and</strong> is kept within safe limits<br />
through the use <strong>of</strong> extensive mine ventilation systems.<br />
Methane monitor - An electronic instrument <strong>of</strong>ten mounted on a piece <strong>of</strong> mining equipment that<br />
detects <strong>and</strong> measures the methane content <strong>of</strong> mine air.<br />
<strong>Mine</strong>r – Any individual working in a coal or other mine.<br />
Mobile bridge continuous haulage system - A system <strong>of</strong> movable conveyors that carry coal<br />
from a continuous mining machine to the section belt allowing the machine to advance over<br />
short distances without interrupting the mining <strong>and</strong> loading operation.<br />
Mobile Comm<strong>and</strong> Center Vehicle – Class A motor home equipped with communication<br />
equipment, conference facility, <strong>and</strong> <strong>of</strong>fice equipment maintained by <strong>MSHA</strong>’s <strong>Mine</strong> Emergency<br />
Operations unit.<br />
<strong>MSHA</strong> - <strong>Mine</strong> <strong>Safety</strong> <strong>and</strong> <strong>Health</strong> <strong>Administration</strong>; the federal agency which regulates coal mine<br />
safety <strong>and</strong> health.<br />
Operator - Any owner, lessee, or other person who operates, controls, or supervises a coal or<br />
other mine or any independent contractor performing services or construction at such mine.<br />
Outburst Accident - coal or rock outburst that cause withdrawal <strong>of</strong> miners or which disrupts<br />
regular mining activity for more than one hour (even if no miners are injured).<br />
Outby - Nearer to or toward the mine entrance, <strong>and</strong> hence farther from the working face; the<br />
opposite <strong>of</strong> inby.<br />
Overburden – Layers <strong>of</strong> soil <strong>and</strong> rock covering a coal seam; also referred to as “depth <strong>of</strong> cover.”<br />
Overcast - Enclosed airway which permits one air current to pass over another without<br />
interruption.<br />
Pager Phone – A telephone system approved for use in coal mines <strong>and</strong> capable <strong>of</strong> broadcasting<br />
voice messages over a loud speaker.<br />
Panel - A coal mining block that generally comprises one operating unit.<br />
Parting - (1) A small joint in coal or rock; (2) a layer <strong>of</strong> rock in a coal seam; (3) a side track or<br />
turnout in a haulage road.<br />
Percentage extraction - The proportion <strong>of</strong> a coal seam which is removed from the mine. The<br />
remainder may represent coal in pillars or coal which is too thin or inferior to mine or lost in<br />
mining. Shallow coal mines working under townships, reservoirs, etc., may extract 50%, or less,<br />
<strong>of</strong> the entire seam, the remainder being left as pillars to protect the surface. Under favorable<br />
conditions, longwall mining may extract from 80 to 95% <strong>of</strong> the entire seam. With pillar methods<br />
<strong>of</strong> working, the extraction ranges from 50 to 90% depending on local conditions.<br />
Y-8
Permissible - That which is allowable or permitted. It is most widely applied to mine equipment<br />
<strong>and</strong> explosives <strong>of</strong> all kinds which are similar in all respects to samples that have passed certain<br />
tests <strong>of</strong> the <strong>MSHA</strong> <strong>and</strong> can be used with safety in accordance with specified conditions where<br />
hazards from explosive gas or coal dust exist.<br />
Permit – As it pertains to mining, a document issued by a regulatory agency that gives approval<br />
for mining operations to take place.<br />
Pillar - An area <strong>of</strong> coal left to support the overlying strata in a mine; sometimes left permanently<br />
to support surface structures.<br />
Pillared area - Describes that part <strong>of</strong> a mine from which the pillars have been removed; also<br />
known as robbed out area.<br />
Pillar line - The line that roughly follows the rear edges <strong>of</strong> coal pillars that are being recovered<br />
during retreat mining; the line along which the ro<strong>of</strong> <strong>of</strong> a coal mine is expected to break.<br />
Pillar recovery - Any reduction in pillar size during retreat mining. Refers to the systematic<br />
removal <strong>of</strong> the coal pillars between rooms or chambers to regulate the subsidence <strong>of</strong> the ro<strong>of</strong>;<br />
also termed “pillar robbing,” “bridging back” the pillar, “drawing” the pillar, or “pulling” the<br />
pillar.<br />
Portal - The surface entrance to a mine.<br />
Post - The vertical member <strong>of</strong> a timber set.<br />
Prop - Coal mining term for any single post used as ro<strong>of</strong> support. Props may be timber or steel;<br />
if steel--screwed, yieldable, or hydraulic.<br />
Qualified Person - (1) An individual deemed qualified by <strong>MSHA</strong> <strong>and</strong> designated by the<br />
operator to make tests <strong>and</strong> examinations required by this 30 CFR part 75; <strong>and</strong> (2) An individual<br />
deemed, in accordance with minimum requirements established by <strong>MSHA</strong>, qualified by training,<br />
education, <strong>and</strong> experience, to perform electrical work, to maintain electrical equipment, <strong>and</strong> to<br />
conduct examinations <strong>and</strong> tests <strong>of</strong> all electrical equipment.<br />
Rag – see definition for “Brattice.”<br />
Recovery - The proportion or percentage <strong>of</strong> coal or ore mined from the original seam or deposit.<br />
Regulator - Device (wall, door) used to control the volume <strong>of</strong> air in an air split.<br />
Reserve – That portion <strong>of</strong> the identified coal resource that can be economically mined at the time<br />
<strong>of</strong> determination. The reserve is derived by applying a recovery factor to that component <strong>of</strong> the<br />
identified coal resource designated as the reserve base.<br />
Resin bolting - A method <strong>of</strong> permanent ro<strong>of</strong> support in which steel rods are grouted with resin.<br />
Resources – Concentrations <strong>of</strong> coal in such forms that economic extraction is currently or may<br />
become feasible. Coal resources broken down by identified <strong>and</strong> undiscovered resources.<br />
Y-9
Identified coal resources are classified as demonstrated <strong>and</strong> inferred. Demonstrated resources<br />
are further broken down as measured <strong>and</strong> indicated. Undiscovered resources are broken down as<br />
hypothetical <strong>and</strong> speculative.<br />
Retreat mining - A system <strong>of</strong> robbing pillars in which the robbing line, or line through the faces<br />
<strong>of</strong> the pillars being extracted, retreats from the boundary toward the shaft or mine mouth.<br />
Return air - Air that has ventilated (or mixed with air that has ventilated) the last working place<br />
on any split <strong>of</strong> any working section, or any worked-out area, whether pillared or nonpillared.<br />
Rib - The side <strong>of</strong> a pillar or the wall <strong>of</strong> an entry; the solid coal on the side <strong>of</strong> any underground<br />
passage.<br />
Rider - A thin seam <strong>of</strong> coal overlying a thicker one.<br />
Rob - To extract pillars <strong>of</strong> coal previously left for support.<br />
Rock Dust - Pulverized limestone, dolomite, gypsum, anhydrite, shale, adobe, or other inert<br />
material, preferably light colored. Rock dust is applied to underground areas <strong>of</strong> coal mines to<br />
increase the incombustible content <strong>of</strong> mine dust so that it will not propagate an explosion.<br />
RocProp - A type <strong>of</strong> hydraulically wedged st<strong>and</strong>ing ro<strong>of</strong> support, registered trademark <strong>of</strong> <strong>Mine</strong><br />
Support Products.<br />
Ro<strong>of</strong> - The stratum <strong>of</strong> rock or other material above a coal seam; the overhead surface <strong>of</strong> a coal<br />
working place; same as “back” or “top.”<br />
Ro<strong>of</strong> bolt - A long steel bolt driven into the ro<strong>of</strong> <strong>of</strong> underground excavations to support the ro<strong>of</strong>,<br />
preventing <strong>and</strong> limiting the extent <strong>of</strong> ro<strong>of</strong> falls. The unit consists <strong>of</strong> the bolt (up to 4 feet long),<br />
steel plate, expansion shell, <strong>and</strong> pal nut. The use <strong>of</strong> ro<strong>of</strong> bolts eliminates the need for timbering<br />
by fastening together, or “laminating,” several weaker layers <strong>of</strong> ro<strong>of</strong> strata to build a “beam.”<br />
Ro<strong>of</strong> Coal – A layer <strong>of</strong> coal immediately above the mine opening as a result <strong>of</strong> leaving the upper<br />
horizon <strong>of</strong> the coalbed unmined, usually to protect weak shale in the immediate ro<strong>of</strong> from<br />
weathering; also known as “head coal” or “top coal.”<br />
Ro<strong>of</strong> fall - A coal mine cave-in, especially in active areas such as entries.<br />
Ro<strong>of</strong> jack - A screw- or pump-type hydraulic extension post made <strong>of</strong> steel <strong>and</strong> used as<br />
temporary ro<strong>of</strong> support.<br />
Ro<strong>of</strong> sag - The sinking, bending, or curving <strong>of</strong> the ro<strong>of</strong>, especially in the middle, from weight or<br />
pressure.<br />
Ro<strong>of</strong> stress - Unbalanced internal forces in the ro<strong>of</strong> or sides, created when coal is extracted.<br />
Ro<strong>of</strong> support – Posts, jacks, ro<strong>of</strong> bolts <strong>and</strong> beams used to support the rock overlying a coal<br />
seam in an underground mine. A good ro<strong>of</strong> support plan is part <strong>of</strong> mine safety <strong>and</strong> coal<br />
extraction.<br />
Y-10
Room <strong>and</strong> pillar mining – A method <strong>of</strong> underground mining in which approximately half <strong>of</strong> the<br />
coal is left in place to support the ro<strong>of</strong> <strong>of</strong> the active mining area. Large "pillars" are left while<br />
"rooms" <strong>of</strong> coal are extracted.<br />
<strong>Safety</strong> factor - The ratio <strong>of</strong> the ultimate breaking strength <strong>of</strong> the material to the force exerted<br />
against it.<br />
S<strong>and</strong>stone - A sedimentary rock consisting <strong>of</strong> quartz s<strong>and</strong> united by some cementing material,<br />
such as iron oxide or calcium carbonate.<br />
Scaling - Removal <strong>of</strong> loose rock from the ro<strong>of</strong> or walls. This work is dangerous <strong>and</strong> a long bar<br />
(called a scaling bar) is <strong>of</strong>ten used.<br />
Scoop - A rubber tired-, battery- or diesel-powered piece <strong>of</strong> equipment designed for cleaning<br />
roadways <strong>and</strong> hauling supplies.<br />
Seam - A stratum or bed <strong>of</strong> coal.<br />
Section - A portion <strong>of</strong> the working area <strong>of</strong> a mine.<br />
Self-contained breathing apparatus - A self-contained supply <strong>of</strong> oxygen used during rescue<br />
work from coal mine fires <strong>and</strong> explosions.<br />
Self-contained self-rescuer (SCSR) – A type <strong>of</strong> closed-circuit, self-contained breathing<br />
apparatus approved by <strong>MSHA</strong> <strong>and</strong> NIOSH under 42 CFR part 84 for escape only from<br />
underground mines. The device is capable <strong>of</strong> sustaining life in atmospheres containing deficient<br />
oxygen.<br />
Self-rescuer – A small filtering device carried by a coal miner underground, either on his belt or<br />
in his pocket, to provide him with immediate protection against carbon monoxide <strong>and</strong> smoke in<br />
case <strong>of</strong> a mine fire or explosion. It is a small canister with a mouthpiece directly attached to it.<br />
The wearer breathes through the mouth, the nose being closed by a clip. The canister contains a<br />
layer <strong>of</strong> fused calcium chloride that absorbs water vapor from the mine air. The device is used<br />
for escape purposes only <strong>and</strong> does not sustain life in atmospheres containing deficient oxygen.<br />
Filter self-rescuers approved by <strong>MSHA</strong> <strong>and</strong> NIOSH under 42 CFR part 84 provide at least one<br />
hour <strong>of</strong> protection against carbon monoxide.<br />
Shaft - A primary vertical or non-vertical opening through mine strata used for ventilation or<br />
drainage <strong>and</strong>/or for hoisting <strong>of</strong> personnel or materials; connects the surface with underground<br />
workings.<br />
Shale - A rock formed by consolidation <strong>of</strong> clay, mud, or silt, having a laminated structure <strong>and</strong><br />
composed <strong>of</strong> minerals essentially unaltered since deposition.<br />
Shift - The number <strong>of</strong> hours or the part <strong>of</strong> any day worked.<br />
Shuttle car – A self-discharging vehicle, generally with rubber tires, used for receiving coal<br />
from the loading or mining machine <strong>and</strong> transferring it to an underground loading point, mine<br />
railway, or belt conveyor system.<br />
Y-11
Slabbing – A method <strong>of</strong> mining pillars in which successive lifts are cut from one side <strong>of</strong> the<br />
pillar.<br />
Sloughing - The slow crumbling <strong>and</strong> falling away <strong>of</strong> material from ro<strong>of</strong>, rib, <strong>and</strong> face.<br />
Spad – A spad is a flat spike hammered into the mine ceiling from which is threaded a plumbline<br />
to serve as an underground survey station. A sight spad, is a station that allows a mine foreman<br />
to visually align entries or breaks from the main spad.<br />
Span - The horizontal distance between the side supports or solid abutments.<br />
Split - Any division or branch <strong>of</strong> the ventilating current or the workings ventilated by one<br />
branch. Also, to divide a pillar by driving one or more roads through it.<br />
Squeeze - The settling, without breaking, <strong>of</strong> the ro<strong>of</strong> <strong>and</strong> the gradual upheaval <strong>of</strong> the floor <strong>of</strong> a<br />
mine due to the weight <strong>of</strong> the overlying strata.<br />
Step-Up Foreman – A crewmember who acts in a supervisory role during a foreman’s absence.<br />
Strike - The direction <strong>of</strong> the line <strong>of</strong> intersection <strong>of</strong> a bed or vein with the horizontal plane. The<br />
strike <strong>of</strong> a bed is the direction <strong>of</strong> a straight line that connects two points <strong>of</strong> equal elevation on the<br />
bed.<br />
Stump - Any small pillar.<br />
Stopping – A permanent wall built across unused crosscuts or entries to separate air courses <strong>and</strong><br />
prevent the air from short circuiting.<br />
Subsidence – The gradual sinking, or sometimes abrupt collapse, <strong>of</strong> the rock <strong>and</strong> soil layers into<br />
an underground mine.<br />
Sump - A place in a mine that is used as a collecting point for drainage water.<br />
Support - The all-important function <strong>of</strong> keeping the mine workings open. As a verb, it refers to<br />
this function; as a noun it refers to all the equipment <strong>and</strong> materials--timber, ro<strong>of</strong> bolts, concrete,<br />
steel, etc.--that are used to carry out this function.<br />
Tailgate - A subsidiary gate road to a conveyor face as opposed to a main gate. The tailgate<br />
commonly acts as the return airway <strong>and</strong> supplies road to the face.<br />
Tailpiece - Also known as foot section pulley. The pulley or roller in the tail or foot section <strong>of</strong> a<br />
belt conveyor around which the belt runs.<br />
Timber - A collective term for underground wooden supports.<br />
Time <strong>of</strong> Useful Consciousness – Also known as “Effective Performance Time.” These<br />
interchangeable terms describe the period <strong>of</strong> time between the interruption <strong>of</strong> the oxygen supply<br />
or exposure to an oxygen-poor environment <strong>and</strong> the time when a person is unable to perform<br />
duties effectively, such as putting on oxygen equipment or taking corrective action.<br />
Y-12
Ton – A short or net ton is equal to 2,000 pounds.<br />
Top - A mine ro<strong>of</strong>; same as “back.”<br />
Tractor - A piece <strong>of</strong> self-propelled equipment that pulls trailers, skids, or personnel carriers.<br />
Also used for supplies.<br />
Tram - Used in connection with moving self-propelled mining equipment (i.e., to tram or move<br />
a machine).<br />
Transfer point - Location in the materials h<strong>and</strong>ling system, either haulage or hoisting, where<br />
bulk material is transferred between conveyances.<br />
Underground mine – Also known as a "deep" mine. Usually located several hundred feet<br />
below the earth's surface, an underground mine's coal is removed mechanically <strong>and</strong> transferred<br />
by shuttle car or conveyor to the surface.<br />
Velocity - Rate <strong>of</strong> airflow in lineal feet per minute.<br />
Ventilation - The provision <strong>of</strong> a directed flow <strong>of</strong> fresh <strong>and</strong> return air along all underground<br />
roadways, traveling roads, workings, <strong>and</strong> service parts.<br />
Violation - The breaking <strong>of</strong> any state or federal mining law.<br />
Water Gauge (st<strong>and</strong>ard U-tube) - Instrument that measures differential pressures in inches <strong>of</strong><br />
water.<br />
Wedge - A piece <strong>of</strong> wood tapering to a thin edge <strong>and</strong> used for tightening in conventional<br />
timbering.<br />
Weight - Fracturing <strong>and</strong> lowering <strong>of</strong> the ro<strong>of</strong> strata at the face as a result <strong>of</strong> mining operations,<br />
as in “taking weight.”<br />
Worked out area - An area where mining has been completed, whether pillared or nonpillared,<br />
excluding developing entries, return air courses, <strong>and</strong> intake air courses.<br />
Working - When a coal seam is being squeezed by pressure from ro<strong>of</strong> <strong>and</strong> floor, it emits<br />
creaking noises <strong>and</strong> is said to be “working.” This <strong>of</strong>ten serves as a warning to the miners that<br />
additional support is needed.<br />
Working face - Any place in a coal mine in which work <strong>of</strong> extracting coal from its natural<br />
deposit in the earth is performed during the mining cycle.<br />
Working place - The area <strong>of</strong> a coal mine inby the last open crosscut.<br />
Workings - The entire system <strong>of</strong> openings in a mine for the purpose <strong>of</strong> exploitation.<br />
Working section - All areas <strong>of</strong> the coal mine from the loading point <strong>of</strong> the section to <strong>and</strong><br />
including the working faces.<br />
Y-13
Appendix Z - References<br />
1 USBM dictionary 1996.<br />
2 Pechmann, J.C., Arabasz, W.J., Pankow, K.L., <strong>and</strong> Burlacu, R.L., 2008, Seismological report<br />
on the August 6, 2007 Cr<strong>and</strong>all Canyon <strong>Mine</strong> Collapse in Utah, submitted to Seismological<br />
Research Letters.<br />
3 Ford, S.R., Dreger, D.S., <strong>and</strong> Walter, W.R., 2008, Source characterization <strong>of</strong> the August 6,<br />
2007 Cr<strong>and</strong>all Canyon <strong>Mine</strong> seismic event in central Utah, submitted to Seismological Research<br />
Letters.<br />
4 Pariseau, W.G., 1978, Interpretation <strong>of</strong> Rock Mechanics Data (Vol. II), (A Guide to Using<br />
UTAH2), USBM OFR 47-80, June 1978, 41pp.<br />
5 Heasley, K.A., 1998, Numerical Modeling <strong>of</strong> Coal <strong>Mine</strong>s with a Laminated Displacement-<br />
Discontinuity Code, Ph.D. Thesis, Colorado School <strong>of</strong> <strong>Mine</strong>s<br />
6 Mark, C., ARMPS v.5.1.18 Help file, Stability Factors.<br />
7 Chase, F.E., Mark, C., <strong>and</strong> Heasley, K.A., 2002, Deep Cover Pillar Extraction in the U.S.<br />
Coalfields, Proceedings <strong>of</strong> the 21 st International Conference on Ground Control in Mining,<br />
Morgantown, WV, West Virginia University.<br />
8 Koehler, J.R., <strong>and</strong> Tadolini, S.C., 1995, Practical Design Methods for Barrier Pillars, USBM<br />
Information Circular 9427, 19 pp.<br />
9 Goodrich, R.R., Agapito, J.F.T., Pollastro, C., LaFrentz, L., <strong>and</strong> Fleck, K., 1999, Long load<br />
transfer distances at the Deer Creek <strong>Mine</strong>, Rock Mechanics for Industry, 37 th U.S. Rock<br />
Mechanics Symposium, Vail, CO, June 6-9, 1999, p. 517-523.<br />
10 Abel Jr., J.F., 1988, S<strong>of</strong>t Rock Pillars, International Journal <strong>of</strong> Mining <strong>and</strong> Geological<br />
Engineering, Vo. 6, pp. 215-248.<br />
11 Barrientos, G., <strong>and</strong> Parker, J., 1974, Use <strong>of</strong> the Pressure Arch in <strong>Mine</strong> Design at White Pine,<br />
Trans. SME <strong>of</strong> AIME, Vol. 255, pp. 75-82.<br />
12 Gilbride, L.J., <strong>and</strong> Hardy, M.P., 2004, Interpanel Barriers for Deep Western U.S. Longwall<br />
Mining, Proceedings <strong>of</strong> the 23 rd International Conference on Ground Control in Mining, August<br />
2004, 7 pp.<br />
13 Karabin, G.J., <strong>and</strong> Evanto, M.A., 1999, Experience with the Boundary-Element Method <strong>of</strong><br />
Numerical Modeling to Resolve Complex Ground Control Problems, Proceedings <strong>of</strong> the Second<br />
International Workshop on Coal Pillar Mechanics <strong>and</strong> Design, NIOSH IC 9448, pp. 89-113.<br />
14 Karabin, G.J. <strong>and</strong> Evanto, M.A., 1994 Experience with the Boundary Element Method <strong>of</strong><br />
Numerical Modeling as a Tool to Resolve Complex Ground Control Problems, Proceedings <strong>of</strong><br />
the 13 th International Conference on Ground Control in Mining, Morgantown, WV, pp. 201-213.<br />
15 Chase, F. <strong>and</strong> C. Mark, 1997, Analysis <strong>of</strong> Retreat Mining Pillar Stability (ARMPS),<br />
Proceedings: New Technology for Ground Control in Retreat Mining, eds. C. Mark <strong>and</strong> R.<br />
Tuchman, NIOSH IC 9446, March 1997, p. 17-34.<br />
Z-1
16 Miller, T.M., <strong>and</strong> Mazur, P.O. (Fermilab), 1983, Oxygen Deficiency Hazards Associated with<br />
Liquefied Gas Systems Development <strong>of</strong> a Program <strong>of</strong> Controls, FERMILAB-TM-1163, Jan<br />
1983, 30pp.<br />
17 http://www.cdc.gov/niosh/mining/statistics/disall.htm<br />
18 Lexan (LEXAN) is a registered trademark for General Electric's (now SABIC Innovative<br />
Plastics) br<strong>and</strong> <strong>of</strong> highly durable polycarbonate resin thermoplastic intended to replace glass<br />
where the need for strength justifies its higher cost.<br />
19 Chase, F.E., R.K. Zipf, <strong>and</strong> C. Mark (1994) “The Massive Collapse <strong>of</strong> Coal Pillars- Case<br />
Histories in the U.S.,” Proceedings <strong>of</strong> the 13 th International Conference on Ground Control in<br />
Mining. West Virginia University, Morgantown, WV, pp. 69-80.<br />
20 Maleki, H. (1995) “An Analysis <strong>of</strong> Violent Failure in U.S. Coal <strong>Mine</strong>s – Case Studies,”<br />
Proceedings: Mechanics <strong>and</strong> Mitigation <strong>of</strong> Violent Failure in Coal <strong>and</strong> Hard-Rock <strong>Mine</strong>s,<br />
Bureau <strong>of</strong> <strong>Mine</strong>s, SP 01-95, pp. 5-25.<br />
21 NSA Engineering, Inc., 2000, “Final <strong>Report</strong> – Review <strong>of</strong> Current Yielding Gate Road Design<br />
Approaches <strong>and</strong> Applications in U.S. Longwall Operations,” January 7, 2000, 77 pp. (included<br />
as Appendix 11 in UNSW/SCT Collaborative ACARP Project C9018, “Systems approach to<br />
pillar design: Module 1 – Pillar design procedures,” January 2005).<br />
22 Peng, S.S., 1992, Surface Subsidence Engineering, Society for Mining, Metallurgy, <strong>and</strong><br />
Exploration, Inc., Littleton, CO, 161 pp.<br />
23 Agioutantis, Z., <strong>and</strong> Karmis, M., 2003, Surface Deformation Prediction System (SDPS),<br />
Virginia Polytechnic Institute <strong>and</strong> State University, Blacksburg, VA, p. 42.<br />
24 Arabasz W.J., 2007, Presentation to Utah Mining Commission, November 2007<br />
25 Waldhauser, F., <strong>and</strong> Ellsworth, W.L., 2000, A double difference earthquake location<br />
algorithm: Method <strong>and</strong> application to the northern Hayward fault, Bulletin <strong>of</strong> the Seismological<br />
Society <strong>of</strong> America 90, 1353-1368.<br />
26 http://www.cdc.gov/niosh/mining/products/product54.htm<br />
27 Jaeger, J.C., <strong>and</strong> Cook, N.G.W., 1979, Fundamental <strong>of</strong> Rock Mechanics, London: Chapman<br />
<strong>and</strong> Hall.<br />
28 Iannacchione, A.T., <strong>and</strong> Zelanko, J.C., 1995, Occurrence <strong>and</strong> Remediation <strong>of</strong> Coal <strong>Mine</strong><br />
Bumps: A Historical Review, Proceedings: Mechanics <strong>and</strong> Mitigation <strong>of</strong> Violent Failure in Coal<br />
<strong>and</strong> Hard-Rock <strong>Mine</strong>s, USBM, May 1995.<br />
Z-2