Swing Trading Using Candlestick charting - ASD Forex
Swing Trading Using Candlestick charting - ASD Forex
Swing Trading Using Candlestick charting - ASD Forex

You also want an ePaper? Increase the reach of your titles
YUMPU automatically turns print PDFs into web optimized ePapers that Google loves.
<strong>Swing</strong> <strong>Trading</strong>, pg. 10<br />
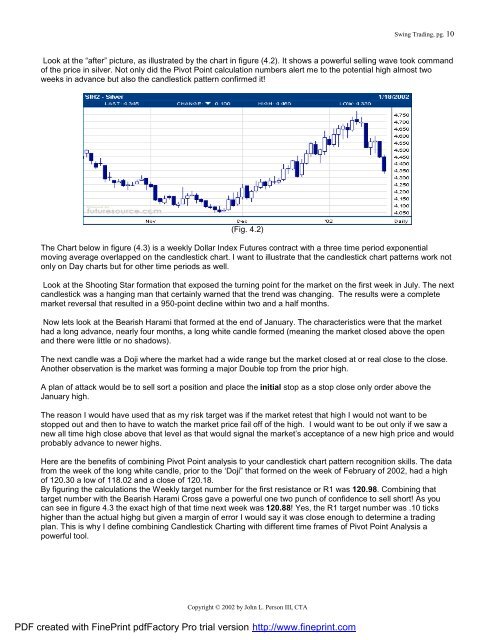
Look at the “after” picture, as illustrated by the chart in figure (4.2). It shows a powerful selling wave took command<br />
of the price in silver. Not only did the Pivot Point calculation numbers alert me to the potential high almost two<br />
weeks in advance but also the candlestick pattern confirmed it!<br />
(Fig. 4.2)<br />
The Chart below in figure (4.3) is a weekly Dollar Index Futures contract with a three time period exponential<br />
moving average overlapped on the candlestick chart. I want to illustrate that the candlestick chart patterns work not<br />
only on Day charts but for other time periods as well.<br />
Look at the Shooting Star formation that exposed the turning point for the market on the first week in July. The next<br />
candlestick was a hanging man that certainly warned that the trend was changing. The results were a complete<br />
market reversal that resulted in a 950-point decline within two and a half months.<br />
Now lets look at the Bearish Harami that formed at the end of January. The characteristics were that the market<br />
had a long advance, nearly four months, a long white candle formed (meaning the market closed above the open<br />
and there were little or no shadows).<br />
The next candle was a Doji where the market had a wide range but the market closed at or real close to the close.<br />
Another observation is the market was forming a major Double top from the prior high.<br />
A plan of attack would be to sell sort a position and place the initial stop as a stop close only order above the<br />
January high.<br />
The reason I would have used that as my risk target was if the market retest that high I would not want to be<br />
stopped out and then to have to watch the market price fail off of the high. I would want to be out only if we saw a<br />
new all time high close above that level as that would signal the market’s acceptance of a new high price and would<br />
probably advance to newer highs.<br />
Here are the benefits of combining Pivot Point analysis to your candlestick chart pattern recognition skills. The data<br />
from the week of the long white candle, prior to the ‘Doji” that formed on the week of February of 2002, had a high<br />
of 120.30 a low of 118.02 and a close of 120.18.<br />
By figuring the calculations the Weekly target number for the first resistance or R1 was 120.98. Combining that<br />
target number with the Bearish Harami Cross gave a powerful one two punch of confidence to sell short! As you<br />
can see in figure 4.3 the exact high of that time next week was 120.88! Yes, the R1 target number was .10 ticks<br />
higher than the actual highg but given a margin of error I would say it was close enough to determine a trading<br />
plan. This is why I define combining <strong>Candlestick</strong> Charting with different time frames of Pivot Point Analysis a<br />
powerful tool.<br />
Copyright © 2002 by John L. Person III, CTA<br />
PDF created with FinePrint pdfFactory Pro trial version http://www.fineprint.com