Swing Trading Using Candlestick charting - ASD Forex
Swing Trading Using Candlestick charting - ASD Forex
Swing Trading Using Candlestick charting - ASD Forex

You also want an ePaper? Increase the reach of your titles
YUMPU automatically turns print PDFs into web optimized ePapers that Google loves.
<strong>Swing</strong> <strong>Trading</strong>, pg. 8<br />
The Bullish Rising Three Methods figure 3.17: This is a Bullish continuation pattern with the same characteristics as<br />
in the Bearish Falling Three methods, but just the opposite. During the beginning stages of an advancing price<br />
trend an unusual long white candle is preceded by three smaller dark or black candles.<br />
The three methods pattern and again it can even be just two but the textbook version is three smaller candles need<br />
to stay within the range of the first long white candle. The last white candle shows a powerful advancing white<br />
candle that should open above the previous sessions close and it should close above the first long white candles<br />
close as well. This is like a western Bull Flag formation that indicates higher prices to come.<br />
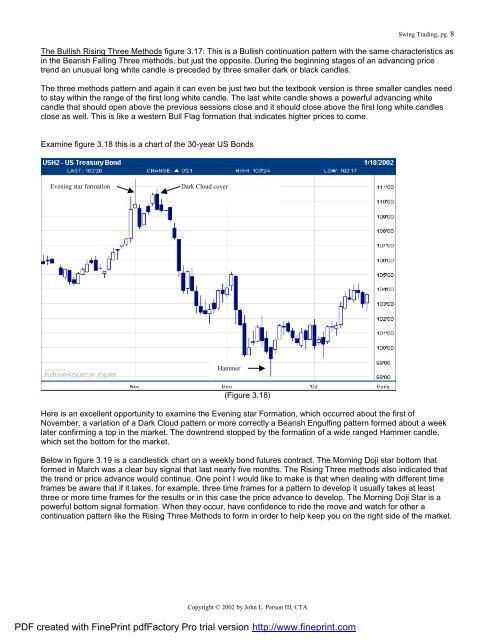
Examine figure 3.18 this is a chart of the 30-year US Bonds<br />
Evening star formation<br />
Dark Cloud cover<br />
Hammer<br />
(Figure 3.18)<br />
Here is an excellent opportunity to examine the Evening star Formation, which occurred about the first of<br />
November, a variation of a Dark Cloud pattern or more correctly a Bearish Engulfing pattern formed about a week<br />
later confirming a top in the market. The downtrend stopped by the formation of a wide ranged Hammer candle,<br />
which set the bottom for the market.<br />
Below in figure 3.19 is a candlestick chart on a weekly bond futures contract. The Morning Doji star bottom that<br />
formed in March was a clear buy signal that last nearly five months. The Rising Three methods also indicated that<br />
the trend or price advance would continue. One point I would like to make is that when dealing with different time<br />
frames be aware that if it takes, for example, three time frames for a pattern to develop it usually takes at least<br />
three or more time frames for the results or in this case the price advance to develop. The Morning Doji Star is a<br />
powerful bottom signal formation. When they occur, have confidence to ride the move and watch for other a<br />
continuation pattern like the Rising Three Methods to form in order to help keep you on the right side of the market.<br />
Copyright © 2002 by John L. Person III, CTA<br />
PDF created with FinePrint pdfFactory Pro trial version http://www.fineprint.com