Swing Trading Using Candlestick charting - ASD Forex
Swing Trading Using Candlestick charting - ASD Forex
Swing Trading Using Candlestick charting - ASD Forex

Create successful ePaper yourself
Turn your PDF publications into a flip-book with our unique Google optimized e-Paper software.
<strong>Swing</strong> <strong>Trading</strong>, pg. 12<br />
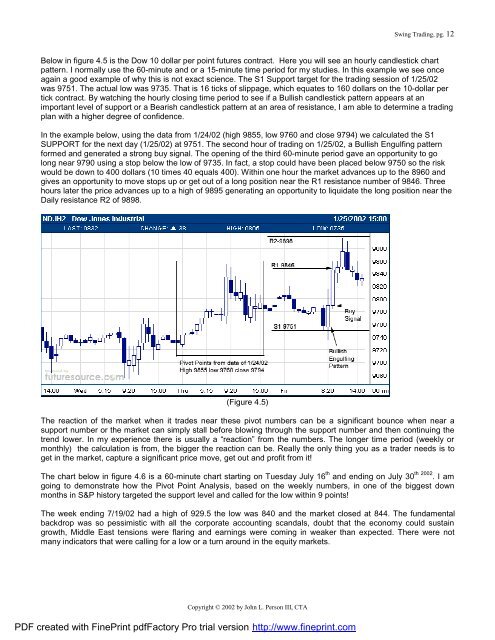
Below in figure 4.5 is the Dow 10 dollar per point futures contract. Here you will see an hourly candlestick chart<br />
pattern. I normally use the 60-minute and or a 15-minute time period for my studies. In this example we see once<br />
again a good example of why this is not exact science. The S1 Support target for the trading session of 1/25/02<br />
was 9751. The actual low was 9735. That is 16 ticks of slippage, which equates to 160 dollars on the 10-dollar per<br />
tick contract. By watching the hourly closing time period to see if a Bullish candlestick pattern appears at an<br />
important level of support or a Bearish candlestick pattern at an area of resistance, I am able to determine a trading<br />
plan with a higher degree of confidence.<br />
In the example below, using the data from 1/24/02 (high 9855, low 9760 and close 9794) we calculated the S1<br />
SUPPORT for the next day (1/25/02) at 9751. The second hour of trading on 1/25/02, a Bullish Engulfing pattern<br />
formed and generated a strong buy signal. The opening of the third 60-minute period gave an opportunity to go<br />
long near 9790 using a stop below the low of 9735. In fact, a stop could have been placed below 9750 so the risk<br />
would be down to 400 dollars (10 times 40 equals 400). Within one hour the market advances up to the 8960 and<br />
gives an opportunity to move stops up or get out of a long position near the R1 resistance number of 9846. Three<br />
hours later the price advances up to a high of 9895 generating an opportunity to liquidate the long position near the<br />
Daily resistance R2 of 9898.<br />
(Figure 4.5)<br />
The reaction of the market when it trades near these pivot numbers can be a significant bounce when near a<br />
support number or the market can simply stall before blowing through the support number and then continuing the<br />
trend lower. In my experience there is usually a “reaction” from the numbers. The longer time period (weekly or<br />
monthly) the calculation is from, the bigger the reaction can be. Really the only thing you as a trader needs is to<br />
get in the market, capture a significant price move, get out and profit from it!<br />
The chart below in figure 4.6 is a 60-minute chart starting on Tuesday July 16 th and ending on July 30 th 2002 . I am<br />
going to demonstrate how the Pivot Point Analysis, based on the weekly numbers, in one of the biggest down<br />
months in S&P history targeted the support level and called for the low within 9 points!<br />
The week ending 7/19/02 had a high of 929.5 the low was 840 and the market closed at 844. The fundamental<br />
backdrop was so pessimistic with all the corporate accounting scandals, doubt that the economy could sustain<br />
growth, Middle East tensions were flaring and earnings were coming in weaker than expected. There were not<br />
many indicators that were calling for a low or a turn around in the equity markets.<br />
Copyright © 2002 by John L. Person III, CTA<br />
PDF created with FinePrint pdfFactory Pro trial version http://www.fineprint.com