Swing Trading Using Candlestick charting - ASD Forex
Swing Trading Using Candlestick charting - ASD Forex
Swing Trading Using Candlestick charting - ASD Forex

You also want an ePaper? Increase the reach of your titles
YUMPU automatically turns print PDFs into web optimized ePapers that Google loves.
<strong>Swing</strong> <strong>Trading</strong>, pg. 6<br />
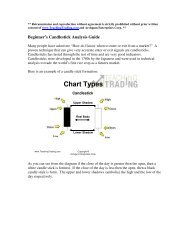
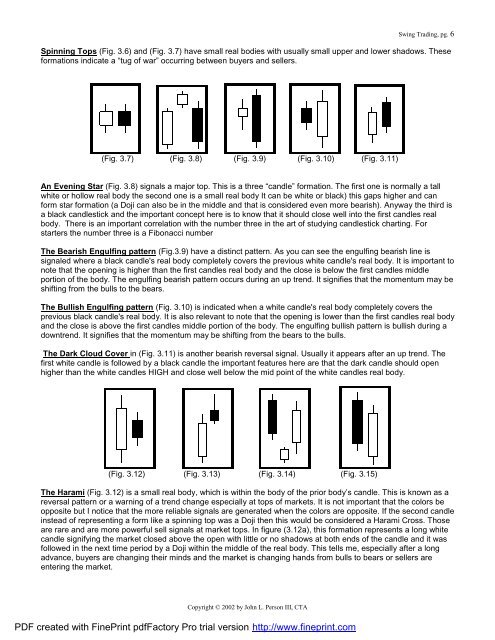
Spinning Tops (Fig. 3.6) and (Fig. 3.7) have small real bodies with usually small upper and lower shadows. These<br />
formations indicate a “tug of war” occurring between buyers and sellers.<br />
(Fig. 3.7) (Fig. 3.8) (Fig. 3.9) (Fig. 3.10) (Fig. 3.11)<br />
An Evening Star (Fig. 3.8) signals a major top. This is a three “candle” formation. The first one is normally a tall<br />
white or hollow real body the second one is a small real body It can be white or black) this gaps higher and can<br />
form star formation (a Doji can also be in the middle and that is considered even more bearish). Anyway the third is<br />
a black candlestick and the important concept here is to know that it should close well into the first candles real<br />
body. There is an important correlation with the number three in the art of studying candlestick <strong>charting</strong>. For<br />
starters the number three is a Fibonacci number<br />
The Bearish Engulfing pattern (Fig.3.9) have a distinct pattern. As you can see the engulfing bearish line is<br />
signaled where a black candle's real body completely covers the previous white candle's real body. It is important to<br />
note that the opening is higher than the first candles real body and the close is below the first candles middle<br />
portion of the body. The engulfing bearish pattern occurs during an up trend. It signifies that the momentum may be<br />
shifting from the bulls to the bears.<br />
The Bullish Engulfing pattern (Fig. 3.10) is indicated when a white candle's real body completely covers the<br />
previous black candle's real body. It is also relevant to note that the opening is lower than the first candles real body<br />
and the close is above the first candles middle portion of the body. The engulfing bullish pattern is bullish during a<br />
downtrend. It signifies that the momentum may be shifting from the bears to the bulls.<br />
The Dark Cloud Cover in (Fig. 3.11) is another bearish reversal signal. Usually it appears after an up trend. The<br />
first white candle is followed by a black candle the important features here are that the dark candle should open<br />
higher than the white candles HIGH and close well below the mid point of the white candles real body.<br />
(Fig. 3.12) (Fig. 3.13) (Fig. 3.14) (Fig. 3.15)<br />
The Harami (Fig. 3.12) is a small real body, which is within the body of the prior body’s candle. This is known as a<br />
reversal pattern or a warning of a trend change especially at tops of markets. It is not important that the colors be<br />
opposite but I notice that the more reliable signals are generated when the colors are opposite. If the second candle<br />
instead of representing a form like a spinning top was a Doji then this would be considered a Harami Cross. Those<br />
are rare and are more powerful sell signals at market tops. In figure (3.12a), this formation represents a long white<br />
candle signifying the market closed above the open with little or no shadows at both ends of the candle and it was<br />
followed in the next time period by a Doji within the middle of the real body. This tells me, especially after a long<br />
advance, buyers are changing their minds and the market is changing hands from bulls to bears or sellers are<br />
entering the market.<br />
Copyright © 2002 by John L. Person III, CTA<br />
PDF created with FinePrint pdfFactory Pro trial version http://www.fineprint.com