Swing Trading Using Candlestick charting - ASD Forex
Swing Trading Using Candlestick charting - ASD Forex
Swing Trading Using Candlestick charting - ASD Forex

You also want an ePaper? Increase the reach of your titles
YUMPU automatically turns print PDFs into web optimized ePapers that Google loves.
<strong>Swing</strong> <strong>Trading</strong>, pg. 14<br />
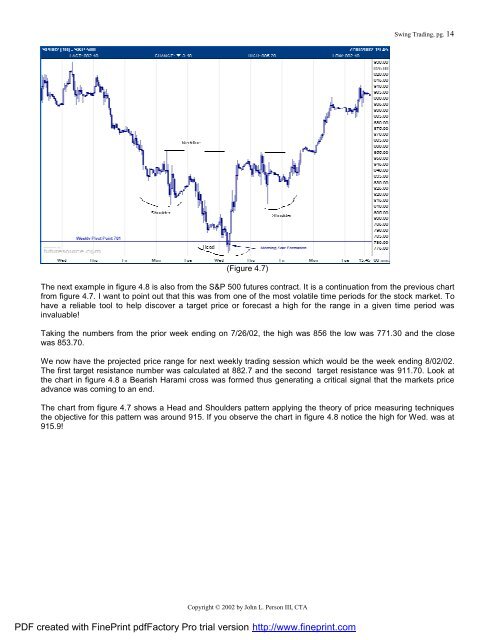
(Figure 4.7)<br />
The next example in figure 4.8 is also from the S&P 500 futures contract. It is a continuation from the previous chart<br />
from figure 4.7. I want to point out that this was from one of the most volatile time periods for the stock market. To<br />
have a reliable tool to help discover a target price or forecast a high for the range in a given time period was<br />
invaluable!<br />
Taking the numbers from the prior week ending on 7/26/02, the high was 856 the low was 771.30 and the close<br />
was 853.70.<br />
We now have the projected price range for next weekly trading session which would be the week ending 8/02/02.<br />
The first target resistance number was calculated at 882.7 and the second target resistance was 911.70. Look at<br />
the chart in figure 4.8 a Bearish Harami cross was formed thus generating a critical signal that the markets price<br />
advance was coming to an end.<br />
The chart from figure 4.7 shows a Head and Shoulders pattern applying the theory of price measuring techniques<br />
the objective for this pattern was around 915. If you observe the chart in figure 4.8 notice the high for Wed. was at<br />
915.9!<br />
Copyright © 2002 by John L. Person III, CTA<br />
PDF created with FinePrint pdfFactory Pro trial version http://www.fineprint.com