CS REPORT 4/01 - National Board of Examiners in Optometry
CS REPORT 4/01 - National Board of Examiners in Optometry
CS REPORT 4/01 - National Board of Examiners in Optometry

Create successful ePaper yourself
Turn your PDF publications into a flip-book with our unique Google optimized e-Paper software.
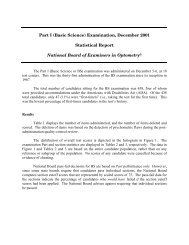
Part I (Basic Science) Exam<strong>in</strong>ation, December 2002<br />
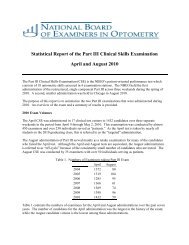
Statistical Report<br />
<strong>National</strong> <strong>Board</strong> <strong>of</strong> <strong>Exam<strong>in</strong>ers</strong> <strong>in</strong> <strong>Optometry</strong> ®<br />
The Part I (Basic Science or BS) exam<strong>in</strong>ation was adm<strong>in</strong>istered on December 11-12, at<br />
19 test centers. This was the 33 rd adm<strong>in</strong>istration <strong>of</strong> the BS exam<strong>in</strong>ation s<strong>in</strong>ce its <strong>in</strong>ception <strong>in</strong><br />
1987.<br />
The BS exam<strong>in</strong>ation is targeted for students enter<strong>in</strong>g their third year <strong>of</strong> optometric<br />
education. Although the August and December adm<strong>in</strong>istrations are equivalent <strong>in</strong> content and<br />
difficulty, the overwhelm<strong>in</strong>g majority <strong>of</strong> students sit for the August adm<strong>in</strong>istration, partially<br />
because it is their earliest opportunity for successful completion. The candidate population for<br />
the subsequent December adm<strong>in</strong>istration typically has a disproportionate number and percentage<br />
<strong>of</strong> prior failees. For the December 2002 adm<strong>in</strong>istration, the total number <strong>of</strong> candidates (392) and<br />
the number (27) and rounded percentage <strong>of</strong> “first timers” (7%) were the lowest for any NBEO<br />
BS exam<strong>in</strong>ation. One candidate was provided accommodations under the Americans with<br />
Disabilities Act (ADA). The immediately preced<strong>in</strong>g adm<strong>in</strong>istration <strong>of</strong> August 2002 hosted a<br />
record number <strong>of</strong> candidates (1608) for any exam<strong>in</strong>ation that the <strong>National</strong> <strong>Board</strong> has ever<br />
adm<strong>in</strong>istered.<br />
Results<br />
Table 1 displays the number <strong>of</strong> items adm<strong>in</strong>istered, and the number <strong>of</strong> items deleted and<br />
scored. The deletion <strong>of</strong> items was based on the detection <strong>of</strong> psychometric flaws dur<strong>in</strong>g the postadm<strong>in</strong>istration<br />
quality-control review.<br />
The distribution <strong>of</strong> overall test scores is displayed <strong>in</strong> Figure 1. The exam<strong>in</strong>ation Part and<br />
section statistics are displayed <strong>in</strong> Tables 2 and 3, respectively. The data <strong>in</strong> Figure 1 and Tables 2<br />
and 3 are based on the entire candidate population, rather than on any reference or subgroup <strong>of</strong><br />
the population. No scores <strong>of</strong> any candidate were cancelled because <strong>of</strong> evidence <strong>of</strong> cheat<strong>in</strong>g.<br />
<strong>National</strong> <strong>Board</strong> pass-fail decisions for BS are based on Part performance only. However,<br />
s<strong>in</strong>ce some state boards require that candidates pass <strong>in</strong>dividual sections, the <strong>National</strong> <strong>Board</strong><br />
computes section cut<strong>of</strong>f scores that are represented by scaled scores <strong>of</strong> 75. The pass-fail data for<br />
the sections <strong>in</strong>dicate the percentage <strong>of</strong> candidates who would have failed if the section cut<strong>of</strong>f<br />
scores had been applied. The <strong>National</strong> <strong>Board</strong> advises aga<strong>in</strong>st requir<strong>in</strong>g that <strong>in</strong>dividual sections<br />
be passed.
Basic Science, 12/2002 -2-<br />
Table 1: Number <strong>of</strong> Test Items Adm<strong>in</strong>istered and Scored<br />
Number <strong>of</strong> Test Items<br />
Adm<strong>in</strong>istered Deleted Scored<br />
O v e r a l l T e s t 435 8 427<br />
Human Biology 195 5 190<br />
Ocular / Visual Biology 90 1 89<br />
Optics 125 2 123<br />
Psychology 25 0 25<br />
Figure 1: Distribution <strong>of</strong> Overall Test Scores<br />
140<br />
130<br />
120<br />
110<br />
100<br />
90<br />
Frequency<br />
80<br />
70<br />
60<br />
50<br />
40<br />
30<br />
20<br />
10<br />
0<br />
25 30 35 40 45 50 55 60 65 70 75 80 85 90 95<br />
P e r c e n t a g e S c o r e s
Basic Science, 12/2002 -3-<br />
The <strong>National</strong> <strong>Board</strong> uses a criterion-based methodology to determ<strong>in</strong>e pass-fail standards.<br />
This methodology is based on many detailed consensual judgments by the <strong>Board</strong>'s exam<strong>in</strong>ation<br />
committees regard<strong>in</strong>g the difficulty <strong>of</strong> each test item. The difficulty <strong>of</strong> test items is based on an<br />
analysis <strong>of</strong> each <strong>of</strong> the options with<strong>in</strong> the items. This procedure is known as the Nedelsky/Gross<br />
technique. Articles describ<strong>in</strong>g this procedure, as well as an empirical study <strong>of</strong> its effectiveness,<br />
may be obta<strong>in</strong>ed by contact<strong>in</strong>g the <strong>National</strong> <strong>Board</strong> <strong>of</strong>fice.<br />
The Part pass-fail cut<strong>of</strong>f score is scaled so that it always equals 300. Similarly, for those<br />
states that have subtest requirements, the sections are scaled so that 75 is reported as the cut<strong>of</strong>f<br />
score. The scaled Part cut<strong>of</strong>f <strong>of</strong> 300 is equal to the weighted average <strong>of</strong> the section scaled cut<strong>of</strong>f<br />
score <strong>of</strong> 75. The scaled scores for each section have a range <strong>of</strong> 0-99, where 0 represents the<br />
lowest score possible (i.e. zero percent correct), and 99 represents the highest score possible (i.e.,<br />
100% correct). The score range for each Part is based on a 100-900 scale, where 100 represents<br />
zero percent correct, and 900 represents 100% correct.<br />
Table 2: Overall Part Summary Statistics*<br />
Raw Score % Score Scaled Score<br />
D e s c r i p t i v e D a t a<br />
Score Range 133-374 31-88 2<strong>01</strong>-707<br />
** Mean Score 253.80 59.44 293.51<br />
Median Score 256 59.95 295.19<br />
Standard Deviation 30.87 7.23<br />
R e l i a b i l i t y D a t a<br />
KR-20 Coefficient 0.91<br />
Kappa Coefficient 0.71<br />
# SEM: All Scores 9.16 2.15<br />
# SEM: Pass-Fail Cut<strong>of</strong>f Score 9.56 2.24<br />
P a s s - F a i l D a t a<br />
Pass-Fail Cut<strong>of</strong>f Score 262 61.36 300<br />
** Number (%) Pass<strong>in</strong>g 158 (40.31)<br />
Number (%) Fail<strong>in</strong>g 234 (59.69)<br />
* Part statistics are based on 427 items and 392 candidates, 27 (6.89%) <strong>of</strong> whom are students tak<strong>in</strong>g<br />
the test for the first time.<br />
** The mean score and pass rate <strong>of</strong> students tak<strong>in</strong>g BS for the first time are 63.49% and 66.67%, respectively.<br />
# Standard error <strong>of</strong> measurement
Basic Science, 12/2002 -4-<br />
The overall mean score (59%) was the second-lowest <strong>in</strong> the history <strong>of</strong> the BS test. The<br />
overall pass rate (40%) was at a record low. These data, and additional analyses, <strong>in</strong>dicate that<br />
the weak performance is the result <strong>of</strong> a poorly prepared candidate population, rather than any<br />
skew<strong>in</strong>g <strong>in</strong> test content or difficulty. This poor performance is consistent with the historical<br />
pattern <strong>of</strong> poor candidate performance <strong>in</strong> the <strong>of</strong>f-cycle adm<strong>in</strong>istration; however, with an<br />
unprecedented low percentage <strong>of</strong> first timers, the typically weak performance was weaker.<br />
Table 3: Section Summary Statistics<br />
Human Biology Ocular / Visual Biology O p t i c s<br />
Psychology<br />
% Scaled % Scaled % Scaled % Scaled<br />
Score Score Score Score Score Score Score Score<br />
D e s c r i p t i v e D a t a<br />
Score Range 31-89 38-92 22-89 27-92 32-86 40-91 44-96 54-96<br />
Mean Score 59.11 72.90 59.26 70.96 58.54 72.99 66.96 76.97<br />
Standard Deviation 7.94 9.57 8.50 10.33<br />
P a s s - F a i l D a t a*<br />
Pass-Fail Cut<strong>of</strong>f Score 60.53 75 62.92 75 60.16 75 64.00 75<br />
Candidates Pass<strong>in</strong>g (%) 43.88 35.71 44.90 67.60<br />
Candidates Fail<strong>in</strong>g (%) 56.12 64.29 55.10 32.40<br />
* Based on <strong>National</strong> <strong>Board</strong> criteria, candidates pass or fail Parts only, not sections. These section data are relevant only to applicable<br />
state board requirements.<br />
Performance among the four sections was generally poor. The mean score was below<br />
60% for three <strong>of</strong> the four sections. The only other BS exam<strong>in</strong>ation <strong>in</strong> which this occurred was <strong>in</strong><br />
April 1997, which was the adm<strong>in</strong>istration with the lowest mean and prior record low pass rate.<br />
The highest section mean was <strong>in</strong> Psychology (67%), which typically atta<strong>in</strong>s the highest section<br />
mean. However, this section has the fewest number <strong>of</strong> items, which limits its impact on the<br />
overall BS mean score.<br />
The next adm<strong>in</strong>istration <strong>of</strong> the Part I (Basic Science) exam<strong>in</strong>ation will be <strong>in</strong> August 2003.