Part I (Basic Science) Examination, December 2001 Statistical ...
Part I (Basic Science) Examination, December 2001 Statistical ...
Part I (Basic Science) Examination, December 2001 Statistical ...
- No tags were found...

You also want an ePaper? Increase the reach of your titles
YUMPU automatically turns print PDFs into web optimized ePapers that Google loves.
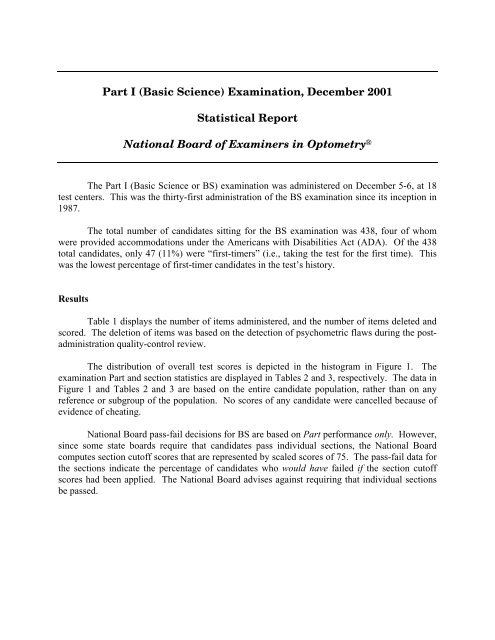
<strong>Part</strong> I (<strong>Basic</strong> <strong>Science</strong>) <strong>Examination</strong>, <strong>December</strong> <strong>2001</strong><strong>Statistical</strong> ReportNational Board of Examiners in Optometry ®The <strong>Part</strong> I (<strong>Basic</strong> <strong>Science</strong> or BS) examination was administered on <strong>December</strong> 5-6, at 18test centers. This was the thirty-first administration of the BS examination since its inception in1987.The total number of candidates sitting for the BS examination was 438, four of whomwere provided accommodations under the Americans with Disabilities Act (ADA). Of the 438total candidates, only 47 (11%) were “first-timers” (i.e., taking the test for the first time). Thiswas the lowest percentage of first-timer candidates in the test’s history.ResultsTable 1 displays the number of items administered, and the number of items deleted andscored. The deletion of items was based on the detection of psychometric flaws during the postadministrationquality-control review.The distribution of overall test scores is depicted in the histogram in Figure 1. Theexamination <strong>Part</strong> and section statistics are displayed in Tables 2 and 3, respectively. The data inFigure 1 and Tables 2 and 3 are based on the entire candidate population, rather than on anyreference or subgroup of the population. No scores of any candidate were cancelled because ofevidence of cheating.National Board pass-fail decisions for BS are based on <strong>Part</strong> performance only. However,since some state boards require that candidates pass individual sections, the National Boardcomputes section cutoff scores that are represented by scaled scores of 75. The pass-fail data forthe sections indicate the percentage of candidates who would have failed if the section cutoffscores had been applied. The National Board advises against requiring that individual sectionsbe passed.
<strong>Basic</strong> <strong>Science</strong>, 12/01 2Table 1: Number of Test Items Administered and ScoredItemsAdministered Deleted ScoredOverall Test 435 12 423Human Biology 195 6 189Ocular/Visual Biology 90 3 87Theoretical, Ophthalmic,& Physiological Optics 125 3 122Psychology 25 0 25Figure 1: Histogram of Overall Test Scores____________________________ 40|||C||LEGEND |*||----------------------------| *||C=Pass-Fail Cutoff Score | *||M=Mean Score |*||B=Both Cutoff and Mean |*||*=1.3 Examinees |*F||____________________________| *|**R|**|***E|***|****Q|****** |******** U|******** |********** E|********** |********** N|************** |*************** C|*************** |**************** * Y|**************** * |****************** |******************** |********************** |*** *********************** |***** ************************* |******************************** **|************************************** *** ** 0|__________|_________|_________|_________|_________|_________|B________|_________|_________|_________|0102030405060708090100PERCENTAGESCORESThe National Board uses a criterion-based methodology to determine pass-fail standards.This methodology is based on many detailed consensual judgments by the Board's examinationcommittees regarding the difficulty of each test item. The difficulty of test items is based on ananalysis of each of the options within the items. This procedure is known as the Nedelsky/Grosstechnique. Articles describing this procedure, as well as an empirical study of its effectiveness,may be obtained by contacting the National Board office.
<strong>Basic</strong> <strong>Science</strong>, 12/01 3Table 2: <strong>Part</strong> Summary Statistics*Raw % ScaledScore Score ScoreDescriptive Data Score Range 60-364 14-86 146-684** Mean Score 257.1 60.8 298.5Median Score 259 61.2 300Standard Deviation 31.95 7.55Reliability Data KR-20 Reliability 0.92Kappa Reliability 0.71Standard Error of Measurementof all scores 9.10 2.15at the pass-fail cutoff score 9.13 2.16Pass-Fail Data Pass-Fail Score 259 61.2 300** Number (%) Passing 223 (50.9)Number (%) Failing 215 (49.1)* <strong>Part</strong> statistics are based on 423 test items and 438 candidates (47 or 10.7% of whom are first-timers). The data include one candidatewith unrepresentatively low scores because of sitting for only a portion of the test.** The mean score and pass rate of students sitting for <strong>Basic</strong> <strong>Science</strong> for the first time are 68.2% and 83.0%, respectively.Descriptive DataTable 3: Section Summary Statistics*TheoreticalOphthalmic &Human Ocular/Visual PhysiologicalBiology Biology Optics Psychology% Scaled % Scaled % Scaled % ScaledScore Score Score Score Score Score Score ScoreScore Range 14-90 17-93 18-92 22-94 11-87 14-91 16-96 20-97Mean Score 61.1 75.5 64.2 75.7 56.3 69.6 67.9 79.8Standard Deviation 8.32 9.56 8.80 10.72Pass-Fail Data**Pass-Fail Score 60.3 75 63.2 75 60.7 75 60.0 75% Passing 56.2 57.1 32.0 83.8% Failing 43.8 42.9 68.0 16.2* The data include one candidate with unrepresentatively low scores because of sitting for only a portion of the test.** Based on National Board criteria, candidates pass or fail <strong>Part</strong>s only, not sections. These section data are relevant only to applicablestate board requirements.The <strong>Part</strong> pass-fail cutoff score is scaled so that it always equals 300. Similarly, for thosestates that have subtest requirements, the sections are scaled so that 75 is reported as the cutoffscore. The scaled <strong>Part</strong> cutoff of 300 is equal to the weighted average of the section scaled cutoff
<strong>Basic</strong> <strong>Science</strong>, 12/01 4score of 75. The scaled scores for each section have a range of 0-99, where 0 represents nocorrect responses, and 99 represents 100% correct. The score range for each <strong>Part</strong> is based on a100-900 scale, where 100 represents the no correct responses, and 900 represents 100% correct.The overall mean score and pass rate for the <strong>December</strong> <strong>2001</strong> BS examination were verysimilar to the mean and pass rate of the <strong>December</strong> 1999 and 2000 examinations, and in the lowend of their respective historic ranges. This is not surprising, as the majority of the candidateshad failed the test at least once previously. Historic data consistently indicate that although priorfailees tend to elevate their performance on re-examination, their improved performance remainsat a lower level than that of candidates taking the test for the first time.Performance among the four sections was mediocre. For the Optics section, performancewas particularly weak, with a mean score of 56%.The next administration of the <strong>Part</strong> I (<strong>Basic</strong> <strong>Science</strong>) examination will be in August 2002.