Statistical Report of the Part III Clinical Skills Examination April and ...
Statistical Report of the Part III Clinical Skills Examination April and ...
Statistical Report of the Part III Clinical Skills Examination April and ...
Create successful ePaper yourself
Turn your PDF publications into a flip-book with our unique Google optimized e-Paper software.
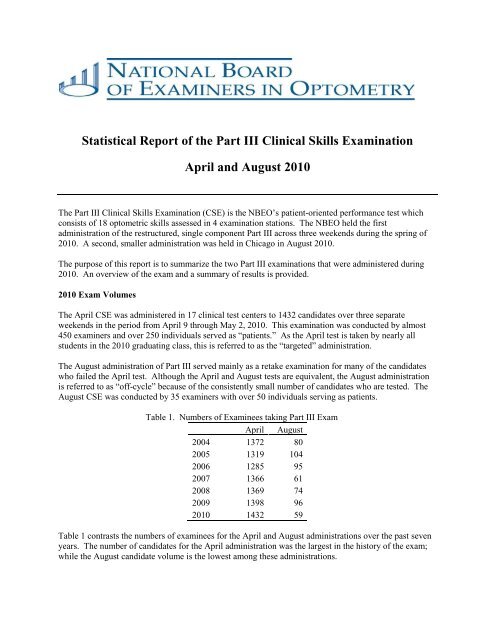
<strong>Statistical</strong> <strong>Report</strong> <strong>of</strong> <strong>the</strong> <strong>Part</strong> <strong>III</strong> <strong>Clinical</strong> <strong>Skills</strong> <strong>Examination</strong><strong>April</strong> <strong>and</strong> August 2010The <strong>Part</strong> <strong>III</strong> <strong>Clinical</strong> <strong>Skills</strong> <strong>Examination</strong> (CSE) is <strong>the</strong> NBEO’s patient-oriented performance test whichconsists <strong>of</strong> 18 optometric skills assessed in 4 examination stations. The NBEO held <strong>the</strong> firstadministration <strong>of</strong> <strong>the</strong> restructured, single component <strong>Part</strong> <strong>III</strong> across three weekends during <strong>the</strong> spring <strong>of</strong>2010. A second, smaller administration was held in Chicago in August 2010.The purpose <strong>of</strong> this report is to summarize <strong>the</strong> two <strong>Part</strong> <strong>III</strong> examinations that were administered during2010. An overview <strong>of</strong> <strong>the</strong> exam <strong>and</strong> a summary <strong>of</strong> results is provided.2010 Exam VolumesThe <strong>April</strong> CSE was administered in 17 clinical test centers to 1432 c<strong>and</strong>idates over three separateweekends in <strong>the</strong> period from <strong>April</strong> 9 through May 2, 2010. This examination was conducted by almost450 examiners <strong>and</strong> over 250 individuals served as “patients.” As <strong>the</strong> <strong>April</strong> test is taken by nearly allstudents in <strong>the</strong> 2010 graduating class, this is referred to as <strong>the</strong> “targeted” administration.The August administration <strong>of</strong> <strong>Part</strong> <strong>III</strong> served mainly as a retake examination for many <strong>of</strong> <strong>the</strong> c<strong>and</strong>idateswho failed <strong>the</strong> <strong>April</strong> test. Although <strong>the</strong> <strong>April</strong> <strong>and</strong> August tests are equivalent, <strong>the</strong> August administrationis referred to as “<strong>of</strong>f-cycle” because <strong>of</strong> <strong>the</strong> consistently small number <strong>of</strong> c<strong>and</strong>idates who are tested. TheAugust CSE was conducted by 35 examiners with over 50 individuals serving as patients.Table 1. Numbers <strong>of</strong> Examinees taking <strong>Part</strong> <strong>III</strong> Exam<strong>April</strong> August2004 1372 802005 1319 1042006 1285 952007 1366 612008 1369 742009 1398 962010 1432 59Table 1 contrasts <strong>the</strong> numbers <strong>of</strong> examinees for <strong>the</strong> <strong>April</strong> <strong>and</strong> August administrations over <strong>the</strong> past sevenyears. The number <strong>of</strong> c<strong>and</strong>idates for <strong>the</strong> <strong>April</strong> administration was <strong>the</strong> largest in <strong>the</strong> history <strong>of</strong> <strong>the</strong> exam;while <strong>the</strong> August c<strong>and</strong>idate volume is <strong>the</strong> lowest among <strong>the</strong>se administrations.
ResultsThe CSE includes four 30-minute stations which assess c<strong>and</strong>idates across 18 skills. Total testing time is3.5 hours. The examination results for both 2010 administrations are summarized in Tables 2-4. Table 2presents <strong>the</strong> final descriptive data; that is, after <strong>the</strong> c<strong>and</strong>idates with an incomplete for <strong>the</strong> <strong>April</strong> CSE scorewere retested in August. There were six c<strong>and</strong>idates with an incomplete because <strong>of</strong> a statistical orinterrater reliability concern, an irregularity during <strong>the</strong> test, or a successful appeal. C<strong>and</strong>idates with anincomplete from <strong>the</strong> <strong>April</strong> administration took <strong>the</strong> August <strong>Part</strong> <strong>III</strong> examination with a reduced fee.Table 2. Summary Statistics for <strong>Part</strong> <strong>III</strong>, 2010 administrations<strong>April</strong> 2010, N=1432 Raw Score Percent Score Scaled ScoreDescriptive DataScore RangeMean ScoreSt<strong>and</strong>ard DeviationPass-Fail DataPass-Fail Cut<strong>of</strong>f ScoreNumber (%) PassingAugust 2010, N=59Descriptive DataScore RangeMean ScoreSt<strong>and</strong>ard DeviationPass-Fail DataPass-Fail Cut<strong>of</strong>f ScoreNumber (%) Passing349 – 884809.255.2504 – 864743.476.639 – 10091.5100 – 900617.8728.4 82.4 3001373 (95.9%)57 – 9884.1100 – 823398.0728.4 82.4 30036 (61.0%)Table 2 presents summary data for raw, percentage, <strong>and</strong> scaled scores. The scaled score range for each<strong>Part</strong> is based on a 100-900 scale, where 100 represents <strong>the</strong> lowest score possible, <strong>and</strong> 900 represents aperfect score. The <strong>Part</strong> pass-fail cut<strong>of</strong>f scores are scaled so that <strong>the</strong>y always equal 300. The maximumnumber <strong>of</strong> weighted points available for <strong>the</strong> 2010 CSE was 884; <strong>the</strong> raw pass-fail cut<strong>of</strong>f was 728.4. In2010, one c<strong>and</strong>idate earned a 100% score <strong>and</strong> received a scaled score <strong>of</strong> 900 for this examination.Table 3. Discipline Scores for <strong>Part</strong> <strong>III</strong>, 2010 administrationsNumber Number Raw Scores Percent Scores<strong>April</strong> 2010, N=1432 Items Points Range Mean (S.D.) Range Mean (S.D.)Disciplines:CommunicationAffectivePsychomotor<strong>Clinical</strong> Observation &<strong>Report</strong>ingAugust 2010, N=59Disciplines:CommunicationAffectivePsychomotor<strong>Clinical</strong> Observation &<strong>Report</strong>ing1107155901107155901858496195185849619560 – 1854 – 8176 – 49643 - 195114 – 1847 – 8251 – 49196 - 18792.2 (6.5)99.5 (3.4)92.2 (5.8)88.9 (7.9)163.7 (17.1)7.8 (0.4)416.9 (53.1)155.0 (21.9)32 – 10050 – 10035 – 10022 – 10062 – 9988 – 10051 – 9949 – 9692.2 (6.5)99.5 (3.4)92.2 (5.8)88.9 (7.9)88.5 (9.2)98.1 (4.5)84.0 (10.7)79.5 (11.2)
In addition to <strong>the</strong> total <strong>Part</strong> score, <strong>of</strong>ficial score reports provide sub-scores for each content discipline.Table 3 presents a summary <strong>of</strong> discipline scores for <strong>the</strong> 2010 CSE administration as raw <strong>and</strong> percentagescores. The scaled scores for each discipline have a maximum range <strong>of</strong> 0-99, where 0 represents <strong>the</strong>lowest score possible, <strong>and</strong> 99 represents <strong>the</strong> highest score possible (i.e., a perfect score). For those statesthat have subtest requirements, <strong>the</strong> discipline scores are scaled so that 75 is reported as <strong>the</strong> cut<strong>of</strong>f score.The CSE assesses 18 skills performed in 4 stations. Table 4 summarizes percent score statistics for eachskill by administration. C<strong>and</strong>idates performed best on Skill 2, Near Cover Test, in <strong>April</strong> with a meanscore <strong>of</strong> 95.1%. Skill 12, Retinoscopy, had <strong>the</strong> lowest mean score in <strong>April</strong> <strong>and</strong> August, 84% <strong>and</strong> 73.9%,respectively.Table 4. Percent Scores by Skill in 2010<strong>April</strong>AugustSkill Range Mean (SD) Range Mean (SD)1 Case History / Patient Communication 28.6 – 100 92.0 (8.0) 66.7 – 100 90.5 (8.4)2 Near Cover Test 0 – 100 95.1 (11.1) 12.5 – 100 84.7 (23.2)3 Binocular Extraocular Muscle Motility0 – 100 98.2 (10.1) 46.2 – 100 95.8 (10.5)Evaluation4 Blood Pressure Measurement 0 – 100 88.4 (16.1) 0 – 100 85.6 (21.1)5 Ophthalmic Lens Evaluation 8.3– 100 84.9 (13.5) 29.2 – 100 74.1 (17.3)6 Pupil Testing 0 – 100 92.8 (12.7) 28.9 – 100 92.3 (14.0)7 Biomicroscopy 37.9– 100 92.3 (9.5) 43.9 – 100 85.5 (13.9)8 Goldmann Applanation Tonometry 0 – 100 92.1 (12.3) 26.0 – 100 84.1 (17.4)9 Gonioscopy 0 – 100 88.7 (16.4) 0 – 100 74.6 (28.9)10 Collagen Implant Insertion And Removal 0 – 100 93.6 (14.7) 0 – 100 79.1 (30.8)11 Ocular Disease Management: Patient0 – 100 87.4 (15.0) 0 – 100 77.1 (31.6)Education12 Retinoscopy 16.4 – 100 84.0 (16.6) 30.9 – 100 73.9 (21.9)13 Distance Subjective Refraction 0 – 100 91.2 (11.7) 16.9 – 100 81.7 (19.9)14 Heterophoria And Vergence Testing At 0 – 100 94.4 (11.3) 36.2 – 100 85.7 (15.1)Distance15 Accommodation Testing 0 – 100 90.7 (14.7) 0 – 100 77.0 (23.3)16 Binocular Indirect Ophthalmoscopy 0 – 100 94.1 (11.0) 12.7 – 100 81.0 (21.5)17 Dilated Biomicroscopy And Non-Contact 1.7 – 100 92.4 (11.5) 32.2 – 100 86.0 (15.5)Fundus Lens Evaluation18 S<strong>of</strong>t <strong>and</strong> GP Contact Lens Insertion,Evaluation, And Removal0 – 100 93.1 (8.8) 45.6 – 100 88.0 (12.2)The next administration <strong>of</strong> CSE in <strong>April</strong> 2011 will be <strong>the</strong> last examination held at <strong>the</strong> various optometricinstitutions. Beginning in August 2011, <strong>the</strong> CSE will be administered at a single site in Charlotte, NC,<strong>and</strong> will be available throughout <strong>the</strong> year. The National Board acknowledges <strong>the</strong> enormous efforts <strong>of</strong> <strong>the</strong>hundreds <strong>of</strong> volunteers, including patients, examiners, <strong>and</strong> site personnel who have devoted <strong>the</strong>ir time,talent, <strong>and</strong> expertise to <strong>the</strong> successful development <strong>and</strong> administration <strong>of</strong> <strong>the</strong> <strong>Clinical</strong> <strong>Skills</strong> <strong>Examination</strong>since <strong>the</strong> late 1980s when it was first developed <strong>and</strong> in 1993 when it was first administered across all <strong>of</strong><strong>the</strong> institutions.


