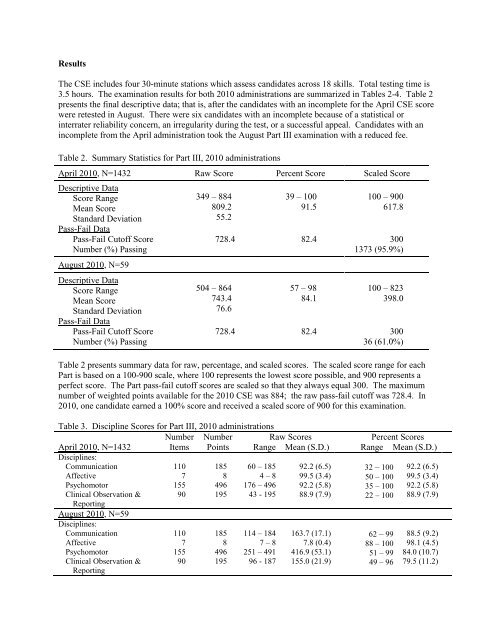
ResultsThe CSE includes four 30-minute stations which assess c<strong>and</strong>idates across 18 skills. Total testing time is3.5 hours. The examination results for both 2010 administrations are summarized in Tables 2-4. Table 2presents <strong>the</strong> final descriptive data; that is, after <strong>the</strong> c<strong>and</strong>idates with an incomplete for <strong>the</strong> <strong>April</strong> CSE scorewere retested in August. There were six c<strong>and</strong>idates with an incomplete because <strong>of</strong> a statistical orinterrater reliability concern, an irregularity during <strong>the</strong> test, or a successful appeal. C<strong>and</strong>idates with anincomplete from <strong>the</strong> <strong>April</strong> administration took <strong>the</strong> August <strong>Part</strong> <strong>III</strong> examination with a reduced fee.Table 2. Summary Statistics for <strong>Part</strong> <strong>III</strong>, 2010 administrations<strong>April</strong> 2010, N=1432 Raw Score Percent Score Scaled ScoreDescriptive DataScore RangeMean ScoreSt<strong>and</strong>ard DeviationPass-Fail DataPass-Fail Cut<strong>of</strong>f ScoreNumber (%) PassingAugust 2010, N=59Descriptive DataScore RangeMean ScoreSt<strong>and</strong>ard DeviationPass-Fail DataPass-Fail Cut<strong>of</strong>f ScoreNumber (%) Passing349 – 884809.255.2504 – 864743.476.639 – 10091.5100 – 900617.8728.4 82.4 3001373 (95.9%)57 – 9884.1100 – 823398.0728.4 82.4 30036 (61.0%)Table 2 presents summary data for raw, percentage, <strong>and</strong> scaled scores. The scaled score range for each<strong>Part</strong> is based on a 100-900 scale, where 100 represents <strong>the</strong> lowest score possible, <strong>and</strong> 900 represents aperfect score. The <strong>Part</strong> pass-fail cut<strong>of</strong>f scores are scaled so that <strong>the</strong>y always equal 300. The maximumnumber <strong>of</strong> weighted points available for <strong>the</strong> 2010 CSE was 884; <strong>the</strong> raw pass-fail cut<strong>of</strong>f was 728.4. In2010, one c<strong>and</strong>idate earned a 100% score <strong>and</strong> received a scaled score <strong>of</strong> 900 for this examination.Table 3. Discipline Scores for <strong>Part</strong> <strong>III</strong>, 2010 administrationsNumber Number Raw Scores Percent Scores<strong>April</strong> 2010, N=1432 Items Points Range Mean (S.D.) Range Mean (S.D.)Disciplines:CommunicationAffectivePsychomotor<strong>Clinical</strong> Observation &<strong>Report</strong>ingAugust 2010, N=59Disciplines:CommunicationAffectivePsychomotor<strong>Clinical</strong> Observation &<strong>Report</strong>ing1107155901107155901858496195185849619560 – 1854 – 8176 – 49643 - 195114 – 1847 – 8251 – 49196 - 18792.2 (6.5)99.5 (3.4)92.2 (5.8)88.9 (7.9)163.7 (17.1)7.8 (0.4)416.9 (53.1)155.0 (21.9)32 – 10050 – 10035 – 10022 – 10062 – 9988 – 10051 – 9949 – 9692.2 (6.5)99.5 (3.4)92.2 (5.8)88.9 (7.9)88.5 (9.2)98.1 (4.5)84.0 (10.7)79.5 (11.2)
In addition to <strong>the</strong> total <strong>Part</strong> score, <strong>of</strong>ficial score reports provide sub-scores for each content discipline.Table 3 presents a summary <strong>of</strong> discipline scores for <strong>the</strong> 2010 CSE administration as raw <strong>and</strong> percentagescores. The scaled scores for each discipline have a maximum range <strong>of</strong> 0-99, where 0 represents <strong>the</strong>lowest score possible, <strong>and</strong> 99 represents <strong>the</strong> highest score possible (i.e., a perfect score). For those statesthat have subtest requirements, <strong>the</strong> discipline scores are scaled so that 75 is reported as <strong>the</strong> cut<strong>of</strong>f score.The CSE assesses 18 skills performed in 4 stations. Table 4 summarizes percent score statistics for eachskill by administration. C<strong>and</strong>idates performed best on Skill 2, Near Cover Test, in <strong>April</strong> with a meanscore <strong>of</strong> 95.1%. Skill 12, Retinoscopy, had <strong>the</strong> lowest mean score in <strong>April</strong> <strong>and</strong> August, 84% <strong>and</strong> 73.9%,respectively.Table 4. Percent Scores by Skill in 2010<strong>April</strong>AugustSkill Range Mean (SD) Range Mean (SD)1 Case History / Patient Communication 28.6 – 100 92.0 (8.0) 66.7 – 100 90.5 (8.4)2 Near Cover Test 0 – 100 95.1 (11.1) 12.5 – 100 84.7 (23.2)3 Binocular Extraocular Muscle Motility0 – 100 98.2 (10.1) 46.2 – 100 95.8 (10.5)Evaluation4 Blood Pressure Measurement 0 – 100 88.4 (16.1) 0 – 100 85.6 (21.1)5 Ophthalmic Lens Evaluation 8.3– 100 84.9 (13.5) 29.2 – 100 74.1 (17.3)6 Pupil Testing 0 – 100 92.8 (12.7) 28.9 – 100 92.3 (14.0)7 Biomicroscopy 37.9– 100 92.3 (9.5) 43.9 – 100 85.5 (13.9)8 Goldmann Applanation Tonometry 0 – 100 92.1 (12.3) 26.0 – 100 84.1 (17.4)9 Gonioscopy 0 – 100 88.7 (16.4) 0 – 100 74.6 (28.9)10 Collagen Implant Insertion And Removal 0 – 100 93.6 (14.7) 0 – 100 79.1 (30.8)11 Ocular Disease Management: Patient0 – 100 87.4 (15.0) 0 – 100 77.1 (31.6)Education12 Retinoscopy 16.4 – 100 84.0 (16.6) 30.9 – 100 73.9 (21.9)13 Distance Subjective Refraction 0 – 100 91.2 (11.7) 16.9 – 100 81.7 (19.9)14 Heterophoria And Vergence Testing At 0 – 100 94.4 (11.3) 36.2 – 100 85.7 (15.1)Distance15 Accommodation Testing 0 – 100 90.7 (14.7) 0 – 100 77.0 (23.3)16 Binocular Indirect Ophthalmoscopy 0 – 100 94.1 (11.0) 12.7 – 100 81.0 (21.5)17 Dilated Biomicroscopy And Non-Contact 1.7 – 100 92.4 (11.5) 32.2 – 100 86.0 (15.5)Fundus Lens Evaluation18 S<strong>of</strong>t <strong>and</strong> GP Contact Lens Insertion,Evaluation, And Removal0 – 100 93.1 (8.8) 45.6 – 100 88.0 (12.2)The next administration <strong>of</strong> CSE in <strong>April</strong> 2011 will be <strong>the</strong> last examination held at <strong>the</strong> various optometricinstitutions. Beginning in August 2011, <strong>the</strong> CSE will be administered at a single site in Charlotte, NC,<strong>and</strong> will be available throughout <strong>the</strong> year. The National Board acknowledges <strong>the</strong> enormous efforts <strong>of</strong> <strong>the</strong>hundreds <strong>of</strong> volunteers, including patients, examiners, <strong>and</strong> site personnel who have devoted <strong>the</strong>ir time,talent, <strong>and</strong> expertise to <strong>the</strong> successful development <strong>and</strong> administration <strong>of</strong> <strong>the</strong> <strong>Clinical</strong> <strong>Skills</strong> <strong>Examination</strong>since <strong>the</strong> late 1980s when it was first developed <strong>and</strong> in 1993 when it was first administered across all <strong>of</strong><strong>the</strong> institutions.