Green Wireless Communications: A Time-Reversal Paradigm
Green Wireless Communications: A Time-Reversal Paradigm
Green Wireless Communications: A Time-Reversal Paradigm

Create successful ePaper yourself
Turn your PDF publications into a flip-book with our unique Google optimized e-Paper software.
WANG et al.: GREEN WIRELESS COMMUNICATIONS: A TIME-REVERSAL PARADIGM 1707<br />
1<br />
0.5<br />
0.8<br />
0.45<br />
0.6<br />
0.4<br />
Amplitude<br />
0.4<br />
0.2<br />
0<br />
−0.2<br />
−0.4<br />
Power Needed for a TR system<br />
0.35<br />
0.3<br />
0.25<br />
0.2<br />
0.15<br />
−0.6<br />
0.1<br />
−0.8<br />
0.05<br />
−1<br />
0 100 200 300 400 500 600<br />
<strong>Time</strong> (ns)<br />
(a) CIR (office)<br />
0<br />
0 2 4 6 8 10 12 14 16 18 20<br />
The number of fingers in the Rake receiver<br />
(a) r P (office)<br />
0.35<br />
0.25<br />
0.2<br />
0.15<br />
0.3<br />
Amplitude<br />
0.1<br />
0.05<br />
0<br />
−0.05<br />
−0.1<br />
−0.15<br />
Power Needed for a TR system<br />
0.25<br />
0.2<br />
−0.2<br />
0.15<br />
−0.25<br />
Normalized Magnitude<br />
0 100 200 300 400 500 600<br />
<strong>Time</strong> (ns)<br />
1<br />
0.9<br />
0.8<br />
0.7<br />
0.6<br />
0.5<br />
0.4<br />
0.3<br />
0.2<br />
0.1<br />
(b) CIR (corridor)<br />
0<br />
0 500 1000 1500 2000 2500 3000<br />
Taps of Pre−equalized Channels<br />
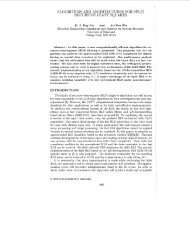
(c) Temporal focusing effect (corridor)<br />
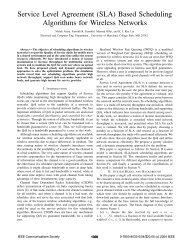
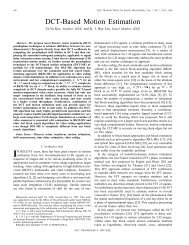
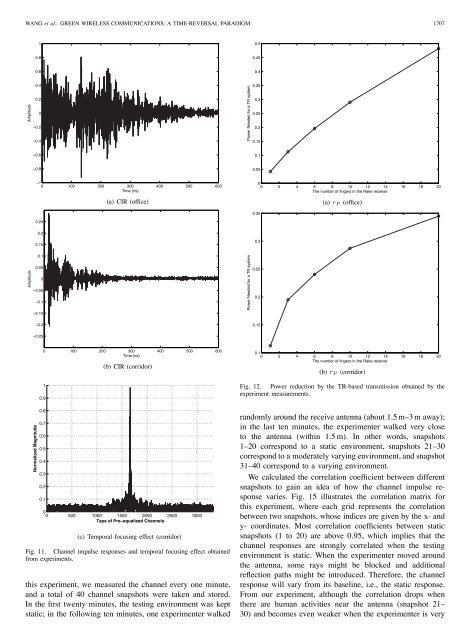
Fig. 11. Channel impulse responses and temporal focusing effect obtained<br />
from experiments.<br />
this experiment, we measured the channel every one minute,<br />
and a total of 40 channel snapshots were taken and stored.<br />
In the first twenty minutes, the testing environment was kept<br />
static; in the following ten minutes, one experimenter walked<br />
0.1<br />
0 2 4 6 8 10 12 14 16 18 20<br />
The number of fingers in the Rake receiver<br />
(b) r P (corridor)<br />
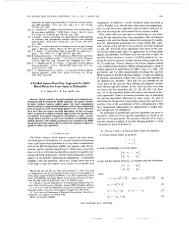
Fig. 12. Power reduction by the TR-based transmission obtained by the<br />
experiment measurements.<br />
randomly around the receive antenna (about 1.5 m–3 m away);<br />
in the last ten minutes, the experimenter walked very close<br />
to the antenna (within 1.5 m). In other words, snapshots<br />
1–20 correspond to a static environment, snapshots 21–30<br />
correspond to a moderately varying environment, and snapshot<br />
31–40 correspond to a varying environment.<br />
We calculated the correlation coefficient between different<br />
snapshots to gain an idea of how the channel impulse response<br />
varies. Fig. 15 illustrates the correlation matrix for<br />
this experiment, where each grid represents the correlation<br />
between two snapshots, whose indices are given by the x- and<br />
y- coordinates. Most correlation coefficients between static<br />
snapshots (1 to 20) are above 0.95, which implies that the<br />
channel responses are strongly correlated when the testing<br />
environment is static. When the experimenter moved around<br />
the antenna, some rays might be blocked and additional<br />
reflection paths might be introduced. Therefore, the channel<br />
response will vary from its baseline, i.e., the static response.<br />
From our experiment, although the correlation drops when<br />
there are human activities near the antenna (snapshot 21–<br />
30) and becomes even weaker when the experimenter is very