Fiscal year 2010/11 - Poverty Alleviation Fund, Nepal
Fiscal year 2010/11 - Poverty Alleviation Fund, Nepal
Fiscal year 2010/11 - Poverty Alleviation Fund, Nepal

You also want an ePaper? Increase the reach of your titles
YUMPU automatically turns print PDFs into web optimized ePapers that Google loves.
Foreword<br />
The dismal national growth rate of 2 to 4 per cent from<br />
1996/97 to until now has left a quarter of the <strong>Nepal</strong>ese<br />
population below the poverty line. A more detailed and<br />
sophisticated assessment of Multi Dimensional <strong>Poverty</strong><br />
Index (MPI), conducted by Oxford University, has indicated that<br />
two third of the population is still living below the poverty line.<br />
Poor employment situation, slow development expenditure,<br />
frustrating investment climate, rising inflation and its pains and<br />
collapsing financial sector-all have contributed towards stopping<br />
the country from moving forward-in terms of economy, stability,<br />
peace building, inclusive growth, and thus widening the gap<br />
between the rich and poor.<br />
In this context, the <strong>Poverty</strong> <strong>Alleviation</strong> <strong>Fund</strong> is working as a<br />
specialized and fast track vehicle to reach out to the poor, and<br />
has achieved some significant results on the ground especially<br />
impacting on the lives of the poor and marginalized communities<br />
living in the far-flung villages and districts.<br />
Six <strong>year</strong>s down the line, PAF has been a brand as one out of<br />
ten <strong>Nepal</strong>i is directly benefiting from PAF programme. Reaching<br />
out to the most vulnerable groups, especially those who are<br />
disadvantaged due to gender, caste, ethnicity or physical<br />
isolation, PAF has demonstrated that even modest amounts of<br />
resources given to the community led development can help<br />
many poor families to get out of poverty, in a sustainable way.<br />
PAF is working now with other development partners and<br />
programmes to build synergies between the programmes<br />
aiming to alleviate poverty and community empowerment.<br />
PAF has made important strides in joining hands with local<br />
governments to avoid duplications and yield maximum benefits<br />
from the pro-poor programme at the grass root level.<br />
The community based and driven approach has already resulted<br />
in the formation of over 17 thousand community organizations<br />
(COs) spread in 40 districts. Nearly 500 thousand households<br />
are direct beneficiaries of which 74 per cent are women and 66<br />
per cent are ultra poor--those who do not have food sufficiency<br />
for more than 3 months in a <strong>year</strong>.<br />
Independent analysis has shown that in communities where<br />
PAF intervention is for more than 6 months, consumption<br />
growth has increased by 49 per cent, and we have witnessed<br />
significant improvement in gender empowerment, health and<br />
education status and social capital and assets formation.<br />
Building on the success and learning, we are working on finetuning<br />
our approach to cover the hardcore, embrace pocketbased<br />
development approach and make the community<br />
organizations self-sustaining.<br />
In view of the wide varieties of activities undertaken within<br />
the sub-projects of PAF-led programme, the challenges faced<br />
for sustainability of the sub-projects include the linkage with<br />
market for sustaining income-generating activities as well as<br />
the availibility of insurance and safety-nets, particularly for<br />
livestock. PAF is also to explore an alternative to livestock -based<br />
activities for landless poor as the huge demand at present is<br />
mainly related with livestock. Another important issue before<br />
PAF is to build the community capacity to manage Revolving<br />
<strong>Fund</strong> and operate the sub-projects and raise the awareness of<br />
the community through functional literacy. Also, there is a need<br />
to adopt different approach for poorest districts and districts<br />
with greater access and livelihood opportunities and special<br />
support to vulneranble poor and backward ethnic groups such<br />
as Mushhar, Dom, Chamar, Raute, among others.<br />
PAF is working on its exit strategy focusing on its strategic<br />
thrust to enable community to go to a sustained path to get out<br />
of poverty within a stipulated 5-6 <strong>year</strong>s of time. In this line, PAF<br />
is now embracing a pocket area development approach based<br />
on the potential strength of the area. Monitoring, Research<br />
and Development is being further strengthened to support<br />
the programme implementation including capacity building<br />
of main actors i.e. community organizations(CO), Partner<br />
Organizations(PO), local bodies and PAF.<br />
Based on lessons learned, PAF is now working on the expansion<br />
of its programme in new VDCs and districts and important<br />
initiatives are taken for the institutionalization of Community<br />
Organizations as co-operative or other forms of institution and<br />
link with financial institutions and markets where programme<br />
is already in implementation. Also the PAF is laying special<br />
emphasis on the capacity building of community organizations,<br />
partner organizations and PAF while co-ordination and<br />
collaboration is being accorded high priority.<br />
I look forward to the support from all in our campaign to fight<br />
against poverty.<br />
Janak Raj Joshi<br />
Vice Chairman<br />
PAF<br />
ANNUAL PROGRESS REPORT (<strong>2010</strong>/20<strong>11</strong>)<br />
i
List of Abbreviations and Acronyms<br />
AEPC<br />
Alternative Energy Promotion Center<br />
CBS<br />
Central Bureau of Statistics<br />
CD<br />
Capacity Development<br />
CO<br />
Community Organization<br />
CI<br />
Community Infrastructure<br />
COP<br />
Community Organization of Poor<br />
CB<br />
Capacity Building<br />
CCP<br />
Community Contribution Plan<br />
CBOs<br />
Community Based Organizations<br />
CG<br />
Community Group<br />
CIP<br />
Community Infrastructure Project<br />
DDC<br />
District Development Committee<br />
DNPWC<br />
Department of National Park and Wildlife Conservation<br />
EIA<br />
Environmental Impact Assessment<br />
FPCRTF<br />
Food Price Crisis Response Trust <strong>Fund</strong><br />
FMR<br />
Financial Management Report<br />
FNCCI<br />
Federation of <strong>Nepal</strong>ese Chamber of Commerce and Industries<br />
GOs<br />
Governmental Organizations<br />
GIZ<br />
German International Cooperation<br />
GoN<br />
Government of <strong>Nepal</strong><br />
IG<br />
Income Generation<br />
IEE<br />
Initial Environmental Examination<br />
IESE<br />
Initial Environmental and Social Examination<br />
IDA<br />
International Development Agency, World Bank<br />
IFAD<br />
International <strong>Fund</strong> for Agriculture Development<br />
LDO<br />
Local Development Officer<br />
LDF<br />
Local Development <strong>Fund</strong><br />
LFLP<br />
Leasehold Forestry and Livestock Program<br />
MDGs<br />
Millennium Development Goals<br />
MIS<br />
Management Information System<br />
MLD<br />
Ministry of Local Development<br />
MoU<br />
Memorandum of Understanding<br />
NDM<br />
<strong>Nepal</strong> Development Market Place<br />
NEA<br />
<strong>Nepal</strong> Electricity Authority<br />
NGOs<br />
Non Governmental Organizations<br />
NPC<br />
National Planning Commission<br />
NOA<br />
Non Operating Account<br />
OA<br />
Operating Account<br />
OAG<br />
Office of the Auditor General<br />
O and M<br />
Operation and Maintenance<br />
PAF<br />
<strong>Poverty</strong> <strong>Alleviation</strong> <strong>Fund</strong><br />
PO<br />
Partner Organization<br />
PSOs<br />
Private Sector Organizations<br />
PM<br />
Portfolio Manager<br />
PMR<br />
Project Management Report<br />
RBB<br />
Rastriya Banijya Bank<br />
REDP<br />
Rural Energy Development Programme<br />
RCIW<br />
Rural Community Infrastructure Works<br />
R & D<br />
Research and Development<br />
SM<br />
Social Mobilization<br />
SAs<br />
Service Agencies<br />
SNV<br />
Netherlands Development Organization<br />
SRI<br />
System of Rice Intensification<br />
TAC<br />
Technical Appraisal Committee<br />
TU<br />
Tribhuwan University<br />
UG<br />
User Group<br />
UNICEF<br />
United Nations International Children’s Emergency <strong>Fund</strong><br />
USAID<br />
United States Agency for International Development<br />
USD<br />
United States Dollar<br />
VDC<br />
Village Development Committee<br />
VCDP<br />
Vulnerable Community Development Plan<br />
WFP<br />
World Food Programme<br />
WB<br />
World Bank<br />
ii ANNUAL PROGRESS REPORT (<strong>2010</strong>/20<strong>11</strong>)
Table of Contents<br />
Foreword<br />
List of Abbreviations and Acronyms<br />
Executive Director’s Report<br />
i<br />
ii<br />
v<br />
Chapter 1: Introduction<br />
1.1. PAF introduction 1<br />
1.2. The Strategy 1<br />
1.3. The Approach 1<br />
1.4. Institutional Arrangements 1<br />
1.5. Programme Components 1<br />
Institutional and implementation arrangements 3<br />
Links with Local Governments 3<br />
2.1. Annual Achievements Against Targets 5<br />
2.2. Component wise progress status 5<br />
2.2.1. Social Mobilization 5<br />
1. Demand Driven Community Proposal and Direct <strong>Fund</strong>ing 5<br />
Chapter 2: PAF Progress and Achievements<br />
2. Facilitation of Community Through POs 8<br />
3. Reaching Out to the Poor and Social Inclusion 8<br />
4. Community Institutional Building 10<br />
3.1. MIS, Monitoring and Evaluation 25<br />
Chapter 3: information, monitoring and evaluation<br />
3.2. Results From Monitoring Data Analysis 26<br />
3.3. Environmental Framework and Monitoring 26<br />
3.4. PO Performance Evaluations 26<br />
3.5. Impact Evaluation 26<br />
3.6. Communications, Outreach and Publications 27<br />
3.7. Grievance Handling 27<br />
Chapter 4: partnership and collaboration 29<br />
Chapter 5: THE OUTCOME AND RESULT 33<br />
Chapter 6: Financial Management 35<br />
Chapter 7: Lessons and Future Directions 38
LIST OF Success StorIES<br />
Soap Factory Set Up in Gokuleshwor 7<br />
Watch, Radio Shop Earn Livelihood 14<br />
Livestock Insurance Providing Boon for Community 31<br />
Pig Farming Transforms Lives of Dalits 32<br />
LIST OF ANNEXES<br />
Annex 1: Current Board of Governors (as of January 2012) 40<br />
Ex-Board Members Who Served During The Reporting Year (Fy <strong>2010</strong>-<strong>11</strong>)<br />
Annex 2: CO registration, agreement for sub-project and disbursement status<br />
(<strong>Fiscal</strong> <strong>year</strong> <strong>2010</strong>/<strong>11</strong> only) 41<br />
Annex 3: CO registration, agreement for sub-project and disbursement status (Cumulative) 42<br />
Annex 4: POs, COs and Coverage (<strong>Fiscal</strong> <strong>year</strong> <strong>2010</strong>/<strong>11</strong> only) 43<br />
Annex 5: POs, COs and Coverage (cumulative to date)c 45<br />
Annex 6: PAF in Terai Border VDCs 47<br />
Annex 7: PAF in Karnali 47<br />
Annex 8: Community Institutional Development 48<br />
List of CO Federations in Districts<br />
Annex 9: Status of the On-going Innovative Sub-projects 49<br />
List of Cooperatives formed through CO’s initiatives in Districts<br />
Annex 10: Various Trainings to The Members of COs By Districts 50<br />
Annex <strong>11</strong>: PO Capacity Development Status 54<br />
Annex 12: Gross Annual Income Change of CO members 55<br />
Annex 13: Summary Results of Revolving <strong>Fund</strong> Status <strong>2010</strong> 57<br />
Annex 14: PAF Result Matrix 58<br />
Annex 15: Year wise Target vs. Achievements 61<br />
Annex 16: Details of expenditure up to July 16, 20<strong>11</strong> (Cumulative PAF-I and PAF-II) 61<br />
Annex 17 (1): Program <strong>Fund</strong>ing Status of FY-2067/68 (<strong>2010</strong>/<strong>11</strong> only) 62<br />
Annex 17 (2): District wise Target Vs Achievement in FY-2067/68 (<strong>2010</strong>/<strong>11</strong> only) 63<br />
Annex 18: <strong>Poverty</strong> <strong>Alleviation</strong> <strong>Fund</strong> Project – II Progress Status 65<br />
Annex19: PAF II CO registration, agreement for sub-project and<br />
disbursement status (cumulative) 66<br />
Annex 20: PAF II Expenditure (in NRs.) 67<br />
Annex 21: Summary Results of Follow-on Impact Survey <strong>2010</strong><br />
(Done by TU and the World Bank) 68<br />
Annex 22: Un-audited Financial Statement for FY <strong>2010</strong>-<strong>11</strong> 70<br />
Annex 22: Un-audited Project Account for FY <strong>2010</strong>-<strong>11</strong> 72<br />
Annex 24: Current Staff List (as of January 2012) 91
Executive<br />
Director’s<br />
Report<br />
Making Communities Empowered<br />
In<br />
our continued crusade against poverty, the reporting<br />
<strong>year</strong> has remained important for many reasons.<br />
Firstly, different impact evaluation studies have<br />
confirmed that PAF has helped to raise per capita<br />
consumption, average income, food sufficiency, child schooling<br />
and access to services and women's empowerment. PAF has<br />
also created and improved community assets in rural areas<br />
benefiting large number of the rural population. These findings<br />
are the results of a comprehensive and independent follow- up<br />
study done in <strong>2010</strong> in the 6 sample districts conducted by TU<br />
and two separate studies on social re-assessment and revolving<br />
fund by PAF itself.<br />
Secondly, PAF was able to receive the additional financing of<br />
US$ 75 million to strengthen its impact on the lives of the poor<br />
and cover additional poor households under the programme.<br />
The government of <strong>Nepal</strong> and WB signed a grant agreement on<br />
July 13, 20<strong>11</strong> for the additional funding for the ongoing second<br />
phase of PAF. Also, PAF has added more strategic partners<br />
during the <strong>year</strong> as several Memorandum of Understandings<br />
(MoUs) have also been signed with different organizations at<br />
central level to facilitate different task as well as to facilitate<br />
collaboration in implementation of sub-projects at community<br />
level with complementarities.<br />
Seven <strong>year</strong>s on the ground, a total of 17,898 community<br />
organizations (COs) of poor are registered with PAF, out of which<br />
PAF has already inked agreements with 16,819 COs. In their bid<br />
to sustainability and institutional growth, communities have also<br />
begun to build federations, network of COs and co-operatives.<br />
So far, 53 Multi-purpose co-operatives and 547 federation<br />
of COs have already been formed. The PAF supported COs<br />
are currently pursuing 16, 576 Income Generation and 3039<br />
Infrastructure related sub-projects till the end of the reporting<br />
period.<br />
Reaching Out to the Poor<br />
PAF is now currently working in 40 poorest districts defined<br />
by the Central Bureau of Statistics while additional 19 districts<br />
are also covered under separate innovotive window and <strong>Nepal</strong><br />
Development Market Place (NDM). Among the 40 districts,<br />
PAF is working in 71 per cent of total VDCs (87 per cent in 25<br />
districts and 50 per cent in 15 districts).<br />
All five districts of the Karnali zone are covered by the<br />
programme. Till date, programme has reached 134 VDCs i.e.<br />
100 per cent of 134 VDCs in Karnali and benefitted 54,329 poor<br />
households while Programme is covering Ten (10) districts in<br />
Terai (Mahottari, Rautahat, Sarlahi, Kapilbastu, Siraha, Bara,<br />
Bardiya, Dhanusa, Parsa, Saptari) and benefitted 159,647HHs<br />
covering 590 VDCs (i.e. 17 per cent of poor HHs and 52 per<br />
cent of VDCs). Out of 146 border VDCs of Kapilbastu, Mahottari,<br />
Rautahat, Sarlahi and Siraha among above Terai districts, PAF<br />
program coveres 95 VDCs (i.e. 65 per cent) and benifitted<br />
20,015 HHs<br />
Further, innnovative pocket programme is still continued in<br />
Makawanpur, Morang, Kanchanpur and Chitwan districts. It has<br />
reached additional 13,376 poor households in 48 VDCs in those<br />
districts.<br />
In an overall scenario, PAF has covered 470,021 poor HHs<br />
as CO member beneficiaries, among which a total of 65.8<br />
per cent members falls under hardcore poor category (food<br />
sufficiency less than 3 months among other criteria fixed by<br />
the communities), 25.41 per cent members falls under medium<br />
poor category (food sufficiency more than 3 months but less<br />
than 6 months among other criteria set by the communities), 8.6<br />
per cent members falls under poor category (food sufficiency<br />
more than 6 months but less than a <strong>year</strong> among other criteria<br />
set by the communities) and 0.2 per cent members falls under<br />
marginal “non-poor” Category.<br />
Likewise, CO member households constitutes 29 per cent Dalit,<br />
28 per cent Janajati, 3 per cent Muslim, 30 per cent Brahmin/<br />
Chhetri and 10 per cent other caste and ethnicity. Gender-wise,<br />
74 per cent are female members in COs.<br />
Similarly, the key position holders in the community organisation<br />
such as president, treasurer, secretary constitutes, 34 per cent<br />
Dalit, 27 per cent Janajati, and 2 per cent Muslims and 29 per cent<br />
Brahman/Chettri, and 8 per cent from other caste and ethnicity.<br />
Gender-wise, 62 per cent key position holders in CO are female.<br />
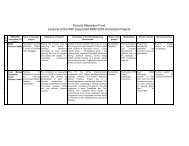
When per centage beneficiery of PAF by caste and ethnicity is<br />
compared with district per centage ethnicity composition(as<br />
ANNUAL PROGRESS REPORT (<strong>2010</strong>/20<strong>11</strong>)<br />
v
shown in the graph below), it is obvious that PAF is focusing on<br />
socially excluded and disadvantageds groups such as Dalit and<br />
Janajati. By and large, PAF has covered almost 100 per cent of<br />
Dalit in initital 25 districts. Also PAF has benefited almost 90 per<br />
cent of the poor households in 25 districts.<br />
Programme Cost Sharing<br />
1200000<br />
1000000<br />
800000<br />
600000<br />
400000<br />
200000<br />
Percentage<br />
80.00<br />
70.00<br />
60.00<br />
50.00<br />
40.00<br />
30.00<br />
20.00<br />
10.00<br />
0.00<br />
0<br />
Dalit, <strong>11</strong>.66<br />
Total HH<br />
Janajati,<br />
18.66<br />
District<br />
Total District Poor<br />
HH<br />
Chart a: PAF Benefited Poor HHs in 25 Districts<br />
Others,<br />
69.69<br />
Dalit,<br />
29.43<br />
PAF Benefitted HH<br />
(93.42% of District Poor HH)<br />
Janajati,<br />
25.92<br />
CO Member<br />
Beneficiaries<br />
Others,<br />
44.66<br />
Chart b: District Population Ethnicity Composition Vs PAF Beneficiary in<br />
25 Districts<br />
PAF is investing 80.6 per cent (i.e. Rs. 9,183m) of the total subproject<br />
cost. Community sharing is 15 per cent (7 per cent in<br />
Cash— i.e. Rs. 761m and 8 per cent in Kind—i.e. Rs. 881m) of the<br />
total sub-project costs whereas VDC/DDC and other development<br />
partners are sharing 5 per cent (i.e. Rs. 564m) in total sub-project<br />
cost. In Income Generating sub projects, community is sharing 9<br />
per cent in cash and 2 per cent in kind whereas in Infrastructure<br />
sub projects, it is 1 per cent in cash and 24 per cent in kind. Apart<br />
from community contribution, DDC/VDC are sharing 1 per cent of<br />
the cost and other collaborating partners are sharing 4 per cent of<br />
the cost in infrastructure sub-projects.<br />
Out of the total PAF investment, 79 per cent is for income<br />
generating sub-projects and 21 per cent for infrastructure subprojects.<br />
About 87 per cent of the PAF investment in income<br />
generating sub-projects is established in community managed<br />
Revolving <strong>Fund</strong>(RF).<br />
Community Institutional Development<br />
Community institutionalization process is taking place in some<br />
of the districts where community has felt need to federate<br />
themselves for certain purpose. Multi-purpose co-operatives,<br />
co-operatives for single purpose and federation of COs are<br />
formed as per communities’ felt need. Informal networks of COs<br />
are being formed in each VDC as a process of instiutionalization.<br />
A total of 166 CO federations are formed till the end of the<br />
reporting <strong>year</strong>. Also, 53 cooperatives are established on the<br />
aegis of the PAF supported community organizations to carry<br />
out different activities aiming at alleviating poverty.<br />
Collaboration in Sub-projects Implementation<br />
PAF emphasized in collaboration with different partners while<br />
implementing its program its program at the district level. For<br />
this purpose, PAF has signed MoUs with MLD, WFP, DNPWC,<br />
REDP, Helvetas, USAID/EIG, Heifer, LFLP and FNCCI, among<br />
others so to strengthen synergies between programmes.<br />
PAF Outcomes<br />
The follow-up study in six sample districts, and three<br />
controlled districts, shows that the net program impact on<br />
per capita consumption (in real terms adjusted for price<br />
inflation) increased by 49 per cent for those beneficiaries<br />
who have received the money for at least six months and 28<br />
per cent for all beneficiaries’ who were PAF money recipient<br />
households (HHs) with food sufficiency for six months or less<br />
has decreased by 10 per cent.<br />
The social re-assessment, has shown that the average income<br />
of individual household has increased by 82.5 per cent. The<br />
comparative analysis, with three or more than three <strong>year</strong>s<br />
of maturity period, shows that HH level assets and school<br />
enrollment status of the children have increased while there<br />
was a marked improvement in food sufficiency for individual<br />
households. Also,construction and use of toilet/latrine has<br />
increased.<br />
Also, the revolving fund assessment carried out during the end<br />
of FY 2066/67, shows that communities are managing their<br />
revolving fund satisfactorily. The data collected as of 16 July<br />
<strong>2010</strong>, shows that the fund provided by PAF has increased by<br />
7.8 per cent. Similarly, among the total CO members, 84.6 per<br />
cent of the members have accessed the fund, at least, for once<br />
to initiate their income generation activities. The assessment<br />
also shows that 83.8 per cent of the total fund has been invested<br />
as loans to its members, 14.1 per cent deposited at the bank<br />
and the remaining fund is with the COs in the form of the cash.<br />
Further, assessment shows that the average rate of repayment<br />
is 76.1 per cent.<br />
vi ANNUAL PROGRESS REPORT (<strong>2010</strong>/20<strong>11</strong>)
Budget Expenditure<br />
Out of the total PAF expenditure upto FY 2067/68 (<strong>2010</strong>/<strong>11</strong>),<br />
93.52 per cent is from IDA (International Development Agencythe<br />
World Bank) grant, 2.21 per cent is from IFAD (International<br />
<strong>Fund</strong> for Agriculture Development) grant and the rest 4.26 per<br />
cent from GoN (Government of <strong>Nepal</strong>).<br />
In this FY 2067/68 (<strong>2010</strong>/<strong>11</strong>), total expenditure is Rs.<br />
2,60,12,83,022.25 which is 85.59 per cent of total budget of<br />
Rs.3, 039,166,000. Currently the PAF Project II is funded by IDA<br />
Grant with US$ 100m and IFAD Grant of US$ 4m for four <strong>year</strong>s<br />
till January 2012. IDA disbursement to this PAF II project till<br />
date is 98.49 per cent (as advance) i.e. equivalent to about US$<br />
98.49m. IFAD disbursement to PAF till the end of the reporting<br />
period is US$ 2.29m.<br />
Recently, IDA hs agreed to provide additional finacing of US$<br />
75m (out of which US$65m is from IDA grant and US$ 10m<br />
grant is from FPCRTF) for PAF II project.<br />
Lessons and Challenges<br />
In view of the wide varieties of activities undertaken within the<br />
sub-project, the challenges faced for sustainability of the subprojects<br />
include the linkage with market for sustaining incomegenerating<br />
activities as well as the availibility of Insurance<br />
Safety-Net particularly for livestock. PAF is also to explore an<br />
alternative to livestock based activities for landless poor as<br />
there still persists a trend of huge demand of livestock related<br />
sub-projects. Another important issue before PAF is to build the<br />
community’s capacity to manage revolving fund and operate<br />
the sub-projects sustainably. It also need to raise the awareness<br />
of the community through functional literactcy. Similarly, there<br />
is a need to adopt different approach for poorest districts and<br />
districts with greater access and livelihood opportunities and<br />
special support to vulnernble poor, marginalized ethnic groups<br />
such as Mushhar, Dom, Chamar, Raute, among others.<br />
While working towards above challenges, it is inevitable to<br />
work with diversified groups of poor communities supporting<br />
each other and network for linkages and collaboration with<br />
other programmes and line agencies to support communities.<br />
Further, legal institutionalization of Community Organizations<br />
through coalition or formation of functional co-operatives<br />
and establishment of strong linkages with VDC/ DDC are also<br />
important for sustainability and long-term support to these<br />
community groups. PAF is also initiating dialogue to formulate<br />
a separate act to govern community organizations and self<br />
help groups to avoide duplications and sustain community<br />
efforts.<br />
PAF is working with its exit strategy focusing on its strategic<br />
thrust to enable community to go to sustained path to get out<br />
of poverty within a stipulated 5-6 <strong>year</strong>s of time. In this line, PAF<br />
needs to work on pocket area development approach based on<br />
the strength local potentials and at the same time, focus will be<br />
given to nutrition improvement by diversifying production and<br />
providing special focus to marginalized community groups.<br />
The emphasis will be given for infrastructural development<br />
to support these initiatives. Monitoring, Research and<br />
Development needs to be further strengthened to support the<br />
implementation including capacity building of main actors i.e.<br />
CO, PO, Local Bodies and PAF.<br />
The future strategy<br />
Based on lessons learned, PAF will work for the expansion<br />
of its programme in new VDCs and districts and important<br />
initiatives will be taken for the institutionalization of Community<br />
Organizations as co-operative or other forms of institution<br />
as per their decision and link with financial institutions and<br />
markets where programme is already in implementation. PAF<br />
will also emphasize on the capacity Building of community<br />
organizations, partner organizations and PAF while Coordination<br />
and collaboration would also be accorded high<br />
priority. This <strong>year</strong> onwards PAF is strenghening on syststematic<br />
Grievance Handling Process with stakeholders views on the<br />
effective Performance Management System of COs, POs and<br />
PAF secretariat.<br />
We look forward to work together with all stakeholders in the<br />
days to come.<br />
Thank you.<br />
Raj Babu Shrestha<br />
Executive Director<br />
ANNUAL PROGRESS REPORT (<strong>2010</strong>/20<strong>11</strong>)<br />
vii
Chapter 1:<br />
Introduction<br />
1.1. PAF introduction<br />
A quarter of the <strong>Nepal</strong>i population still lives below poverty line. The<br />
majorities of the poor live predominantly in rural areas and engage in<br />
traditional and subsistence farming on small plots of low quality land,<br />
have limited access to credit, infrastructure, markets and basic social<br />
services, often because of remoteness, and rely heavily on seasonal<br />
migration and remittance.<br />
<strong>Poverty</strong> <strong>Alleviation</strong> <strong>Fund</strong> (PAF) was established in 2004 as a special<br />
and targeted programme to bring the excluded communities in the<br />
mainstream of development, by involving the poor and disadvantaged<br />
groups themselves in the driving seat of development efforts. PAF is<br />
contributing on bringing the level of poverty down to 10 per cent in<br />
20 <strong>year</strong>s in pursuant with the long term goal of Government of <strong>Nepal</strong>;<br />
and reduce poverty by half by the <strong>year</strong> 2015 as per the Millennium<br />
Development Goals (MDGs).<br />
1.2. The Strategy<br />
PAF has taken strategy to enable poor people through social mobilization<br />
and capacity building to organize and obtain quality basic services in<br />
cost-effective and sustainable manner with their direct involvement.<br />
PAF uses Partner Organizations (POs) to help facilitate poor vulnerable<br />
people and their community Groups or Organizations to implement the<br />
programme components, and they include local bodies, NGOs/ CBOs<br />
and private sector organizations. PAF also seeks to forge partnership<br />
with various organizations working in its areas of operation at the<br />
village, district and national level in order to ensure holistic development<br />
intervention to bring discernible impact on poverty reduction and scaling<br />
up the programmes in considerably less time<br />
1.3. The Approach<br />
PAF has followed six guiding principles: namely (a) Targeted to the poor<br />
(Antodaya) (b) Social Inclusion (Samabesi) (c) Demand Driven approach<br />
(Maag Anusar) (d) Transparency (Pardarsita), (e) Direct funding to<br />
community organizations of the poor (Prataksha Bhuktani), and (f)<br />
Community Institutional Development (Samudaya Ko Sansthagat Bikash).<br />
Social Mobilization, Income Generation, Small Community<br />
Infrastructure Development and Capacity Building are the four major<br />
programme components of PAF. The target beneficiaries of PAF are the<br />
poor women, Dalit, Janajatis, and the vulnerable communities living<br />
below the poverty line.<br />
1.4. Institutional Arrangements<br />
Initially established by an ordinance in 2004, PAF is governed by an act<br />
since 2006, thus PAF is an autonomous, independent and professional<br />
organization governed by separate law. The 12- member governing<br />
board, chaired by the Prime Minister, is responsible for policy guidance<br />
and programme approval.<br />
Vice-chairperson and 5 members- are appointed by the government from<br />
among the development professionals while other 5 ex-officio members<br />
include National Planning Commission (NPC) Secretary, Chairman of<br />
the Association of District Development Committees of <strong>Nepal</strong> (ADDCN),<br />
Chairman of Association of Village Development Committees of <strong>Nepal</strong><br />
(AVDCN), Chairman of National Women Commission (NWC), and<br />
Chairman of National Dalit Commission (NDC).<br />
Currently, the PAF secretariat consists of 62 staffs, mostly professional,<br />
recruited on a competitive basis. A total of 370 partner organizations<br />
work on behalf of the poor in 40 programme districts.<br />
1.5. Programme Components<br />
(a) Small-Scale Village and Community Infrastructure: Given the<br />
remoteness of many communities and the virtual non-existence of public<br />
infrastructure services, small investments in infrastructure and services<br />
can make a significant difference to poor communities. The communities<br />
are often very clear on what they need, and are willing to contribute to<br />
sub-projects within their means. Consideration is given to sub-projects<br />
already included in VDC plans and/or where the District Development<br />
Committee (DDC) and/or VDC are prepared to provide matching grants.<br />
Key selection criteria include the number of target households that would<br />
benefit and the expected employment impact. In addition, infrastructure<br />
sub-projects would require communities to prepare and commit to a<br />
realistic Operations and Maintenance (O&M) plan. Partner organizations<br />
ANNUAL PROGRESS REPORT (<strong>2010</strong>/20<strong>11</strong>) 1
(POs) would also be used to facilitate the process of community<br />
organization and capacity building in advance for the preparation of subproject<br />
proposals. Community contributions would average 10%, with<br />
adjustments made for very remote and difficult areas. In the sectors<br />
where policies are in place that require a higher community contribution<br />
(e.g., 20% in rural water, with possible adjustments for very remote or<br />
poor communities), such rates would be applied to ensure consistency.<br />
Examples of sub-projects implemented to date under PAF include link<br />
roads, culverts, footbridges, micro-hydro, micro-irrigation, water supply<br />
and sanitation schemes, and community meeting halls, schools, health<br />
facilities and other small-scale infrastructure.<br />
(b) Income Generating Sub-projects: Matching grants is provided<br />
to self-selected groups of poor and excluded people for incomegeneration<br />
activities, based on objective criteria including ethnicity,<br />
caste, gender and poverty levels. Beneficiaries contribute 10 per cent<br />
of the sub-project cost in cash. A proportion of the grants is reserved<br />
for technical assistance to be contracted by communities themselves<br />
in areas where they felt such need. Under PAF I, communities have had<br />
discretion as to how to manage the funds received, with a number of<br />
them choosing to revolve the funds within their group. Under PAF II,<br />
any groups choosing to manage resources in this way are receiving<br />
training in community-managed finance – under the capacity building<br />
component – with a view to strengthen them to eventually have access<br />
sponsored by organizations representing or working with the target<br />
groups, target groups themselves and/or local bodies. Examples under<br />
the first phase of PAF have included innovations such as arsenic filters,<br />
forest based cardamom cultivation, evaporative cooling technology for<br />
food preservation and women’s health projects.<br />
(d) Capacity Building: This would include five sub-components:<br />
(i) Social Mobilization of Community Groups: This subcomponent<br />
is supporting training/skills development for POs<br />
themselves and for capacity building of community groups. POs<br />
are selected to work in target areas to disseminate information<br />
about the project, mobilize community groups, work with them in<br />
developing sub-project proposals and develop their skills in project<br />
management, financial management (FM), procurement, monitoring<br />
and evaluation etc. where local governments are functioning,<br />
POs are also liaised with them to ensure that the proposed subprojects<br />
are consistent with VDC plans and priorities. In addition to<br />
mobilization of communities, capacity of POs themselves is also<br />
built under this sub-component, such that they are sensitive to key<br />
social, environmental and livelihoods-related issues such as gender,<br />
caste, disability, sustainability, accountability and local governance,<br />
natural resource management, and market linkages, etc. More<br />
importantly, POs are partnered exclusively for social mobilization,<br />
facilitation, technical backstopping and monitoring of COs.<br />
to broader financial services for livelihoods initiatives. As with other subprojects,<br />
POs are contracted by the PAF to work with all communities,<br />
including through locally selected community facilitators, to assist in<br />
participatory processes, group formation, and development of sound<br />
sub-project proposals. Particular attention is paid to the commercial/<br />
economic viability of income-generating sub-projects to avoid the risk<br />
of supply or NGO driven proposals which are not sufficiently well linked<br />
with markets. Common examples to date under PAF have included<br />
micro-irrigation, micro enterprises/service sector activities, artisan/<br />
crafts, land productivity investments, trading and animal husbandry.<br />
Analysis of a representative sample of these investments shows income<br />
increases for beneficiary households of 10-15%.<br />
(c) Innovation and Special Programs: An innovation window is<br />
continued to support proposals meriting special consideration owing<br />
to exceptional needs in a given context, or demonstrating innovative<br />
ways to improve livelihoods development and reach targeted groups.<br />
These proposals can be national or regional in coverage and may be<br />
(ii) Capacity Building for Local Bodies: The extent of<br />
decentralization in <strong>Nepal</strong> is limited, particularly given the continued<br />
absence of elected local bodies which were dissolved during the<br />
conflict period. With a view to supporting intermediary delivery<br />
channels that lay the foundation for strengthened local government,<br />
this sub-component is focusing on building capacity of functioning<br />
and interested local bodies (VDCs, DDCs) in pro-poor planning and<br />
monitoring, and other relevant topics to promote inclusive planning<br />
and service delivery for local development, as well as on the rules of<br />
operation of the PAF in order to enable local bodies to assist groups<br />
and communities to access PAF resources.<br />
(iii) Capacity Building for Target Groups Engaged in Income-<br />
Generating Activities: All sub-projects include some provision for<br />
technical assistance as needed, but groups engaged in incomegenerating<br />
activities may require more support to help prepare for<br />
the activity or to help implement it successfully. Therefore, this subcomponent<br />
would focus on developing skills such as marketing,<br />
2 ANNUAL PROGRESS REPORT (<strong>2010</strong>/20<strong>11</strong>)
transport logistics, financing, and quality control. A capacity building<br />
agency would be contracted by PAF to work with community groups<br />
to identify needs, develop capacity-building plans and procure<br />
relevant technical assistance.<br />
(iv) Support to Rural and Community Finance: There is ample<br />
evidence that the vast majority of PAF beneficiaries do not have<br />
access to rural financial services, including microfinance lending.<br />
With a view to the longer-term sustainability and growth of the<br />
community Income Generating Activities (IGAs) and enterprises,<br />
PAF is supporting training for community-managed finance in order<br />
to strengthen institutions and encourage eventual access to broader<br />
financial services for livelihood support. To achieve this objective,<br />
this sub-component would finance mapping and monitoring<br />
of those emergent groups revolving their PAF grant funds and<br />
mobilizing savings; provide training and capacity building support to<br />
strengthen these activities; explore linkages to financial institutions<br />
and relevant partners; and support PAF’s articulation of a longer<br />
term vision or ‘graduation strategy’ for viable community institutions<br />
and enterprises.<br />
(v) Information, Monitoring and Evaluation: This subcomponent<br />
include: (a) dissemination of information about the<br />
project and other public sector programmes; (b) support for<br />
PAF’s management information system (MIS), which will need<br />
to be expanded to accommodate the scaled-up programme; (c)<br />
structured monitoring activities, including field visits to assess<br />
progress; (d) regular beneficiary assessments, including qualitative<br />
field work; and (e) follow-on impact assessment surveys to refine<br />
and monitor against the project<br />
Institutional and<br />
implementation arrangements<br />
At the national level, overall project management responsibility is with<br />
the PAF Board, chaired by the Prime Minister. The Vice Chairman<br />
functions as a full time executive of PAF, and the Board includes ten other<br />
Members. The Executive Director of PAF serves the Secretary of the<br />
Board. The ex-officio members are the Secretary of the National Planning<br />
Commission, the Chairpersons of the Federation of District Development<br />
Committee, the Village Development Committee, the National Women’s<br />
Commission and National Dalit Commission. Other appointed members<br />
are five prominent professional persons, including a woman, who have<br />
contributed to poverty alleviation in <strong>Nepal</strong>. PAF has a lean structure<br />
with a limited number of staff who have been recruited on fixed term<br />
contracts on a competitive basis, and a number of consultants and/or<br />
NGOs who are retained to support operations as needed.<br />
At the regional level, PAF is seeking to establish offices in those locations<br />
where the volume of work requires a presence, but keeps its own staff<br />
to a minimum. PAF works through POs which it recruits competitively,<br />
for purposes of social mobilization and capacity building at the<br />
community level. These POs disseminate information about the project,<br />
mobilize community groups, work with them and build their capacity<br />
to develop and manage sub-project proposals, and monitor the quality<br />
of participation. POs can be NGOs; community based organizations,<br />
or VDCs/DDCs, provided they meet PAF eligibility criteria. POs are<br />
required to appoint community facilitators in each target village, who<br />
must be trusted by and selected in consultation with the communities,<br />
with attention to PAF’s aim of reaching excluded groups. POs also liaise<br />
with local bodies to ensure that proposed infrastructure sub-projects<br />
are consistent with VDC/DDC plans and priorities. While POs may be<br />
entrusted by community groups to submit final sub-project proposals<br />
to PAF, once approved, grant funds flow directly to communities and not<br />
through POs.<br />
At the community level, PAF supports two types of sub-projects: (i) smallscale<br />
village infrastructure and services, and (ii) income generation. The<br />
same basic rules apply: sub-project proposals are identified by groups<br />
of poor people (which could include members of a village or several<br />
villages) who come together as community groups/organizations (COs);<br />
decisions regarding sub-projects are participatory and inclusive, and this<br />
is carefully monitored; the community groups make cash contributions;<br />
there are ceilings on the investment per household and on the size of<br />
each sub-project; and funds for implementation of sub-projects and<br />
technical assistance are deposited in community bank accounts.<br />
The village-level project cycle comprises: (a) community mobilization;<br />
(b) sub-project preparation including development of an operations<br />
and maintenance plan; (c) appraisal; (d) approval by the PAF Technical<br />
Appraisal Committee (TAC) and (e) implementation. Where local<br />
governments are operational, the DDCs and the VDCs also need to<br />
endorse infrastructure sub-projects. Final sub-project proposals are<br />
appraised by PAF staff and approved by the Board, although approval<br />
authority can be delegated to Portfolio Manager.<br />
Links with Local Governments<br />
PAF’s institutional arrangements at the local level is linked with<br />
government local bodies in the following way: (i) there is a dedicated<br />
component on capacity building for local bodies (ii) DDC/VDCs can be<br />
POs; (iii) all infrastructure sub-projects that are going to be financed<br />
through PAF have to be incorporated in VDC and the DDC annual plans;<br />
and (iv) for larger infrastructure demands from communities, VDCs<br />
and DDCs can co-finance any investment as long as PAF rules and<br />
criteria are met.<br />
ANNUAL PROGRESS REPORT (<strong>2010</strong>/20<strong>11</strong>) 3
4 ANNUAL PROGRESS REPORT (<strong>2010</strong>/20<strong>11</strong>)
Chapter 2:<br />
PAF Progress and<br />
Achievements<br />
This chapter discusses the annual achievements against<br />
the target and overall implementation status of the<br />
different programme components during the reporting<br />
period as well as the cumulative achievements<br />
2.1. Annual Achievements Against Targets<br />
PAF had set a definite target in its key components--social mobilization, income generation, community infrastructure activities, capacity building and<br />
innovative sub-projects. The table below summarizes the achievements of the reporting <strong>year</strong> against the annual target:<br />
Table 1: Annual Achievements against targets for FY <strong>2010</strong>-<strong>11</strong><br />
Description Annual Target Physical Progress Progress %<br />
Income Generation Sub-Projects 1,738 2,790 161<br />
Infrastructure Sub-Projects 395 338 86<br />
Innovative Sub-Projects 60 20 33<br />
Total Sub-Projects 2,193 3,148 144<br />
Beneficiary HHs(including Infra sub-projects) 85,000 75,629 89<br />
Programme <strong>Fund</strong>ing status for the reporting <strong>year</strong> Rs. 3,039,166,000 Rs. 2,601,283,022.25 85.59<br />
For the reporting <strong>year</strong> <strong>2010</strong>-<strong>11</strong>, the achievement in income generations sub-projects was far above the target i.e. 161 per cent while for infrastructure<br />
related projects the achievement was above 86 per cent. In case of innovative sub-projects, PAF had set an annual outputs of 60 sub-projects, while<br />
the achievements has stood at only 20 (33 per cent). Similarly, in the case of PAF expenditure for the reporting <strong>year</strong>, the achievement was 85.59 per<br />
cent against the project expenditure target of 3,039.1 million (Annex 17).<br />
2.2. Component wise progress status<br />
2.2.1. Social Mobilization<br />
The objective of the social mobilization is to build up capacity of communities for preparation, design, implementation, operation and management of<br />
community sub-projects to enhance their livelihoods.<br />
1. Demand Driven Community Proposal and Direct <strong>Fund</strong>ing<br />
1.1. Community Organizations, Sub-projects and Investments<br />
A total of 17,898 community organizations (COs) were registered with PAF (2,007 in Mountain, 9,653 in Hilly region and 5,773 in Terai districts and<br />
465 through Innovative Window Programme Districts) till the end of the reporting <strong>year</strong>.<br />
Of the total registered COs, PAF has inked agreements with 16,819 COs (1,862 in Mountain, 8,818 in Hilly region and 5,698 in Terai districts and<br />
remaining 441 in Innovative Window Programme Districts) to implement different IG and community infrastructures related sub-projects.<br />
During the reporting <strong>year</strong>, 3,070 COs were registered and 2,832 COs were entered into agreement with PAF for implementing the comunity sub projects.<br />
Similarly, 3,148 number of agreements were done for various IG and INFRA subprojects (refer Table 2 on next page).<br />
ANNUAL PROGRESS REPORT (<strong>2010</strong>/20<strong>11</strong>) 5
Table 2: CO registration, CO Agreement and Sub-project Agreement<br />
FY <strong>2010</strong>/<strong>11</strong><br />
Cumulative<br />
Categories<br />
No. of Regd. COs<br />
Agreement<br />
No. of Regd. COs<br />
Agreement<br />
No. of COs No. Of Agreement No. of COs No. Of Agreement<br />
Mountain 6<strong>11</strong> 519 590 2,007 1,862 2,100<br />
Hills 1367 1,149 1,309 9,653 8,818 10,198<br />
Terai 1,066 1,144 1,229 5,773 5,698 5,888<br />
Innovative Districts 26 20 20 465 441 492<br />
Grand total 3,070 2,832 3,148 17,898 16,819 18,678<br />
In the case of income generation, the most demanded activities from the community are related to agriculture, livestock, cottage industries, trade and<br />
skill based services. Similarly, infrastructure sub-projects are related to micro-irrigation, link road, culvert/bridge, ropeway, electricity/micro-hydro,<br />
water mill, water supply, sanitation, school and health post building, among others.<br />
Table 3: PAF investment to the Community Sub -projects<br />
Categories<br />
FY <strong>2010</strong>/<strong>11</strong>(Million Rs.)<br />
Cumulative (Million Rs.)<br />
IG Infra Total IG Infra Total<br />
Mountain 191.812 59.104 250.916 919.531 189.628 1,109.159<br />
Hills 451.545 194.918 646.462 3,640.130 1,350.903 4,997.322<br />
Terai 614.779 90.399 705.177 2,535.484 341.379 2,871.525<br />
Innovative Districts 6.023 0 6.023 153.826 51.475 205.302<br />
Grand total 1,264.157 344.421 1,608.578 7,248.973 1,933.386 9,183.310<br />
Till the end of previous FY 2009/10, agreements were made with 13,987 COs amounting to Rs. 7,574m while during the reporting <strong>year</strong> alone additional<br />
2,832 COs signed agreement amounting to 1,608m. Therefore in cumulative terms, agreements were made with 16,819 COs amounting Rs. 9,183m<br />
till the end of reporting <strong>year</strong> i.e. FY <strong>2010</strong>/<strong>11</strong>. Details are illustrated in Annex 2, Annex 3, Annex 4 and Annex 5. PAF coverage in Terai border VDCs and<br />
Karnali region is given in Annex 6 and Annex 7.<br />
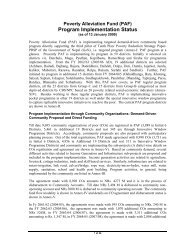
1.2. Programme Cost Sharing (Investment—IG Vs Infra, PAF Vs Community)<br />
PAF alone has invested Rs. 1,263m in IG activities during the reporting <strong>year</strong> against the total cumulative investment of Rs. 7,248m till the end of the<br />
reporting <strong>year</strong>. In the case of Infra. schemes, PAF invested 344m during the reporting <strong>year</strong> while cumulative investment has remained at Rs. 1933m.<br />
Overall, out of the total PAF investment, 79 per cent has been made in income generating sub-projects and 21 per cent has been funneled in infrastructure<br />
related sub-projects.<br />
In terms of region-wise investment, PAF has invested the highest amount for IG sub-projects in hilly region, followed by Terai, mountain and innovative<br />
districts. Similar investment trends is maintained in infra sub-projects as well (See in chart).<br />
In cumulative average, community sharing is 15 per cent (13 per cent in cash and 2 per cent in kind) of the total sub-project cost whereas others, mainly<br />
the VDCs and DDCs, have shared 1 per cent of the total sub-project cost. In total, PAF has invested 80 per cent of the community sub-projects cost.<br />
chart 1: PAF Investment Income Generation Vs Infrastructure<br />
chart 2: PAF Investment<br />
Amount<br />
21%<br />
4,500,000,000<br />
4,000,000,000<br />
3,500,000,000<br />
IG<br />
PAF (INFRA)<br />
PAF (IG)<br />
3,000,000,000<br />
2,500,000,000<br />
2,000,000,000<br />
1,500,000,000<br />
INFRA<br />
IG<br />
79%<br />
1,000,000,000<br />
500,000,000<br />
0<br />
IG<br />
INFRA<br />
INFRA<br />
Hill Mountain Terai<br />
Region<br />
6 ANNUAL PROGRESS REPORT (<strong>2010</strong>/20<strong>11</strong>)
chart 3: Contribution in Sub-projects (IG+INGRA)<br />
chart 4: Contribution in INFRA sub-projects<br />
Others<br />
4%<br />
Others<br />
7%<br />
DDC/VDC<br />
2%<br />
PAF<br />
80%<br />
DDC/VDC<br />
1%<br />
PO<br />
0%<br />
CO Kind<br />
2%<br />
PAF<br />
66%<br />
CO Kind<br />
24%<br />
CO Cash<br />
13%<br />
CO Cash<br />
1%<br />
Soap factory set up<br />
in Gokuleshwor<br />
Implementation of PAF programmes in Gokulehswor, Baitadi<br />
has reached 5 <strong>year</strong>s. Even while majority of the CO members<br />
in the village remained happy pursuing traditional means of<br />
income generation like livestock rearing and animal husbandry,<br />
some of the members of Siddhanath CO chose to implement<br />
manufacturing enterprise.<br />
Given that demand of soap always remained high the village<br />
and nearby markets and there were no producers to make the<br />
supply, some of the members of 23-member Siddhanath CO<br />
of Gokuleshwor VDC - 9 assessed there was a huge market of<br />
washing soaps and they could tap that potential by establishing<br />
a soap manufacturing enterprise.<br />
Following the release of the first installment from PAF, the CO<br />
organized 12-day training on how to produce washing soaps.<br />
The trainings were attended 19 community members, including<br />
6 members of Siddhanath CO, 6 members of Janashakti CO<br />
and 7 members of Devati CO. After the training, however, the<br />
members realized they need huge monetary input to actually<br />
materialze their plan and if they failed to compete, they will<br />
suffer a huge loss. This realization forced many to drop the idea.<br />
However, Kalpana Nath and Ram Nath, chairman and treasurer of<br />
Siddhanath CO respectively had different idea. They committed<br />
themselves to set up the factory and even registered ‘Chaulani<br />
Soap Industry’ at the Office of the Cottage and Small Industries<br />
Development Committee (OoCSIDC) in Baitadi.<br />
They even inaugurated the industry in the presence of OoCSIDC<br />
Chief Nrit Bahadur Bogati, Chairman of Rural Development Serice<br />
Center Bishnu Datta Joshi and local political representatives and<br />
prominent local personalities on February 23, 20<strong>11</strong>.<br />
“We had planned to start the industry by taking loans of Rs<br />
15,000 each from the CO. But procurement of fixed assets alone<br />
has crossed over Rs 275,000, said Kalpana Nath. Thankfully,<br />
PAF contributed Rs 120,000 in this process and the members<br />
acquired raw materials investing Rs 125,000.<br />
Still good news was; contrary to initial skepticism, they have<br />
not yet faced any problems over finding the marker. “We were<br />
not even required to send soaps in the market. Retailers come<br />
directly in the factory and take away their orders,” said Ram<br />
Nath, another promoter of the soap factory.<br />
The factory has set wholesale price of soap (each weighing<br />
in a range of 170 grams to 180 grams) at Rs 9 per piece and<br />
traders are happily retailing it at Rs 10. “We required huge initial<br />
investment because we needed to source the raw materials from<br />
Bareli and Pilbhiti of India. Otherwise, we are enjoying pretty<br />
good business and soung return,” said Ram Nath.<br />
Success Story<br />
ANNUAL PROGRESS REPORT (<strong>2010</strong>/20<strong>11</strong>) 7
2. Facilitation of Community Through POs<br />
Partner Organizations (POs) are selected by PAF to facilitate Community<br />
Organizations of the Poor (COPs). The facilitation work of POs includes<br />
organizing COs, enhancing COs capacity development on planning<br />
activities, carry out detailed feasibility studies, survey design &<br />
estimates, and proposal preparation during preparatory phase, and<br />
provide technical assistance and monitoring and supervision of various<br />
sub-projects during implementation phase.<br />
As such, 370 Partner Organizations (POs) are working with communities<br />
(57 for Mountain Districts, 174 in hilly Districts, 128 for Terai districts<br />
and <strong>11</strong> for Innovative Window Programme and 37 for NDM-World Bank<br />
Programme). In addition, 17 POs were terminated due to their under<br />
performance.<br />
Table 4: Details of POs Number<br />
Description<br />
No. of Pos working<br />
Mountain 57<br />
Hills 174<br />
Terai 128<br />
Innovative Programme <strong>11</strong><br />
TOTAL 370<br />
NDM-World Bank 2005 12<br />
NDM-World Bank 2008 25<br />
GRAND Total 407<br />
3. Reaching Out to the Poor<br />
and Social Inclusion<br />
PAF has taken the strategy to with the thought that poor community should be<br />
organized themselves to prepare, implement and manage their programme<br />
and they should be in the driving seat, with decision making authority.<br />
chart 5: CO Members-Beneficary Category<br />
8.60%<br />
0.20%<br />
poor, and thus included as CO members in PAF programme.<br />
3.1. CO Members<br />
During the reporting <strong>year</strong>, PAF was able to reach out 64,758 poor HHs<br />
and organize them as CO member households to carry out different<br />
activities aimed at improving their livelihood. A total of 470,021 CO<br />
members households were benefited from PAF assistance till the end<br />
chart 6: Regionwise CO member HH<br />
32%<br />
of the reporting <strong>year</strong>,<br />
3%<br />
<strong>11</strong>%<br />
When comparing the region-wise break down of the CO members, Hilly<br />
region holds the highest share with 54 per cent, followed by Terai and<br />
Mountain region with 32 and <strong>11</strong> per cent respectively, while innovative<br />
districts have a meager share of 3 per cent.<br />
Table 4: CO member-Beneficiaries<br />
54%<br />
Programme Areas FY 2067/68 Cumulative<br />
Mountain 9,616 53,857<br />
Hills 29,160 253,674<br />
Terai 25,479 149,<strong>11</strong>4<br />
Innovative District 503 13,376<br />
Total 64,758 470,021<br />
3.2. CO Members by <strong>Poverty</strong> Ranking<br />
Hill<br />
Mountain<br />
Terai<br />
Innovative districts<br />
25.40%<br />
65.80%<br />
Hardcore Poor<br />
Medium Poor<br />
Poor<br />
Non Poor<br />
Among beneficiaries members in Community Organizations of Poor<br />
(COPs), 65.8 per cent members falls under the hardcore poor category<br />
(food sufficiency less than 3 months among criteria fixed by community),<br />
25.4 per cent members falls under medium poor category (food<br />
sufficiency more than 3 months but less than 6 months among other<br />
criteria set by the community itself), 8.6 per cent members falls under<br />
poor category (food sufficiency more than 6 months but less than a<br />
<strong>year</strong> among other criteria set by the community itself) and a very small<br />
fraction of per centage members falls under marginal Non-poor Category.<br />
Participatory social assessment and community well- being ranking<br />
process identified the poor community members as primary beneficiaries<br />
at the settlement level. They are organized into community organization<br />
to plan, implement and manage their sub-projects. As entry point of PAF<br />
programme at settlement level, social mapping and participatory social<br />
assessment are the primary social mobilization steps. The settelmenet<br />
level social assessment has revealed that the 62 per cent of the HHs are<br />
3.3. CO Members by Caste and Ethnicity<br />
Out of the total 470,021 CO members households till the end of the<br />
reporting <strong>year</strong>, CO member households constitutes 29 per cent Dalit, 28<br />
per cent Janjati, 3 per cent Muslim, 30 per cent Brahmin/Chhetri and 10<br />
per cent other caste and ethnicity.<br />
8 ANNUAL PROGRESS REPORT (<strong>2010</strong>/20<strong>11</strong>)
Caste and ethnicity wise distribution of CO members in terms of region shows that Dalit dominates in the Terai region and Chhettri in hilly and Janajati<br />
in mountain regions. (see diagram).<br />
chart 7: CO Members-Ethinicity Wise<br />
chart 8: Ethnicity Wise CO Members<br />
Number<br />
3%<br />
10%<br />
29%<br />
Dalit<br />
Janajati<br />
120000<br />
100000<br />
c<br />
D j<br />
b<br />
24%<br />
Bramhin<br />
80000<br />
6%<br />
28%<br />
Chhetri<br />
Muslim<br />
Others<br />
60000<br />
40000<br />
20000<br />
0<br />
D<br />
j<br />
j<br />
m o c<br />
m<br />
D<br />
b m o<br />
b c<br />
Hill Mountain Terai<br />
o<br />
Region<br />
3.4. CO Members by Gender<br />
Female CO members have the lion’s share in terms of community participation and membership with 74 per cent. They are highest in hillly region and<br />
followed by Terai region and mountain region (See Chart 9, 10).<br />
chart 9: CO Members Gender-wise<br />
chart 10: CO Members-Ethinicity Wise<br />
Number<br />
250000<br />
Female<br />
26%<br />
Male<br />
Female<br />
200000<br />
150000<br />
100000<br />
Male<br />
Female<br />
74%<br />
5000<br />
0<br />
Female<br />
Male<br />
Male<br />
Hill Mountain Terai<br />
Region<br />
ANNUAL PROGRESS REPORT (<strong>2010</strong>/20<strong>11</strong>) 9
3.5. CO Members by Key Position Holders<br />
The president, treasurer and secretary are considered as key positions in every individual COs. There are a total of 45,632 key position holders within<br />
the community organizations registered to PAF. The gender-wise and ethnicity wise breakdown of key position holders are presented in following tables<br />
and charts.<br />
Table 5 : CO members by Key position holders<br />
Gender<br />
Ethnicity<br />
Region<br />
Male Female Dalit Janajati Brahmin Chhetri Muslim Others<br />
Mountain 1,584 3,876 1,183 1,836 316 1,998 0 2,441<br />
Hills <strong>11</strong>,422 13,628 8,036 6,458 1,667 8,288 8 10,548<br />
Terai 3,290 10,746 6,225 3,816 <strong>11</strong>0 128 972 3,023<br />
Innovative District 426 660 <strong>11</strong>8 915 20 30 3 50<br />
Total 16,722 28,910 15,562 13,025 2,<strong>11</strong>3 10,444 983 16,062<br />
Of the total 45,632 key position holders in PAF supported COs, 62 per<br />
cent are female, in accordance with PAF’s affirmative approach for the<br />
empowerment of the poor women.<br />
Caste and ethnic representations in key positions shows that 34 per<br />
cent are Dalits, followed by 27 per cent of Janajatis and 29 per cent of<br />
Brahamin/Chhetris and 8 per cent other ethnicity. At the regional level,<br />
Dalits dominates in key position holders in Terai and Chhetris dominates<br />
in hilly districts. Janajati dominates in mountain region and innovative<br />
districts.<br />
chart 10: Key Position Holders-Gender Wise<br />
4. Community Institutional Building<br />
Community institutionalization process is also emerging in some of the<br />
districts where community felt need to federate themselves for certain<br />
purpose. 53 Multi-purpose co-operatives and 547 federation of COs are<br />
formed as per communities’ felt need. Informal networks of COs are<br />
being formed in each VDC, in the process of institutionalization. PAF<br />
has recently formulated CO graduation and PO exit strategy setting out<br />
its priorities<br />
from making an exit after making the COs capable of handling their own<br />
development needs. The annual performance of the individual PO is tied<br />
to the number of COs that would be graduated to a self-propelling and<br />
self-sustaining institutions. Details of community institutional building is<br />
given in Annex 8 and Annex 9.<br />
38%<br />
62%<br />
chart <strong>11</strong>: Key Position Holders-Gender Wise<br />
34%<br />
29%<br />
8%<br />
2%<br />
27%<br />
Male<br />
Female<br />
Dalit<br />
Janajati<br />
Muslim<br />
Others<br />
Bramhin/Chhetri<br />
2.2.2. Income Generating Activities and Micro<br />
Enterprise<br />
PAF has been successful to reaching out to over 540 thousands poor<br />
households through the supporting of different income generation<br />
activities and community infrastructures. Out of total investment of<br />
Rs 8266 millions, 72 per cent is made in income generation activities<br />
followed by 21 per cent in community infrastructure development, 4 per<br />
cent to build up community capacity and rest 3 per cent in communty<br />
organization management and monitoring activities. A wide range of<br />
income generation activities have been demanded and supported,based<br />
upon the potentials and opportunities available at community level. The<br />
potentials include the availability of raw materials, resources, access to<br />
market, skill and traditional occupation etc.<br />
Partner organizations provide information to community members<br />
and facilitate them to identify potential income generation activities. It<br />
is apparent that <strong>Nepal</strong> being an agricultural country, more than 80 per<br />
cent of its population relies on agriculture. Income generation activities<br />
supported by PAF are mostly related to agriculture and livestock sector.<br />
IG Activities—Sector, HHs and Investment<br />
By the end of FY 2067/68, PAF has made agreement with 16,819 COs<br />
to implement 19615 sub-projects. Out of them, 16,576 sub-projects<br />
are related to income generation activities. The ratios of number of IG<br />
subproject to the total number of sub-projects, increased from 55 per<br />
cent in FY 2061/62 to 83.64 per cent in FY 2064/6 and it stands on 89<br />
per cent on FY 2067/68.<br />
10 ANNUAL PROGRESS REPORT (<strong>2010</strong>/20<strong>11</strong>)
chart 12: IG activities investment by sector and region<br />
Percentage<br />
90%<br />
80%<br />
70%<br />
60%<br />
50%<br />
40%<br />
30%<br />
20%<br />
10%<br />
0%<br />
FY<br />
2061/62<br />
FY<br />
2062/63<br />
PAF Investment in COs<br />
FY<br />
2063/64<br />
FY<br />
2064/65<br />
FY<br />
2065/66<br />
FY<br />
2066/67<br />
FY<br />
2067/68<br />
Income Generation 60.80% 65.20% 82.50% 74.20% 72.00% 64.70% 76.50%<br />
Community Infrastructure 32.50% 26.50% 7.60% 18.00% 20.40% 28.80% 21.50%<br />
Community Capacity Building 4.90% 5.90% 6.00% 5.00% 4.40% 3.70% 1.40%<br />
CO Management, M&E 1.80% 2.50% 2.90% 2.80% 3.10% 2.80% 0.70%<br />
In terms of investment, the ratios of IG sector<br />
continuously increased to 84 per cent of total investment<br />
in FY 2063/64 from 61 per cent in FY 2061/62, and then<br />
started to decrease to 64.7 per cent in FY 2066/67. The<br />
graph shows that investment on IG sector has constantly<br />
increased till FY 2063/64 and then started to decrease.<br />
Being income generation activities as first choice of poor,<br />
IG investment again increased in FY <strong>2010</strong>/<strong>11</strong>due to the<br />
expansion of PAF coverage in new fifteen districts.<br />
Income generation activities can be grouped into different<br />
sector like, agriculture, livestock, service, trading,<br />
manufacturing and others. PAF investment by sectors<br />
as well as households involved in each sector has been<br />
presented in table and charts below. The following data<br />
on PAF investment in income generating sub-projects<br />
does not include the investment related to COs’ capacity<br />
building and institutional management cost.<br />
Table 6 : Sector wise income generation activities by households and PAF investment<br />
S.N.<br />
Sectors<br />
FY 2067/68<br />
Cumulative achievements<br />
HHs Amt (in M) % of HHs % of Invest. HHs Amt (in M) % of HHs % of Invest<br />
1 Agriculture 6,266 80.05 10.70% 7.0% 49,069 415.56 <strong>11</strong>% 6.34%<br />
2 Livestock 43,039 814.99 73.49% 71.0% 304,314 4,660.30 68% 71.15%<br />
3 Service 197 56.28 0.34% 4.9% 18,207 254.61 4% 3.89%<br />
4 Trading 7,990 178.65 13.64% 15.6% 65,780 1,<strong>11</strong>0.42 15% 16.95%<br />
5 Manufacturing 1,076 17.95 1.84% 1.6% 12,474 108.91 3% 1.66%<br />
Total 58,568 1,147.91 100.00% 100.0% 449,844 6,549.80 100% 100.00%<br />
The people living in rural areas have a limited access to basic infrastructures like road, electricity, market as well as information, resulting more demand<br />
of livestock activities as income generation sub-projects.<br />
Livestock sector is the largest portfolio of IG activities by investment as well as HHs involved. About 71 per cent of PAF support is disbursed to this<br />
sector and 68 per cent of IG beneficiaries’ households are engaged, followed by trade related activities with 17 per cent, agriculture related with 6 per<br />
cent, service sector with 4 per cent, manufacturing and others activities with about 2 per cent.<br />
Out of total households 304,314 involved in livestock husbandry, about 33 per cent is engaged in milk production through buffalo and cow raising,<br />
60 per cent in meat production, 5 per cent in ox/he buffalo raising for farming /breeding and the rest 2 per cent for transportation purpose.Of the<br />
total investment of Rs 466 millions in livestock sector, about 49 per cent is in meat production followed by 41 per cent in milk production, 5 per cent<br />
in breeding/farming, 3 per cent in transportation and rest 1 per cent in livestock support activities. The trends of investment in different category in<br />
livestock sector is presented in chart.<br />
chart 13: Investment in IGA by Sector<br />
chart 14: Investment in IGA by Sector<br />
5% 3%<br />
2%<br />
4%<br />
17%<br />
71%<br />
2% 6% Livestock<br />
Service<br />
Trading<br />
Manufacturing<br />
Agriculture<br />
49%<br />
41%<br />
Breeding/Farming<br />
Transportation<br />
Livestock Management Activities<br />
Milk Production<br />
Meat Production<br />
ANNUAL PROGRESS REPORT (<strong>2010</strong>/20<strong>11</strong>) <strong>11</strong>
chart 15: Trend of Investment in Livestock Activities<br />
60%<br />
50%<br />
40%<br />
30%<br />
20%<br />
10%<br />
0%<br />
061/62 062/63 063/64 064/65 065/66 067/68 066/67<br />
Milk Production<br />
Breeding/Farming<br />
Livestock Management Activities<br />
Meat Production<br />
Transportation<br />
chart 16: Investment in Livestock Activities by Region<br />
70%<br />
60%<br />
50%<br />
40%<br />
30%<br />
20%<br />
10%<br />
0%<br />
65%<br />
28%<br />
15%<br />
1% 3% 2%<br />
1%<br />
0% 2% 0%<br />
Hill Mountain Terai<br />
Livestock Management Activities<br />
Livestock for Meat Production<br />
Livestock for Milk Production<br />
57%<br />
28%<br />
18%<br />
13%<br />
Livestock for Transportation<br />
Livestock for Breedign/Farming<br />
66%<br />
The variation of communities demand across the geographical region,<br />
accessible and non accessible areas reveals that the communities are<br />
smart enough in selection of activities based on accessibility, existing<br />
natural resources, and potential markets opportunities.<br />
In Terai region, market of fresh milk is relatively higher and accessible<br />
and the products can be easily marketed with little time and efforts for<br />
collection and transportation. Nearly, 56 per cent of total households<br />
(with 66 per cent of total investment in livestock sector in region)<br />
pursuing livestock as part of their income generation activity in Terai<br />
region, are rearing buffaloes and cows for milk products, followed by 31<br />
per cent (18 per cent of total amount) for meat production and remaining<br />
13 per cent (13 per cent of total amount) for farming /breeding purpose.<br />
Similarly in Hilly region, 74 per cent HHs (with 65 per cent of total<br />
amount) have been found to be engaged in meat production by rearing<br />
goat, pig, poultry, among others. In the same region, 22 per cent HHs<br />
(with 28 per cent of total amount) of livestock raising is done for milk<br />
production purpose followed by 4 per cent HHs (with 13 per cent of<br />
total amount) for farming/breeding and transportation purposes. In the<br />
case of Mountain region, 61 per cent of households (with 57 per cent of<br />
amount) are involved in meat production, followed by 28 per cent HHs<br />
Table 7: PAF investment in Agriculture sector by category<br />
(with 15 per cent of total amount) in milk production and remaining <strong>11</strong><br />
per cent for transportation purpose.<br />
In addition to animal husbandry, PAF has provided support in its<br />
associated areas such as animal treatment fund, establishment<br />
of veterinary services, developing village level health workers to<br />
supplement livestock component. In view of the largest investment<br />
portfolio in livestock sector, due emphasis has been laid to establish<br />
linkages with markets and services.<br />
Apart from livestock, diverse activities in the agricultural sector have<br />
been demanded by the communities. The activities thus demanded<br />
are system of rice intensification (SRI), vegetable farming in open field<br />
to tunnel house, seed multiplication, cash crop production, and fruit<br />
farming. Households involved in different agriculture and forest related<br />
activities have been presented in the Chart 17 (refer to next page).<br />
Out of total 49,069 HHs, 54 per cent households are engaged in<br />
vegetable farming, followed by 17 per cent in fruit farming, 17 per cent<br />
in agro-forestry, about 5 per cent in bee keeping and rest in cash crop,<br />
fishery etc. PAF investment in different activities and number of involved<br />
households are presented in table below:<br />
FY 2067/68 Cumulative till 2067/68<br />
Sub-sector<br />
HH<br />
Per<br />
cent<br />
Amount<br />
(in M)<br />
Per<br />
cent<br />
HH<br />
Per<br />
cent<br />
Amount<br />
(in M)<br />
Per<br />
cent<br />
Agro forestry 604 9.7 2.15 2.1 8138 16.6 28.65 6.9<br />
Fruit farming 194 3.1 2.61 2.6 8557 17.4 36.71 8.8<br />
Cereal crops 14 0.2 0.23 0.2 430 0.9 1.63 0.4<br />
Cash crops 732 <strong>11</strong>.7 8.89 8.8 2444 5.0 22.29 5.4<br />
Vegetable farming 4579 73.4 82.96 81.9 26713 54.4 289.36 69.6<br />
Bee keeping 87 1.4 1.88 1.9 2317 4.7 25.78 6.2<br />
Fishery 29 0.5 0.95 0.9 470 1.0 7.25 1.7<br />
Agriculture Support Activities 0 0.0 1.60 1.6 0.0 3.90 0.9<br />
Total 6239 100.0 101.26 100.0 49069 100.0 415.56 100.0<br />
Vegetable farming has been proved very lucrative to increase the income of poor within a short interval of time, where market is easily available for<br />
fresh vegetables. Under innovative window programme, PAF has also supported vegetable farming in lease land to landless and marginalized people in<br />
Chitwan district. This programme has helped increase income of the poor, thereby, creating them full time employment.<br />
12 ANNUAL PROGRESS REPORT (<strong>2010</strong>/20<strong>11</strong>)
chart 17: PAF investment in Agriculture sector by category<br />
1%<br />
5%<br />
Vegetable<br />
17%<br />
17%<br />
1% 5%<br />
54%<br />
Bee Keeping<br />
Fishery<br />
Agro Forestry<br />
Fruit Farming<br />
Cereal Crop<br />
Cash Crops<br />
In moutain district like Mugu, green vegetable was outright impossible<br />
during winter season before PAF intervention. But after PAF arrival, it has<br />
been usual to grow commercial vegetables even in winter season with the<br />
introduction of pit green house and solar tunnel house. Such vegetable<br />
farming technology/methodology has been successfully demonstrated<br />
and this proven and tested case has induced high potential of scaling up<br />
in other areas in the days ahead.<br />
Irrespective of better yield but comparatively longer gestation period, the<br />
demand of fruit farming is stumpy. Nonetheless, a promotional activity<br />
of fruit farming undertaken by the communities has widened the scope<br />
for scaling up this intervention in coming days.<br />
chart 18: Investment in Trading by Business Types<br />
5%<br />
76%<br />
2% 3%<br />
7%<br />
7%<br />
chart 19: Investment in Service sector by Category<br />
28%<br />
2%<br />
5%<br />
4%<br />
8% 2%<br />
14%<br />
29%<br />
3%<br />
5%<br />
Others<br />
Electrical Goods<br />
Garment<br />
Livestock Related<br />
Agri Business<br />
Retail Shop<br />
Swing and Cutting<br />
Livestock Support<br />
Agro Processing<br />
Hotel/Resturant<br />
Barber<br />
Repair and Maintenance<br />
Metal Works<br />
Transportation<br />
Communication<br />
Others<br />
Further to the above, trading is the second largest portfolio on IG.<br />
Altogether, 65780 HHs are engaged in trading business, whilst PAF<br />
has invested NRs <strong>11</strong>10 Millions in this sector. Of the total investment,<br />
76 per cent has been invested in retail shop, followed by 7 per cent in<br />
agriculture related buisines, 7 per cent in livestock and livestock product<br />
related business, 3 per cent in garment business and rest in other<br />
different types of activities.<br />
Analysis in trading sector shows that retail business has largest<br />
investment in all ecological belts, which accounts more than 65 per cent<br />
in Terai, 85 per cent in Mountain districts and more than 87 per cent<br />
in Hill districts. Animal business, wood product business, agriculture<br />
inputs, food items related business are other major activities in this<br />
sector.<br />
Overall, 18,207 HHs are engaged in service sector, where PAF has<br />
invested about 254 millions. Out of total investment, 245 millions has<br />
been invested in income generating social services and rest in social<br />
services like supports for schools and healthposts, scholarship etc.<br />
Tailoring buisiness is one of the largest components of social sector<br />
having 29 per cent investment, followed by transportation 28 per cent,<br />
small hotels/teashops 14 per cent, repair and maintenance 8 per cent,<br />
and rest in other activities like livestock supports, agrovet services etc.<br />
A total of 12,474 HHs are involved in manufacturing related business,<br />
and PAF investment is about 109 millions in this sector. Out of total<br />
investment, about 53 per cent has been in non-agro products related<br />
manufacturing activities, followed by 41 per cent in forest products<br />
related, agro-processing related 4.3 per cent and rest in fruit processing.<br />
Listing of income generation activities shows that there are diversified<br />
IG activities undertaken by the community members. Of them, livestock<br />
sector alone has been verified major activity as compared to other IG<br />
activities. It means, there is still great challenge to provide informed<br />
choices to the people, so that they are able to select suitable IG activities<br />
based on their need, local resources, knowledge, skills and available<br />
market potentials. A lion’s share of investment in livestock sector<br />
demands more concentration to develop mechanism to provide adequate<br />
veterinary services at rural areas. It is unambiguous that to sustain the<br />
diverse interventions as specified above, PAF should accord higher<br />
priority to enhance the qualitative capacity of both partner organizations<br />
and community organizations.<br />
As COs/HHs activities on Income Generation are being continued<br />
through utilization of Revolving <strong>Fund</strong> managed by the CO, there might be<br />
shift in activities based on knowledge and market potentials. This aspect<br />
need to be atudied in future.<br />
ANNUAL PROGRESS REPORT (<strong>2010</strong>/20<strong>11</strong>) 13
Success Story<br />
watch, radio shop<br />
earn livelihood<br />
If you have skill and dedication, even a watch and radio<br />
shop will easily help you earn the livelihood. This is what Noj<br />
Bahadur Ghartimagar of Rajbara-9, Pyuthan has proven.<br />
Four <strong>year</strong>s ago, Ghartimagar had left for Malaysia spending<br />
Rs 100,000. He had hoped he will get good overseas job and<br />
earn handsome income. But that proved as mere a mirage. By<br />
the time he returned to village, he had barely managed to save<br />
anything. This broke his dreams of earning decent life through<br />
foreign employment. But as there existed no job opportunities<br />
in the village, he decided to move to India in search of new<br />
job. However, before leaving for India, he chose to give one<br />
last try in the village itself and opened a watch and radio shop.<br />
That was the case of 2009.<br />
“Thanks to PAF, I managed to get hold of Rs 18,000 in loans to<br />
start the shop. After that, I have never looked back or thought<br />
of leaving the country for job,” said Noj Bahadur, he became<br />
a member of Dikhachuli CO when PAF started the programme<br />
in his VDC.<br />
Ghartimagar learned the repair skills only after starting the<br />
business. Day-to-day familiarization with the equipment<br />
helped his sharpen his skill. In case of complex problems,<br />
he takes help of repair specialists working in Thulabesi and<br />
Bijuwar. “The business is doing good. It is fetching me Rs<br />
12,000 to Rs 15,000 every month,” he beams with smile.<br />
The demand for radio has increased in Rajbara and nearby<br />
villages after new FM radio stations came into operations.<br />
His shop - NB Watch and Radio Repair Center - always<br />
remains crowded with people visitng the VDC office and<br />
local school. Thanks to the business, he has enrolled his 2<br />
children, including a daughter, in a school. “I have no problem<br />
in fulfilling all basic family needs now,” he stated.<br />
Ghartimagar has already cleared the loans he took to start the<br />
business. He is planning to take fresh loans, eying to expand<br />
the size of the business. “I want to add new watches, radio<br />
and mobile phone sets in my shop,” he said.<br />
Noj Bahadur has proven that even the people who failed to<br />
earn much in overseas job can make decent earning and lead<br />
a decent life in the village itself. His service has also enabled<br />
the locally to get the repair works (of watch and radio) done in<br />
the village itself. Previously, they were required to walk at least<br />
three hours to fix their watches and radios. “This has eased us<br />
greatly,” said Dilip Buda, a local.<br />
That is not all. Noj Bahadur is regarded as skilled manpower<br />
and a person who started completely a new business in the<br />
village. “His business stands quite apart from what other<br />
CO members are doing. And still good thing is, he is among<br />
those members are earning the most in the village,” said Sane<br />
Ranamaga, chairman of Dikhachuli CO. As a result, locals treat<br />
Noj Bahadur with high respect. He invariably takes active part<br />
in the CO meeting and lead the fellow members with examples<br />
on how poor themselves can end their poverty by dedicating<br />
themselves to various income generation activities.<br />
(Courtesy: Publications of POs in Pyuthan district)<br />
2.2.3. Community Infrastructure<br />
Completed Infra Subprojects/Schemes<br />
Till the end of the reporting <strong>year</strong>, a total of 7,398 infrastructures schemes were completed while 701 schemes were completed during the fiscal <strong>year</strong><br />
<strong>2010</strong>/<strong>11</strong> alone (the reporting <strong>year</strong>).<br />
In terms of distribution of schemes by sector during the reproting <strong>year</strong>, drinking water supply & sanitation sub-projects--numbering 334, stands at the<br />
top followed by 142 building construction related sub-projects and 79 small irrigation sub-projects. Similarly, a total of 45 sub-projects were related to<br />
rural energy while 43 sub-projects were related to rural access i.e. transportation.<br />
Till the end of fiscal <strong>year</strong> <strong>2010</strong>/<strong>11</strong>, it is clear that water supply & sanitation related activities stands at the top with 3,776 number followed by with 2,149<br />
irrigation activities, 333 community building sub-projects and 237 rural access sub-projects. Also, a total of 194 rural energy related sub-projects were<br />
constructed in cumulative and against 709 miscellaneous activities that includes drainage, improved cook stove, ICT support, river training, rice mills,<br />
among others.<br />
14 ANNUAL PROGRESS REPORT (<strong>2010</strong>/20<strong>11</strong>)
Chart 20: Distribution of Infrastructure by type<br />
chart 20.A: Distribution of Infrastructure by type<br />
334.48%<br />
58.80%<br />
Benefited Households<br />
43.60%<br />
142.20%<br />
79.<strong>11</strong>%<br />
45.70%<br />
chart 20.B: Distribution of Infrastructure by type<br />
333.40%<br />
237.30%<br />
194.30%<br />
709.10%<br />
3776.51%<br />
2194.29%<br />
Rural Access<br />
Community Building<br />
Rural Energy<br />
Small Irrigation<br />
Water Supply & Sanitation<br />
Miscellaneous<br />
Rural Access<br />
Community Building<br />
Rural Energy<br />
Small Irrigation<br />
Water Supply & Sanitation<br />
Miscellaneous<br />
For the reporitng <strong>year</strong>, building construction has benefited maximim<br />
number of households while in cumulative scenario, water supply and<br />
sanitation activities have benefited the most. Maximum demand were<br />
made for communty building during the reporting <strong>year</strong> while in overall<br />
scenario, demand of water supply schemes is maximum in rural area.<br />
in infrastructure) has been invested for those buildings while Rs.<br />
<strong>11</strong>3.46 milloin (25 per cent of PAF investment in infrastructure) has<br />
been invested for 334 schemes related to water supply & sanitation.<br />
Despite the number of water supply schemes is higher than communty<br />
buildings, the amount of investment of water supply sub-project is less<br />
than that of buildings.<br />
Similarly, in cumulative scenario , a total of 354 million rupees (30 per<br />
cent of PAF investment) were invested for water supply and sanitation<br />
which is higher than other investment made in other categories of<br />
infrastructures. This is mainly due to the higer number of water suppy<br />
related scheme in cumulative terms.<br />
TABLE 8: PAF investment in different Infrastructure Schemes (Completed<br />
subprojects)<br />
SN<br />
Category of<br />
Infrastructures<br />
PAF Investment (in Million)<br />
FY 2067/68<br />
Cumulative<br />
1 Rural Access 45.23 155.42<br />
2 Community Building 152.81 267.53<br />
3 Rural Energy 93.82 207.49<br />
4 Small Irrigation 43.55 142.07<br />
5 Water Supply &<br />
Sanitation<br />
<strong>11</strong>3.67 354.56<br />
6 Miscellaneous 12.35 41.06<br />
Total 461.46 <strong>11</strong>68.16<br />
Community’s Contribution in<br />
Infrastructure Related Investment<br />
To construct infrastructure, community are also contributing in the total<br />
investment. They are contributing in cash as well as in kind. Collection<br />
of local materials and labor is the main job of community while executing<br />
community infrastructure sub-projects. So, there is a variation in Community<br />
contribution between different types of infrastructures. Water supply and<br />
sanitation schemes have highest contribution from communities which<br />
were completed during the reporting <strong>year</strong>. They have contributed Rs 46.23<br />
M for water supply and sanitation schemes, which is 28.63 per cent of<br />
total cost. It is followed by small irrigation sub-projects having 26.68 per<br />
chart 21: Infrastructure activities and benefited households<br />
35,000<br />
30,000<br />
25,000<br />
20,000<br />
15,000<br />
10,000<br />
5,000<br />
0<br />
Rural Access Community Building Rural Energy Small Irrigation Water Supply & Sanitation Miscellaneous<br />
FY 2067/68<br />
Cumulative<br />
PAF Investment in Community Infrastructure<br />
A total of 142 number of community buildings were completed during<br />
the reporting <strong>year</strong> and Rs 152 million (33 per cent of PAF Investment<br />
cent contributions while rural energy has attracted the least contribution<br />
of 15.99 per cent due mainly to non-local materials required for energy<br />
sub-projects. In average, there is 22.18 per cent community contribution<br />
infrastructure completed during the reporting <strong>year</strong>.<br />
ANNUAL PROGRESS REPORT (<strong>2010</strong>/20<strong>11</strong>) 15
Similarly in cumulative scenario, water supply & sanitation related infrastructures have maximum contribution (27.07 per cent) from the communities.<br />
It is followed by rural access with 25.54 per cent. In total, 24.36 per cent contribution has been made by the community for community infrastructure.<br />
chart 22: Ratio of Community Contribution in different Community Infra schemes<br />
35.00%<br />
30.00%<br />
25.00%<br />
20.00%<br />
15.00%<br />
10.00%<br />
5.00%<br />
0.00%<br />
Rural Access Community Rural Energy Small Irrigation Water Supply Miscellaneous Total<br />
Building<br />
& Sanitation<br />
FY 2067/68<br />
Cumulative<br />
Contribution from Local Bodies<br />
DDC and VDC are also contributing in PAF supported infrastructure sub-projects. These institutions have contributed a total of Rs. 52.45 M in cumulative<br />
and Rs 33.31 million during the reporting <strong>year</strong> alone. Its contribution in rural energy is at the top position and followed by rural access. This shows that<br />
local bodies are more interested in rural energy and rural access. In cumulative, they have contributed 37.48 M and 27.42 M for sub-projects during<br />
the reporting <strong>year</strong>. This shows that co-ordination between PAF and Local bodies is increasing in the recent days. DDCs and VDCs have contributed Rs<br />
2.<strong>11</strong> M for rural access schemes completed during the reporting <strong>year</strong> while Rs 6.01 M has been invested for the rural access in cumulative. Further<br />
analysis shows that communities are enforcing local bodies to contribute in sub-projects that need higher investment.<br />
Table 9: Contribution from Local bodies in different PAF schemes (Completed Sub-projects)<br />
Investment of Local Bodies<br />
SN<br />
Category of Infrastructures<br />
FY 2067/68<br />
Cumulative<br />
Amount (million) % Amount (million) %<br />
1 Rural Access 2.<strong>11</strong> 3.38 6.01 2.73<br />
2 Community Building 2.19 1.06 3.82 1.04<br />
3 Rural Energy 27.42 <strong>11</strong>.12 37.48 7.87<br />
4 Small Irrigation 0.075 0.12 1.91 0.94<br />
5 Water Supply & Sanitation 1.5 0.93 3.22 0.63<br />
6 Miscellaneous 0 0 0 0<br />
Total 33.12 4.43 52.45 2.87<br />
Out of total DDC/VDC investment, in PAF projects—either during the reporting <strong>year</strong> or in cumulative, the highest investment has been made in rural<br />
energy. Rural energy is seconded by community buildings in case of reporting <strong>year</strong> and rural access in case of cumulative.<br />
chart 23: Local Bodies Investment (2067/68)<br />
5%<br />
0%<br />
0%<br />
6%<br />
7%<br />
Rural Access<br />
Community Building<br />
Rural Energy<br />
Small Irrigation<br />
Water Supply & Sanitation<br />
Miscellaneous<br />
82%<br />
chart 24: Local Bodies Investment (Cumulative)<br />
0%<br />
4% 6% <strong>11</strong>%<br />
Rural Access<br />
7%<br />
Community Building<br />
Rural Energy<br />
Small Irrigation<br />
Water Supply & Sanitation<br />
Miscellaneous<br />
72%<br />
16 ANNUAL PROGRESS REPORT (<strong>2010</strong>/20<strong>11</strong>)
Investment from Other Sources<br />
Besides DDC and VDC, other donor and line agencies including Alternative Energy Promotion Centre, Rural Energy Development Programme and<br />
District Education Office have also invested in PAF supported infrastructures schemes. They have invested Rs 159.92 million in cumulative and Rs<br />
90.47 million for infrastructures completed during the reporting <strong>year</strong>. Out of the total investment, 80 per cent has been made in rural energy sector in<br />
cumulative, whereas 95 per cent has been made during the reporting <strong>year</strong>.<br />
Table 10: Investment from different sources in completed schemes<br />
Investment from other sources<br />
SN<br />
Category of Infrastructures<br />
FY 2067/68<br />
Cumulative<br />
Amount (million) % Amount (million) %<br />
1 Rural Access 1.36 2.18 2.61 1.19<br />
2 Community Building 2.76 1.34 6.93 1.9<br />
3 Rural Energy 86.01 34.87 128.22 26.91<br />
4 Small Irrigation 0.265 0.45 8.69 4.29<br />
5 Water Supply & Sanitation 0.07 0.05 13.41 2.64<br />
6 Miscellaneous 0 0 0.06 0.13<br />
Total 90.47 12.03 159.92 8.77<br />
Out of total DDC/VDC investment, in PAF projects—either during the reporting <strong>year</strong> or in cumulative, the highest investment has been made in rural<br />
energy. Rural energy is seconded by community buildings in case of reporting <strong>year</strong> and water supply and sanitation in case of cumulative.<br />
Ratio of investment by different agencies<br />
chart 25: Other’s Investment FY 2067/68<br />
chart 26: Other’s Investment (Cumulative)<br />
0% 0%<br />
0%<br />
2%<br />
3%<br />
0%<br />
2%<br />
4%<br />
Rural Access<br />
Community Building<br />
Rural Energy<br />
Small Irrigation<br />
Water Supply & Sanitation<br />
Miscellaneous<br />
6%<br />
8%<br />
Rural Access<br />
Community Building<br />
Rural Energy<br />
Small Irrigation<br />
Water Supply & Sanitation<br />
Miscellaneous<br />
95%<br />
80%<br />
In cumulative, the table below shows that Local bodies as well as other development agencies are more interested for coordination in rural energy.<br />
They are contributing 8 per cent and 21 per cent of total cost of infrastructure respectively. Contribution from PAF side is highest with 81 per cent for<br />
miscellaneous category of sub-projects- that includes Drainage, improveed cook stove, ICT support , river training and rice mills, among others, and<br />
lowest for rural energy, where PAF’s contribution is only 44 per cent of the total cost. Per centage of Community contribution is highest (27 per cent)<br />
for water supply & sanitation and least (18 per cent) for miscellaneous type sub-projects. In an average, PAF has contributed 64 per cent of total cost ,<br />
whereas CO’s contribution is 24 per cent, DDC and VDC’s contribution is 3 per cent and other’s contribution is 9 per cent.<br />
ANNUAL PROGRESS REPORT (<strong>2010</strong>/20<strong>11</strong>) 17
Table <strong>11</strong>: Ratio of investment by different agencies for PAF community infrastructure (Cumulative)<br />
Types of Infrastructure PAF CO Cash CO Kind CO Total DDC VDC Others Total<br />
Rural Access 71% 1% 25% 26% 3% 1% 100%<br />
Community Building 73% 0% 24% 24% 1% 2% 100%<br />
Rural Energy 44% 2% 19% 21% 8% 27% 100%<br />
Small Irrigation 70% 1% 24% 25% 1% 4% 100%<br />
Water Supply & Sanitation 70% 0% 27% 27% 1% 3% 100%<br />
Miscellaneous 81% 7% <strong>11</strong>% 18% 0% 0% 100%<br />
Total 64% 1% 23% 24% 3% 9% 100%<br />
For infrastructure completed during the reporting <strong>year</strong>, PAF, Community, DDC/VDC and other line agencies have contributed 61,23, 4 and 12 per cent<br />
of total cost of infrastruture respectively. Contribution from PAF is highest (83 per cent) for miscellaneous type of sub-projects and lowest for rural<br />
energy, where PAF’s contribution is only 38 per cent of the total cost. Per centage of Community contribution is highest (28 per cent) for water supply<br />
& sanitation and lowest (16 per cent) for rural energy type sub-projects.<br />
Table 12: Ratio of investment by different agencies for PAF community infrastructure (Reporting <strong>year</strong>)<br />
Types of Infrastructure PAF CO Cash CO Kind CO Total DDC VDC Others Total<br />
Rural Access 72% 1% 21% 22% 3% 2% 100%<br />
Community Building 74% 0% 23% 23% 1% 1% 100%<br />
Rural Energy 38% 1% 15% 16% <strong>11</strong>% 35% 100%<br />
Small Irrigation 73% 0% 26% 26% 0% 0% 100%<br />
Water Supply & Sanitation 70% 0% 28% 28% 1% 0% 100%<br />
Miscellaneous 83% 7% 10% 17% 0% 0% 100%<br />
Total 61% 1% 22% 23% 4% 12% 100%<br />
Per Capita Cost-PAF Contribution and Total Investment<br />
PAF rules allows to have highest per capita investment Rs 5,500 for individual infrastructure related sub-projects. But in actual , per capita cost of<br />
PAF investment is Rs 2184 for those sub projects completed during the reporting <strong>year</strong> while the cumulative per capita cost for PAF is Rs 1428. For<br />
infrastructures completed during the reporting <strong>year</strong>, per capita cost is highest for water supply & sanitation sub-projects with Rs 2686 and lowest for<br />
rural access with Rs 1,687. Similarly, when comaprision is made for all completed infrastructures, rural energy related infrastructures have the highest<br />
per capita invesment of Rs 1,875 . And rural access sub projects has the lowest per capita cost with Rs 812.<br />
Table 13: Per Capita Cost--Total investment and PAF Contribution<br />
Category of Infrastructures<br />
Beneficiaries Population Per capita cost wrt PAF Per Capita cost with respect to Total Cost<br />
FY 67/68 cumulative FY 67/68 cumulative FY 67/68 cumulative<br />
Rural Access 26819 191591 1,687.00 812.00 2331 <strong>11</strong>51<br />
Community Building 83859 171579 1,823.00 1,560.00 2465 2135<br />
Rural Energy 37088 <strong>11</strong>0666 2,530.00 1,875.00 6652 4306<br />
Small Irrigation 17707 106261 2,461.00 1,338.00 3382 1908<br />
Water Supply & Sanitation 42325 2<strong>11</strong>478 2,686.00 1,677.00 3816 2408<br />
Miscellaneous 3464 26850 3,566.00 1,530.00 4284 1883<br />
Average 2<strong>11</strong>262 818425 2,185.00 1,428.00 3561 2231<br />
Per capita cost in total is highest for rural energy related infrastrcutures for both repoting <strong>year</strong> as well as in cumulatative. Its value is Rs 2530 and Rs 1875<br />
for the reporting <strong>year</strong> and cumulative respectively. For Rural access, it is lowest with Rs 2331 and Rs <strong>11</strong>50 for reporting <strong>year</strong> and cumulative respectively.<br />
Per Household Community Contribution<br />
For sustainability of infrastructure, PAF enforces community to take its ownership. And for this, they are also contributing through their labour and<br />
work for the collection of non-local materials. In average , community has contributed Rs 4,732 and Rs 3,413 for recently completed and cumulative<br />
infrastructures respectively. It is highest for water supply and sanitation type infrastructures among recently completed infrastructures and rural energy<br />
sub projects have highest value in cumulative.<br />
18 ANNUAL PROGRESS REPORT (<strong>2010</strong>/20<strong>11</strong>)
Salient Features of PAF Supported Infrastructure & Per unit Cost<br />
Infrastructure for Rural Access<br />
During the reporting <strong>year</strong>, four bridges (769 m length), nine culverts (33 meter in length), 27 rural roads (51 km in length) and three trail roads (4 km in<br />
length) have been completed whereas in cumulative scenario, a total of 20 bridges (<strong>11</strong>90 m length), 80 culverts (280 meter in length), 127 rural roads<br />
(204 km in length) and 10 trail roads (19 km in length) have been completed.<br />
Table 14: Per unit cost for rural access sub projects<br />
Salient Features<br />
Per unit cost<br />
SN Rural access<br />
Unit FY 2067/68 Cumulative FY 2067/68 Cumulative<br />
1 Bridge m 769 <strong>11</strong>90 14739 16145<br />
2 Culvert m 33 280 <strong>11</strong>8691 75196<br />
3 Road & its maintenance km 51 204 871648 859130<br />
4 Trail Road km 4 19 699125 253078<br />
Here per unit cost of bridge in the reporting fiscal <strong>year</strong> is less than that of cumulative as long as bridges were completed with less per unit cost.<br />
chart 27: Per Household Community Contribution<br />
8,000<br />
7,000<br />
6,000<br />
5,000<br />
4,000<br />
3,000<br />
2,000<br />
1,000<br />
0<br />
Rural Access Community Rural Energy Small Irrigation Water Supply Miscellaneous Total<br />
Building<br />
& Sanitation<br />
FY 2067/68<br />
Cumulative<br />
Community Buildings<br />
Till now, PAF has supported for school, health post, community building and agriculture related building (cellar storage, market shed, milk/ vegetable<br />
collection center). In FY <strong>2010</strong>/<strong>11</strong>, 129 school buildings (626 rooms) have been constructed and maintained. One health post (2 rooms), four agriculture<br />
related buildings (13 rooms) and eight other types of community buildings (23 rooms) are constructed, whereas in cumulative, 272 school buildings<br />
(1,101 rooms), 5 health posts (16 rooms), <strong>11</strong> agriculture related buildings (22 rooms) and 45 other types of community buildings (41 rooms) are<br />
constructed 664 number of rooms having 27655 m2 plinth area have been constructed during the reporting <strong>year</strong> and 1220 rooms having 48874 m2<br />
plinth area were constructed in cumulative. Recently completed building’s unit cost is Rs. 3<strong>11</strong>,277/room and Rs 7,474/m2 area and in cumulative, its<br />
value is 300,189/room and 7,493/m2 plinth area.<br />
Table 15: Per unit cost for Community Buildings Construction<br />
SN<br />
Building<br />
Salient Features<br />
Per unit cost<br />
Unit FY 2067/68 Cumulative FY 2067/68 Cumulative<br />
1 Building Room No & Plinth Area 664/ room (27655 m2<br />
plinth area)<br />
1220/ room<br />
(48874 m2 plinth area)<br />
3<strong>11</strong>277/ room and Rs<br />
7474/m2<br />
300189/ room and<br />
7493/m2 plinth area.<br />
ANNUAL PROGRESS REPORT (<strong>2010</strong>/20<strong>11</strong>) 19
Rural Energy<br />
Electricity line extension, Micro hydro power and solar system are sub-projects under the rural energy category. In recent fiscal <strong>year</strong>, a total of<br />
seven electricity line extension sub projects (97 km extension), 37 numbers of micro-hydro sub-projects (770 kw) and one solar system have been<br />
completed. In cumulative, 37 number of electricity line extension (167 km extension), 98 numbers of micro-hydro sub-projects (1626 kw) and 59 solar<br />
system have been completed. The cost per Kw is Rs. 298,791 for infrastructure completed during the reporting <strong>year</strong> and Rs 259,793 in cumulative.<br />
Table 16: Per Unit Cost for Rural Energy Related Sub-projects<br />
SN<br />
Rural Energy<br />
Salient Features<br />
Per unit cost<br />
Unit FY 2067/68 Cumulative FY 2067/68 Cumulative<br />
1 Micro Hydro kw 770 1626 298791 259793<br />
Small Irrigation<br />
PAF is providing different types of schemes such as deep boring, artisan boring, treadle pump, drip, sprinkle, water harvest tank, plastic pond, earthen<br />
pond, well, lift and surface to community based on local topography, available water and command area. In recent <strong>year</strong>, 79 number of irrigation<br />
sub-projects (754 hectares) are completed among which 38 number of surface irrigation, two lift irrigation sub-projects, four earthen ponds were<br />
constructed. In cumulative, 347 numbers of boring, 2 drip, 9 lift irrigation, 12 plastic pond, 13 earthen pond, 123 surface irrigation and 24 sprinkled<br />
irrigation were completed. This has helped to irrigate more than 3,000 hectares of land.<br />
Water Supply & Sanitation<br />
Gravity, Lift, tube well, dug well, Rain water harvesting types of water supply schemes are constructed under PAF support. Simultaneously, waste pit<br />
and toilets are also constructed under PAF. In FY <strong>2010</strong>/<strong>11</strong>, 169 number of gravity water supply (<strong>11</strong>56-taps/ water points), 2 lift water supply, 23 subprojects<br />
of tube well, 4 sub-projects of dug well and 133 number of toilet sub-projects are completed.<br />
In cumulative, 523 number of gravity water supply (<strong>11</strong>56-taps/ water points), eight lift water supply, one rain water harvesting, 1,128 sub-projects of<br />
tube well, 46 dug well sub-projects and 1962 number of toilets (2476 in number)sub-projects were completed.<br />
Infrastructure (Under Construction)<br />
There are 650 infrastructures sub-projects under construction as of July 20<strong>11</strong> and most of them are expected to be completed by next <strong>year</strong>. Among<br />
them, water supply and sanitation sub-projects are at top position whereas infrastructure under miscellaneous category (Ghatta, river training) subprojects<br />
are minimum. And maximum households will be benefited from rural access which is 13,068 (24.1 per cent). It is followed by community<br />
building, from which 13,046 household (24 per cent) will be benefited.<br />
chart 28: Ratio of different infrastructure projects (under construction)<br />
chart 28.a: Number of Sub-projects<br />
chart 28.b: Benefited Household<br />
266.10%<br />
193.30%<br />
61.90%<br />
86,13%<br />
101,16%<br />
66,10%<br />
143,22%<br />
Rural Access<br />
Community Building<br />
Rural Energy<br />
Small Irrigation<br />
Water Supply & Sanitation<br />
Miscellaneous<br />
7271.13%<br />
9970.18%<br />
10546.20%<br />
13068.20%<br />
13046.24%<br />
Rural Access<br />
Community Building<br />
Rural Energy<br />
Small Irrigation<br />
Water Supply & Sanitation<br />
Miscellaneous<br />
PAF has made agreements with communities amounting Rs 605.4 million to construct these infrastructures. PAF is going to invest Rs 146.8 million for<br />
rural energy. This is the highest amount among under construction category. PAF’s second investment is water supply and sanitation related schemes<br />
where it has invested Rs 143.3 million.<br />
20 ANNUAL PROGRESS REPORT (<strong>2010</strong>/20<strong>11</strong>)
Table 17: Contribution by different agencies for infrastructure under construction<br />
Contribution in Million ( NRs)<br />
SN Type of Infrastructures<br />
PAF Community Others DDCVDC<br />
1 Rural Access 95.8 26.7 74.4 7.9<br />
2 Building 120.1 34.9 1.7 0.6<br />
3 Rural energy 146.8 66.8 133.2 42.7<br />
4 Small Irrigation 94.4 28.2 2.4 0.3<br />
5 Water supply 143.3 43.9 0.2 1<br />
6 Miscellaneous 5.2 1.3 0.1 0<br />
Total 605.4 201.3 2<strong>11</strong>.7 52.1<br />
Communities Contribution for Projects Under Construction<br />
Community has committed to contribute Rs. 201.3 million for under construction infrastructures. Their commitment is highest for rural energy (Rs 66.8<br />
million) and least for miscellaneous Rs 1.3 million).<br />
With respect to total cost, Community’s commitment for contribution is 18.9 per cent in average. This is maximum for water supply and sanitation (23.4<br />
per cent) followed by small irrigation (22.6 per cent) and least for rural access. It is 13.1 per cent with respect to total cost.<br />
Table 18: Communities Contribution for projects under construction<br />
Cost Contribution in per centage<br />
SN Type of Infrastructures<br />
PAF Community Others DDCVDC Total<br />
1 Rural Access 46.8% 13.1% 36.4% 3.9% 100<br />
2 Building 76.4% 22.2% 1.1% 0.4% 100<br />
3 Rural Energy 37.7% 17.2% 34.2% <strong>11</strong>% 100<br />
4 Small Irrigation 75.4% 22.6% 2% 0.3% 100<br />
5 Water Supply 76.1% 23.4% 0.2% 0.6% 100<br />
6 Miscellaneous 78.8% 19.7% 1.6% 0% 100<br />
Total 56.6% 18.9% 19.8% 4.9% 100<br />
ANNUAL PROGRESS REPORT (<strong>2010</strong>/20<strong>11</strong>) 21
2.2.4. Innovative Special Programme<br />
Overview<br />
PAF has been implementing special window programme (innovative)<br />
beyond and within its regular districts. The programme has been<br />
focusing on adopting innovative concept, ideas, process, technology<br />
etc. for the improvement of livelihood of target community. During the<br />
reporting <strong>year</strong>, PAF is still continuing support for innovative programme<br />
as provided in Annex 9.<br />
Besides, PAF also has handled the NDM (<strong>Nepal</strong> Development Market<br />
Place, popularly known as “Launa Aba Ta Kehi Garaun” projects)<br />
which was called on by World Bank in 2008. Most of them have been<br />
completed and some of them are still in the phase of completion.<br />
Successful Completion and Replication<br />
One of the major objectives of PAF is to bring the innovative process,<br />
technology and method in the sector of poverty alleviation. This is the<br />
reason being implementing the innovative and NDM projects so that it<br />
can be replicated to the regular programme. Some of the Projects have<br />
shown the remarkable replications in different parts of the country. For<br />
example, the SRI technology which has been successfully replicated in<br />
Bajura and Siraha districts from its initiation from Morang as an NDM<br />
programme in 2005. The Productivity of paddy has increased more than<br />
double in both the replicated districts compared to conventional method<br />
of paddy cultivation. Similarly, the Wi Fi technology that has been started<br />
by Mahabir Pun as an NDM project supported by PAF, who later won the<br />
Magassasy International Prize, has been widely replicated in Achham<br />
and Bhajang districts and they are doing wonders in those remote and<br />
inaccessible areas in terms of tele-medicine and knowledge. Also with<br />
the effectiveness of such technology Government of <strong>Nepal</strong> freed the<br />
license acquiring fees from 2006 September to IPS up to the capacity<br />
2.4 Gigahertz to 5.8 Gigahertz. Also, after the success of a mechanized<br />
bridge in Tanahu under NDM 2005, similar bridge has been constructed<br />
in Sindhuli.<br />
Learning :<br />
• PAF should undertake more and more innovative programmes<br />
which transfer the technology and process that are pro-poor.<br />
• PAF should undertake such innovative project that focuses on the<br />
policy review of the concerned stakeholders for the welfare of the<br />
poor.<br />
• There should be sufficient time and resources for the successful<br />
replication of the project at regular programme areas.<br />
• PAF should also encourage the individual or an organization to bring<br />
the projects that are innovative and replicable throughout the <strong>year</strong>.<br />
Future Plan<br />
It may be noted that PAF has developed Innovative Sub-projects<br />
Guidelines during the reporting <strong>year</strong>. PAF has also announced to<br />
launch 20 innovative programmes. The applications to conduct such<br />
innovative programmes have been received by PAF and are currently<br />
under processing.<br />
2.2.5. Capacity Development<br />
Capacity development has been the centerpiece of international<br />
development assistance since the end of II World War and the start of the<br />
decolonization period. Capacity development is the major component of<br />
millennium development goals (MDGs) in order to reduce poverty, and<br />
capacity development is one of the core programme components of PAF.<br />
The PAF Perspectives of Capacity Development<br />
PAF is established to support poor women, Dalits, Janajatis and<br />
vulnerable groups for their livelihood improvement and empowerment.<br />
For this, they are organized into Community Organizations (COs). PAF<br />
has mobilized Partner Organizations (POs) to support and facilitate COs<br />
to launch activities in the programme districts. Actually COs implement<br />
PAF activities by themselves but POs act as a bridging agent between<br />
PAF and COs to launch PAF activities.<br />
COs are the primary stakeholders of PAF and are regarded as the<br />
centerpiece of its development effort. Without the capability development<br />
of its primary stakeholders, the expected outcome of the programme<br />
couldn’t be achieved. COs are capacitated in the relevant areas. PAF<br />
aims to institutionalize and strengthen COs for their empowerment<br />
and sustainable development. Hence, Capacity development of COs<br />
is the major thrust of PAF. PAF has incorporated the components like<br />
Social Mobilization, Capacity Building, Income Generation/Employment<br />
Creation and Community Infrastructures in the programme in order<br />
to support COs holistically. From the very beginning, PAF has been<br />
capacitating COs, POs and PAF staff in pertinent themes. Capacity<br />
development of COs is linked to capacity development of POs and PAF<br />
staff.<br />
General Current Trend of Capacity Development of COs<br />
and POs<br />
Since PAF has adopted the demand driven approach. Hence, the technical<br />
and skill enhancement training related to various income generating<br />
activities and community infrastructures are based on the demanded<br />
activities by each members of COs. Other trainings like entrepreneurship<br />
skill development and institutional strengthening are firstly imparted.<br />
Training of Trainers (ToT) to staff of POs and through POs it is imparted<br />
to the members of COs. Because capacity development of COs is linked<br />
to capacity development of POs. POs facilitate COs being in frontline,<br />
their capacity enhancement is imperative to capacitate COs. Hence,<br />
PAF firstly has been imparting ToT on Enterprise Development, Social<br />
Mobilization, Leadership Development and Group Management, Account<br />
and Revolving <strong>Fund</strong> Management and Public Audit to the staff of POs.<br />
Apart from imparting training to the members of COs, the POs do coach<br />
COs during their meetings and technical support.<br />
PAF believes that unless the members of COs have entrepreneurship<br />
skill, the operation and management of income-generating activities<br />
may not sustain at all. Hence, each member of COs is oriented on<br />
Entrepreneurship Skill Development to identify and select appropriate and<br />
profitable economic activities for them. Similarly, the relevant members<br />
of COs are trained in Construction, Operation and Maintenance of<br />
various implemented infrastructures in the community. PAF has adopted<br />
the following approaches to capacitate the COs:<br />
22 ANNUAL PROGRESS REPORT (<strong>2010</strong>/20<strong>11</strong>)
Capacity Development of Community Organizations (COs)<br />
Since COs are the integral elements of PAF, they are given utmost<br />
priority for their capacity development. PAF has been adopting following<br />
approaches to capacitate the COs<br />
• Creating awareness and sensitization through rigorous social<br />
mobilization process<br />
• Facilitating them to be organized into Community Organizations<br />
(COs) to create their own institution. Empower them in decision<br />
making process.<br />
• Facilitating /encouraging them to participate in participatory need<br />
identification, and project cycle management.<br />
The following are trainings that PAF is providing to the COs (details<br />
in Annex 10)<br />
• Organizing orientation on PAF Implementation Process i.e. PAF<br />
polices/strategies, norms and working procedures in order to<br />
implement PAF activities smoothly and effectively. This is firstly<br />
imparted to POs by PAF staff and imparted to COs through POs.<br />
• Organizing Entrepreneurship Skill Development Training i.e. SIYB<br />
and MECD to enable them to identify potential income generating<br />
activities at their local level and operate it sustainably. This training<br />
is firstly imparted to the staff of POs and imparted to COs through<br />
POs.<br />
• Organizing other trainings, orientations and exposures relevant to<br />
institutional development of COs. They are: Leadership Development<br />
and Group Management, Account Management, Revolving <strong>Fund</strong> and<br />
Saving-Credit Management, Public Audit, Cooperative Education<br />
and Management and exposure visit. This training is firstly imparted<br />
to the staff of POs and imparted to COs through POs.<br />
• Organizing technical and skill development and trainings, orientations<br />
and exposures relevant to various economic activities as demanded<br />
by COs. Mostly those trainings and orientation are directly imparted<br />
to COs by hiring resource person. Apart from training, they are<br />
exposed new technologies, and approaches by organizing exposure<br />
visits. If replicable, they may replicate those in their communities.<br />
• Organizing trainings, orientations and exposures on construction,<br />
operation and maintenance of various community infrastructures<br />
as demanded by COs. Such training is directly imparted to the<br />
members of COs by hiring resource person.<br />
• Regular coaching and mentoring to COs by POs entrepreneurship<br />
skill development and institutional development related matters i.e.<br />
Account Management, and Revolving <strong>Fund</strong> Management during<br />
monthly meeting of COs. Particularly, Social Mobilizers coach and<br />
mentor COs in the above matters.<br />
• Facilitating and mentoring COs to establish coordination, linkage and<br />
networking with other organizations for their improved sustainable<br />
livelihood management beyond PAF.<br />
• Organizing Awareness and Social Improvement related orientations<br />
and training by hiring resource person or by coordinating with other<br />
organizations i.e. Health, Hygiene and Sanitation, Gender Sensitivity,<br />
Domestic Violence and Rights Based Approach.<br />
The details of COs capacity development activities are provided in Annex 10.<br />
Capacity Development of Partner Organizations<br />
PAF has been mobilizing POs to facilitate and support COs in planning<br />
and implementation of PAF activities. The POs facilitate COs being in<br />
front line. Hence, capacity enhancement of POs is essential to capacitate<br />
COs.<br />
PAF has been imparting Orientation on PAF Implementation Process i.e.<br />
PAF policies and working procedures, PAF Environmental Framework,<br />
PAF Community Level Infrastructures Implementation Process and ToTs<br />
on Entrepreneurship Capacity Building, Social Mobilization, Leadership<br />
Development and Group Management, Account, Revolving <strong>Fund</strong> and<br />
Saving-Credit Management and other required themes to the staff of<br />
POs. Once they get training, the staffs of POs impart such training and<br />
orientation to the members of COs. Apart from this, the staffs of POs are<br />
taken to exposure visit in best practices of institutional development and<br />
economic activities management. The staff of POs do regular mentoring<br />
and coaching to the members of COs on what they gained during training<br />
and exposures. The detail of the PO capacity development activities is<br />
mentioned in Annex <strong>11</strong>.<br />
Capacity Development of PAF Secretariat<br />
PAF secretariat is established to support poor and vulnerable women,<br />
Dalit, Janajati and other castes for their poverty reduction. It is an<br />
autonomous institution to oversee the overall poverty reduction activities<br />
implemented for the target groups. Hence, the capacity development of<br />
PAF secretariat is very vital to implement PAF programme effectively and<br />
efficiently in the programme districts. If PAF staffers’ capacity is well<br />
strengthened, they transfer this to the staff of POs and the staff of POs<br />
transfers their knowledge and skill to the members of COs. They provide<br />
regular backstopping and mentoring to POs and COs to bring effective<br />
results and outcome of PAF activities in the districts. Apart from this,<br />
they do coordination and networking with the Local Bodies (DDCs &<br />
VDCs), and Line Agencies to leverage resources for the betterment of<br />
target groups. Hence, capacity development of PAF secretariat is linked<br />
to capacity development of POs, COs and Local Bodies.<br />
PAF has, since its inception, been developing the capacity of PAF staff<br />
by organizing a series of Interaction Meetings, Workshops, Orientations,<br />
Training and Exposures. Training is, however organized on the basis<br />
of their need. Training is organized for individual and group based on<br />
specific need. Interaction meetings and orientations are also organized<br />
on pertinent policies/strategies and issues to make the staff aware. Incountry<br />
and international exposure visits are also organized to make<br />
staff familiar with the new practices and approaches.<br />
In-house Workshops and Meetings<br />
PAF organizes in-house workshops and meetings on regular basis. The<br />
objective of organizing such events is to impart knowledge and skill<br />
and discuss on relevant issues. Such events are organized exclusively<br />
for PAF staff and including donors and development partners. Usually<br />
workshops are conducted to impart knowledge and skill to the<br />
participants and meetings are conducted to discuss on relevant issues<br />
and identify approaches and options to address the issues. PAF inhouse<br />
events are presented as followings:<br />
• In order to plan overall PAF divisional activities for the FY 20<strong>11</strong>/12, a<br />
two day residential PAF Annual Planning Workshop took place from<br />
9 to <strong>11</strong> May, 20<strong>11</strong> in Dhulikhel, Kavre district. All PAF professional<br />
staff and some board members namely Dr. Arzu Deuba, Shri Krishna<br />
ANNUAL PROGRESS REPORT (<strong>2010</strong>/20<strong>11</strong>) 23
Upadhaya, Dr. Duman Thapa, Dr. Bal Gopal Baidhaya, Mr. Khalil<br />
Miya and Mr. Rishi Raj Lumsali were present in the worksop. All the<br />
participants actively participated in the workshop and formulated<br />
strategies to implement the planned activities.<br />
• In order to strengthen and intensify PAF-DDCs/VDCs coordination<br />
collaboration in the districts, a two day “Regional Workshop with<br />
MLD was held in <strong>Nepal</strong>gunj from 1- 2 January, 20<strong>11</strong>. PAF district<br />
LDOs, VDC Secretaries and PAF POs from Far, Mid and Western<br />
development regions were present in the workshop. During<br />
the workshop Vice-Chairperson from NPC, Secretary and Joint<br />
Secretary from MLD, Regional Administrators from Far, Mid and<br />
Western development regions were present. Similarly, Regional<br />
Directors for Agriculture Development and Education were also<br />
present. The workshop concluded to go jointly with DDCs and Line<br />
Agencies to reduce poverty and to avoid duplication of programmes<br />
and resources in the Districts.<br />
• In order to strengthen PAF programme further based on<br />
implementation learning, a two day “PAF Programme Review<br />
Workshop” with Central Development Region POs was concluded<br />
from September 28 to 29, <strong>2010</strong> in Janakpurdham of Dhanusa<br />
District. Both the workshops identified and discussed on learning of<br />
successful and failure cases of PAF activities. The workshops thus<br />
organized have drawn recommendations and suggestions to PAF to<br />
formulate policies and strategies to address the failure cases.<br />
Capacity Development of Local Bodies<br />
From the very beginning, PAF has been rigorously coordinating and<br />
collaborating with DDCs and VDCs to implement activities in the district.<br />
Therefore, PAF has been involving DDCs and VDCs to monitor PAF<br />
activities regularly. During monitoring, DDCs and VDCs provide feedback<br />
and suggestions on the activities which helps to further improve and<br />
strengthen gaps and lapses in providing services to the community.<br />
DDCs and VDCs do have government resources for infrastructures and<br />
socio-economic development of district and village. Apart from this, the<br />
sectoral Line Agencies and other developmental organizations do have<br />
resources for the sectoral activities. DDCs is the umbrella organization<br />
to coordinate overall developmental activities in the district. Hence, it<br />
has vital role in forging resources for betterment of poor people. PAF<br />
has been implementing programme in close coordination with DDCs to<br />
forge resources from other organization for the benefit of poor people.<br />
PAF intends to capacitate DDCs based on their capacity development<br />
plan and other themes applicable and beneficial to PAF beneficiaries.<br />
PAF has envisaged to enhance the capacity of DDCs and VDCs in the<br />
following themes:<br />
• Participatory Monitoring and Evaluation<br />
Since DDCs and VDCs are involved in regular monitoring<br />
of PAF activities. This enables them for effective monitoring<br />
and evaluation of PAF and other donors activities in the<br />
district. During the monitoring visit they provide feedback<br />
and suggestions to improve and strengthen PAF programme<br />
further. During the FY 2067/68, DDCs have made 147<br />
monitoring visit in 34 PAF programme districts.<br />
• PAF Programme Review and Coordination Meeting<br />
In order to review PAF progress status, coordination and<br />
review meeting with DDCs and Line Agencies is organized<br />
regularly in the PAF programme districts. During the meeting,<br />
DDC and Line Agencies provide feedback and suggestions,<br />
which contributes further improvement and strengthening of<br />
PAF activities. Apart from that, such meeting acts as platform<br />
to forge resources for the betterment of target groups. During<br />
the FY 2067/68, PAF organized 72 events of coordination<br />
and review meeting with DDCs and Line agencies in 34 PAF<br />
programme districts.<br />
• TOT on Entrepreneurship Skill Development<br />
PAF has been conducting TOT on Enterprise Development to<br />
the staff of POs in the district. The main objective of TOT is<br />
to develop entrepreneurship skill among the members of COs<br />
through POs. After getting TOT, the POs impart such training<br />
to the members of COs. Being a permanent institute in the<br />
district; DDCs must have human resource knowledgeable in<br />
entrepreneurship skill development. In that case, they can<br />
impart such training to beneficiaries beyond PAF and other<br />
projects. Hence, in some district PAF has involved the relevant<br />
staff of DDC in the entrepreneurship skill development training.<br />
• Collaboration and Coordination with LGCDP<br />
LGCDP is a development programme supported by many<br />
donors to work for the overall development of district.<br />
LGCDP activities are launched through DDCs in the district.<br />
Along with development activities, LGCDP has also capacity<br />
development component which assesses the overall district<br />
level Capacity Development Need and acts to address that.<br />
So, PAF could collaborate with LGCDP to identify the capacity<br />
development needs in the district which could be linked to<br />
capacity development and benefit to PAF COs.<br />
• VDC and Ward Level Orientation on PAF<br />
PAF has been implementing its activities in the target<br />
communities in the VDC. While entering the VDCs to launch<br />
activities, PAF has been conducting VDC and Ward level<br />
orientation on PAF. This has helped PAF to get VDC support<br />
and feedback to identify target communities and launch PAF<br />
activities effectively.<br />
• Organize Exposure Visit to DDC Personnel<br />
PAF has been organizing regular exposure visits to POs and<br />
COs. PAF has envisaged including VDCs staff along with POs<br />
exposure visit event.<br />
24 ANNUAL PROGRESS REPORT (<strong>2010</strong>/20<strong>11</strong>)
Chapter 3:<br />
information,<br />
monitoring and<br />
evaluation<br />
3.1. MIS, Monitoring and<br />
Evaluation<br />
Monitoring and evaluation (M&E) is an inextricable part of PAF’s<br />
mission, providing an analytical basis for programmatic decisions,<br />
allowing PAF to learn from its experiences, and share the impact and<br />
lessons with different stakeholders. This has been supported by the<br />
PAF MIS system. PAF MIS system help the management in processing<br />
its activities, managing contracts with CO/PO, monitoring and taking<br />
informal decisions. The major MIS development in PAF includes PMIS<br />
(Programme Management Information System), HRIS (Human Resource<br />
Information System), AMIS (Administration Management Information<br />
System) and FMIS (Financial Management Information System).<br />
Further PMIS is linked with FMIS to track the fund flow to community<br />
organizations.<br />
PAF’s monitoring data is developed on 5 different databases which<br />
support the process of working with partner and community<br />
organizations and monitoring the sub-project activities (figure 1). These<br />
databases provide a rich source of information on PAF activities and<br />
have been increasingly analyzed to improve planning and address<br />
weaknesses in the project implementation process and to identify areas<br />
of strength that can be scaled up.<br />
PAF’s monitoring focuses on the progress, process, compliances and the<br />
results of the project activities. PAF has been encouraging all the stakeholders<br />
to be involved in the monitoring process of the projects activities.<br />
As community is at the driving seat of the PAF’s programme, monitoring<br />
by the community is essential for the compliances and the results of the<br />
programme. Thus, the monitoring sub- committee of each community<br />
organizations (CO) is responsible to monitor the activities carrying by the<br />
respective COs. Besides, the social mobilizers assigned by the partner<br />
organizations (POs) are also responsible to facilitate the monitoring subcommittee<br />
for the effective monitoring and also monitor the activities of<br />
COs by themselves.<br />
Besides, the POs -programme coordinators, supervisors and board<br />
members are also responsible to monitor or track the progress and the<br />
compliances made by the community organizations.<br />
The Portfolio Managers (PMs) and the consultant assigned by the PMs,<br />
appraisal and monitor the activities of the POs as well as COs. Similarly,<br />
in periodic basis, the local bodies’ representatives (DDC, VDC and other<br />
line agencies) also carry out the monitoring visits in the PAF working<br />
areas of the districts.<br />
Further, the PAF central level also carries out monitoring visits in the<br />
districts in periodic basis. Likewise, PAF Board Members, representatives<br />
from line ministries and representatives from the World Bank also carry<br />
out monitoring visits in periodic basis.<br />
Further PAF has been reporting its progress against the set indicators on<br />
regular basis. For detail refer to Annex 12.<br />
Partner Organization<br />
Selection<br />
Community organization<br />
selection and registration<br />
Community: Selection<br />
priority activites<br />
Community:<br />
Implementation of<br />
activites<br />
Partner Organization<br />
Selection<br />
Community<br />
organizations database -<br />
Beneficiary Assessment<br />
Community<br />
Agreements database<br />
Sub-project<br />
Projects database<br />
Revolving <strong>Fund</strong><br />
database<br />
ANNUAL PROGRESS REPORT (<strong>2010</strong>/20<strong>11</strong>) 25
3.2. Results From Monitoring<br />
Data Analysis<br />
The re-social assessment of the sample 289 COs which are three or more<br />
than three <strong>year</strong>s of maturity period was carried out during <strong>2010</strong>.<br />
The comparative analysis of the re-social assessment data with the<br />
baseline social assessment shows that HH level assets increased, School<br />
enrollment of the children increased, improvement in food sufficiency<br />
duration of individual HH, and Construction and use of toilet/latrine<br />
increased.<br />
Similarly, the household level gross income (from all the sources) of the<br />
re-assessed 8,168 HHs has increased by 82.5 per cent in real term. A<br />
district-wise gross annual income change of CO members is provided in<br />
Annex 13. g <strong>year</strong>. The data was collected till November 15, 2009.<br />
The revolving fund assessment carried out during the end of FY<br />
2066/67, shows that community has been managing their revolving fund<br />
satisfactorily (Annex 14). The data collected as of July 16, <strong>2010</strong>, shows<br />
that fund provided to the COs by PAF has been increased by 7.8 per cent<br />
which includes the interest charges against the loan taken by its members,<br />
community contribution and fund collected from other sources.<br />
Similarly, among the total CO members, 84.6 per cent of the members have<br />
accessed the fund at least for one time to initiate their income generation<br />
activities. Out of the total members accessing the fund from RF, 8.72 per<br />
cent members have used the fund for more than two times, 19.77 per<br />
cent members have used two times and 71.51 per cent members have<br />
used one time.<br />
The assessment also shows 83.8 per cent of the total fund has been<br />
invested as loan to its members, 14.1 per cent of the fund is in bank and<br />
rest amount is as cash in hand in COs itself. Further, assessment shows<br />
that the average rate of repayment of the loan disbursed is 76 per cent<br />
3.3. Environmental Framework<br />
and Monitoring<br />
Majority of PAF supported sub- projects are of small and micro<br />
scales hence they hardly fall under legal obligations for environmental<br />
assessment. However, PAF realizes that even micro/small scale<br />
projects may have some environmental implications and has laid<br />
down Environment Management Framework (EMF) to address them as<br />
precautionary principles. EMF has standardized methods for the subprojects<br />
to assess the environmental problems associated with their<br />
implementation and ways to mitigate them.<br />
According to PAF EMF environmental assessment and planning mandatory<br />
during the project preparation for sub-project’s approval. Possible risks of<br />
proposed sub-project and their mitigation measures are identified by the<br />
community and documented as Environmental and Social Assessment<br />
(ESA) Checklist in facilitation from the partner organization. PAF monitors<br />
the compliance to this process during the sub project appraisal. During<br />
project implementation, PAF reviews the progress on implementation of<br />
the mitigation measures outlined in the ESA checklist. Both compliance<br />
and impact monitoring on environment are important components while<br />
conducting regular sub project monitoring.<br />
In addition, the monitoring team of Environmental Consultant also carries<br />
out special environmental monitoring of sub projects on sample basis.<br />
ERMC P. Ltd. In Association with SchEMs P. Ltd. has been working as<br />
environmental consultant from February 20<strong>11</strong>. 72 sub projects in six<br />
districts were monitored in FY <strong>2010</strong>/<strong>11</strong> by the environment consultant.<br />
Monitoring reports has not pointed out major harmful implications of the<br />
PAF IG or Infrastructure development activities on the local environment.<br />
The monitoring result has rather shown that Community-level<br />
environmental assessment and planning has increased environmental<br />
awareness among target communities and ensured environmental<br />
friendliness of the sub-projects.<br />
3.4. PO Performance<br />
Evaluations<br />
From the last FY 2066/67, PAF has initiated to evaluate the performance<br />
evaluation of the POs in different aspects. The evaluation was done in<br />
2 major areas. The first section is focused on the PO’s organizational<br />
chart 29: Ranking of POs<br />
Not participated<br />
D (Less than<br />
<strong>11</strong><br />
50%)<br />
<strong>11</strong>7<br />
C (50-64%)<br />
181<br />
B (65-79%)<br />
44<br />
A (80% or more)<br />
357<br />
Total<br />
0 100 200 300 400<br />
capacity to deliver the services as defined in the TOR and the second<br />
section is focused in how the COs/Beneficiaries perceive the services<br />
provided by the POs to them.<br />
The overall objective of this process is to strengthen the PAF M&E<br />
system effective and assess the effectiveness of the services provided<br />
by the PO s to the COs.<br />
During the FY 2067/68, POs’ perfornmance evaluation was also<br />
conducted. The total number 357 POs were evaluated and based on<br />
the results, the POs were entered into agreement for partnership with<br />
PAF to work in FY 2068/69 accordingly. The following graph shows the<br />
rankingof POs based on the score obtained in the evaluation process.<br />
3.5. Impact Evaluation<br />
Baseline Survey<br />
4<br />
Number of POs<br />
Centre for Economic Development Administration/Tribhuvan University<br />
(CEDA/TU) has been selected for conducting the baseline survey in<br />
30 new districts. The contract has been done during this <strong>year</strong> and the<br />
preparation works conducting the survey is ongoing.<br />
26 ANNUAL PROGRESS REPORT (<strong>2010</strong>/20<strong>11</strong>)
Impact Study<br />
The final report of the follow up survey in 6 sample districts of 19 districts<br />
has been produced. The analysis of the cleaned data provided by the<br />
CEDA/TU was done by the team from the World Bank. The summary<br />
of the findings is described in chapter 5. Similarly, the World Bank has<br />
also produced a brochure ‘<strong>Nepal</strong> <strong>Poverty</strong> <strong>Alleviation</strong> <strong>Fund</strong>: Evaluating<br />
Impact’, based on the results of the study.<br />
3.6. Communications, Outreach<br />
and Publications<br />
PAF has laid significnat emphasis for communicaitons as it is critical<br />
to create demand from beneficiaries ensure transparency and foster<br />
partnership and learning across stakeholders.<br />
PAF communication strategy aimed to disseminate PAF approach/<br />
procedure/rules to the related stakeholders, develop the external and<br />
internal communication capacity of PAF and identify and develop<br />
communication messages for PAF, as well as disseminate best practices<br />
and success stories<br />
Some of the major activities that were initiated and continued during the<br />
reporting <strong>year</strong> include.<br />
• Weekly Radio Programme from Different FM Radios <strong>Nepal</strong><br />
• Publication of Newsletter “Jeevika” –both in English and <strong>Nepal</strong>i on a<br />
regular basis.<br />
• Dynamic websites created, updated regularly<br />
• Annual Reports—both national and district based publications,<br />
Brochures, Fact Sheets, Mini Brochures publications<br />
• Success stories and cases collections<br />
• Different interaction meetings and workshop at the local and national<br />
level<br />
• Extensive media coverage at the local level and national levels<br />
• PAF has updated its Programme Implementation Guidelines and<br />
published it during the reporting <strong>year</strong>.<br />
• PAF has prepared and published a guideline for Community<br />
Infrastructure Sub-projects during the reporting <strong>year</strong>.<br />
Since PAF work is now increased in terms of its coverage and depth,<br />
there is a growing need to generate greater awareness based on the<br />
results. A proactive communication and outreach strategy will be of<br />
highly important in this regard. PAF will work with all stakeholders to<br />
keep them abreast of the important developments and disseminating the<br />
information at national and international forums.<br />
3.7. Grievance Handling<br />
Since the beginning of the reporting <strong>year</strong>, PAF has developed a grievance<br />
handling system to record and response any complaints on practices,<br />
policies and procedures of PAF at the centre as well a the grass roots<br />
level. A complaint for PAF is defined as individuals or group’s displeasure<br />
with the Handling of PAF works, any aspect of the service provided, or<br />
not provided, in any PAF involved programme or site, the behavior or<br />
decisions of PAF and PO’s staff, among others.<br />
A concept note of PAF grievance handling mechanism was developed<br />
and a sub-committee of the board members was also formed to oversee<br />
and supervise grievance handling system in PAF. PAF has developed<br />
a direct email to the vice chairperson, executive director and the<br />
programme chief in its website. The PAF can use the already installed<br />
suggestion box in its central office. Any complain coming either from<br />
a direct email to the PAF Vice Chairperson, Executive director, website<br />
email, or telephone, or any other means are recorded and registered<br />
in a complaints register, with the updated status of the complaint and<br />
remedial actions taken.<br />
So far, complaints are being made related to the field level misuse of PAF<br />
fund, activities of PO, exclusion of hardcore poor, and selection of PO<br />
in the districts, among others. PAF programme division chief is directly<br />
overseeing all the grievance related activities.<br />
• Orientations programme and stakeholders consultations at the local<br />
level<br />
ANNUAL PROGRESS REPORT (<strong>2010</strong>/20<strong>11</strong>) 27
28 ANNUAL PROGRESS REPORT (<strong>2010</strong>/20<strong>11</strong>)
Chapter 4:<br />
partnership and<br />
collaboration<br />
PAF belives that to alleviate the poverty partnership is very significant.<br />
It is imperative to join hands with the like minded agencies for the nobel<br />
cause of poverty alleviation. Hence PAF gives top pirority for partnership<br />
and collaboration with different agencies (Governmental and Non<br />
Governmenal) both at the central level and at the district level. The<br />
different efforts related to partnership forging and collaboration for the<br />
period of <strong>2010</strong> to 20<strong>11</strong> are mentioned below.<br />
A national level coordination meeting in chairmanship of the Chief<br />
Secretary of Government of <strong>Nepal</strong> was carried out in order to implement<br />
the program more effectively in coordination with the government line<br />
agencies. Further, PAf Board started to invite the Chief Secretary of<br />
Government of <strong>Nepal</strong>, Secretary of Ministry of Finance and Secretary of<br />
Ministry of Local Development as an observer in the Board meetings to<br />
enhance coordination with the government agencies.<br />
Several MoUs have also been signed with different organizations at<br />
central level to facilitate different tasks as well as to facilitate collaboration<br />
in implementation of sub-projects at community level.<br />
1. MoU with MoLD<br />
On 8 October <strong>2010</strong>, Ministry of Local Development (MoLD) and the<br />
<strong>Poverty</strong> <strong>Alleviation</strong> <strong>Fund</strong> (PAF-<strong>Nepal</strong>) agreed to work together by signing<br />
a Memorandum of Understanding and forming a strategic alliance to<br />
alleviate poverty through synergic efforts between the two institutions.<br />
The MoU was signed by Mr Som Lal Subedi, Joint Secretary, MoLD and<br />
Mr Raj Babu Shrestha, Executive Director of PAF, in the presence of PAF<br />
Vice Chairperson, Mr Vidyadhar Mallik and MoLD secretary Mr. Krishna<br />
Gyawali.<br />
The MoU entails increased coordination and linkages during project<br />
planning, implementation, monitoring, reporting and review while<br />
implementing targeted poverty alleviation and empowerment initiatives<br />
at the local level.<br />
2. MoU with WFP<br />
On 30 August <strong>2010</strong>, The United Nations World Food Programme (WFP)<br />
and the <strong>Poverty</strong> <strong>Alleviation</strong> <strong>Fund</strong> (PAF), two of the largest organisations<br />
working in <strong>Nepal</strong>’s most food insecure areas, joined forces by signing<br />
a Memorandum of Understanding and forming a strategic alliance to<br />
alleviate poverty and food insecurity in the Mid to Far-Western Hill and<br />
Mountain regions.<br />
WFP and PAF will collaborate to provide vital food and nutrition<br />
assistance whilst engaging beneficiaries in income generating and<br />
community infrastructure projects through food/cash-for-work. Specific<br />
projects to be considered include: small scale irrigation, cash crop<br />
plantation, enhanced farming techniques and poultry farming. WFP also<br />
plans to provide food for training activities that will benefit members of<br />
community organizations of PAF.<br />
3. MoU with GIZ<br />
On 29 April 20<strong>11</strong>, The German Development Cooperation (GIZ) and<br />
<strong>Poverty</strong> <strong>Alleviation</strong> <strong>Fund</strong> (PAF-<strong>Nepal</strong>) have agreed to work together in<br />
the common working districts and municipalities of <strong>Nepal</strong>.<br />
Building on the core competencies of each other, PAF and GIZ assisted<br />
three different programmes will collaborate to improve and strengthen<br />
pro-poor governance at the local level and facilitate local level planning<br />
to articulate the voice of the disadvantaged population at the district<br />
development committee (DDC) and municipality level.<br />
Under the new arrangement, both the institutions would work together to<br />
ensure the access of poor and marginalized population to public goods<br />
and services, provide market information to farmers through market<br />
information systems and support in market linkages of agricultural<br />
products, among others.<br />
4. MoU with USAID Supported EIG<br />
On 13 Dec <strong>2010</strong>, USAID sponsored Education for Income Generation<br />
and Conflict Mitigation project and <strong>Poverty</strong> <strong>Alleviation</strong> <strong>Fund</strong> (PAF-<strong>Nepal</strong>)<br />
have agreed to work in tandem targeting the unemployed youths of the<br />
Mid Western Development region of <strong>Nepal</strong>.<br />
Building on the core competencies of each other, both the programme<br />
will collaborate in assessing the need for job creation, developing and<br />
imparting applicable training for eligible youths and extending support for<br />
enterprise development and job creation through a package programme.<br />
Under the new arrangement, the youths of the under-served region<br />
will receive trainings in literacy, life skills, vocational education and<br />
ANNUAL PROGRESS REPORT (<strong>2010</strong>/20<strong>11</strong>) 29
agriculture trade including Non-Timber Forest Products (NTFPs),<br />
commercial farming of vegetables, among others. Also, the poor<br />
farmers will be informed about the appropriate technology related to the<br />
commercial farming of vegetables and processing of NTFPs-- Medicinal<br />
and Aromatic Plants.<br />
5. MoUs with Heifer, Practical Action and<br />
LFLP<br />
On 29 July 20<strong>11</strong>, The <strong>Poverty</strong> <strong>Alleviation</strong> <strong>Fund</strong> (PAF-<strong>Nepal</strong>) joined forces<br />
with two international non-governmental organizations and one national<br />
programme aiming to establish synergies in poverty alleviation efforts<br />
at the grass roots and ensure increased opportunities for the poor and<br />
disadvantaged people.<br />
PAF signed three separate memorandums of understanding (MoUs)<br />
with Practical Action <strong>Nepal</strong>, Heifer International <strong>Nepal</strong> and Department<br />
of Forest, Leasehold Forestry and Livestock Programme (LFLP) to work<br />
together on fighting poverty in common working districts.<br />
As part of the understanding with LFLP, PAF supported community<br />
organizations would have easy access of leasehold forestry while<br />
leasehold forestry users groups would be facilitated and encouraged to<br />
enter in community organizations formed under the aegis of PAF. Also,<br />
both the programmes have agreed not to form separate community<br />
organizations in the new working areas. “PAF would also acknowledge<br />
the leasehold forestry user’s groups if the members qualify PAF’s<br />
poverty ranking criteria”, reads the MoU. Both the programme would<br />
ensure the participation and leadership of Women, Dalit, Janajatis and<br />
members of the marginalized groups in community groups. A 7-member<br />
Central Coordination Committee has been formed under the leadership<br />
of PAF Vice Chairperson while a 12-member district level coordination<br />
committee would be headed by the District Development Committee<br />
(DDC) Chairperson.<br />
Under the MoU with Practical Action, PAF and Practical Action would<br />
work together to improve communities’ access to services by supporting<br />
them to choose and adopt the mode of transport that better serve them.<br />
Also both the institutions would work to improve the agricultural income<br />
by enhancing the production through pocket area development and<br />
providing the agricultural products easy access to market outlets through<br />
developing Gravity Goods Ropeways and other pro-poor technologies.<br />
The alliance with Heifer entails joint planning to identify poverty ridden<br />
clusters, feasible production clusters, seek support from the related<br />
government ministries and achieve national priorities. “As PAF intends<br />
to support in activities like income generation activities and rural<br />
infrastructure building as per the demand from the community, Heifer<br />
would complement in income generation, improving nutrition, improving<br />
environment as well as in social mobilization activities, “ states the MoU,<br />
“Periodic reviews of the partnership would be made as appropriate for<br />
highest synergy from expertise of the parties.”<br />
6. MoU with Helvetas<br />
On 7 February 20<strong>11</strong>, Helvetas <strong>Nepal</strong> and the <strong>Poverty</strong> <strong>Alleviation</strong> <strong>Fund</strong><br />
(PAF-<strong>Nepal</strong>) joined forces forming a strategic alliance to enhance the<br />
livelihoods of the rural poor. The alliance, to begin from Bardiya district<br />
with possible expansion to other districts, entails joint activities to reduce<br />
the vulnerability and increase resilience of the disadvantaged people and<br />
increase agricultural productivity.<br />
Both the institutions have agreed to work together to facilitate access<br />
to common land resources for land-poor and landless and disseminate<br />
appropriate technologies for the promotion of commercial farming of<br />
vegetables particularly in riverbeds, but later also on rain-fed agricultural<br />
land and other suitable areas. Also, they have agreed to establish<br />
synergies to support poor farmers on market linkages of agricultural<br />
products provide access to irrigation and drinking water and facilitate<br />
local level planning at ward and village development committee (VDC)<br />
level.<br />
7. MoU with FNCCI to work Jointly to<br />
Promote Agri-business<br />
On 21 November <strong>2010</strong>, <strong>Poverty</strong> <strong>Alleviation</strong> <strong>Fund</strong> (PAF-<strong>Nepal</strong>) and<br />
Federation of <strong>Nepal</strong>ese Chambers of Commerce and Industry (FNCCI)<br />
have joined hands to promote agriculture related business including<br />
livestock and Non Timber Forests Products(NTFPs) aimed at alleviating<br />
poverty and economic development.<br />
The MoU entails both the institutions engagement on capacitating the<br />
Community Organizations (COs) to carry out agriculture and livestock<br />
related business and establishing small processing enterprises<br />
producing high value products. The MoU also paves ways for involving<br />
COs in profitable and market oriented production and improved access<br />
to market through the provision of technology and information service as<br />
well as critical public infrastructure for promoting agribusiness, states a<br />
joint statement issued after the signing of the agreement.<br />
To be implemented in 40 PAF programme districts, the agreement is<br />
also expected to create and strengthen industry-wide partnerships along<br />
the value chain and thus forging linkage between producers, traders,<br />
processors and other stakeholders.<br />
8. Other MoUs<br />
Besides the different MoUs reached during the reporting <strong>year</strong>, PAF is<br />
continuing different MoUs with different institutions and programme,<br />
signed before the reporting <strong>year</strong> including the MoU with Alternative<br />
Energy Promotion Centre (AEPC).<br />
30 ANNUAL PROGRESS REPORT (<strong>2010</strong>/20<strong>11</strong>)
LIVESTOCK INSURANCE PROVIDING<br />
BOON FOR COMMUNITY<br />
By Umeed Bagchand<br />
Success Story<br />
We have heard a lot about life insurance. But, the poor and<br />
backward communities of Achham district in far-west region are<br />
these days insuring their livestock. Just as sudden demise of<br />
household head pushes families in financial troubles, sudden<br />
death of livestock reared on loans taken from community<br />
revolving fund can also land the families into troubles. Hence,<br />
through livestock insurance poor people are safeguarding<br />
themselves from possible risks and losses. And their initiative<br />
has become exemplary for others as well.<br />
In a place where people were facing difficulties to fulfill days<br />
end, buying insurance cover for livestock was not an easy task.<br />
But thanks to PAF’s initiatives, community people are enjoying<br />
the facility with relative ease. PAF pushed for livestock insurance<br />
mainly because the prices of livestocks were skyrocketing<br />
and any loss of such expensive wealth would only worsen the<br />
situation for the poor. Besides, as risks associated with livestock<br />
remained high in remote districts, many community people were<br />
disenchanted to pursue livestock rearing. But thanks to PAF’s<br />
endeavor, community people decided to work for the introduction<br />
of this safety net, instead of turning away from the business.<br />
The credit of introduction of this facility goes to the local<br />
network of community organizations though. In a bid to avoid<br />
the loss and safeguard community members during loss,<br />
the network organized trainings to the CO members. “Rama<br />
Roshan Development Society also supported us immensely<br />
in introducing livestock insurance,” said Nain Bahadur BC,<br />
secretary of the CO network.<br />
The network has mobilized respespective communities involved<br />
in livestock rearing to insure their animals. For the cover, CO<br />
members sign an agreement with Livestock Insurance CO. PAF<br />
has facilitated them by layin down detail procedures on how<br />
livestock insurance should be implemented. The manual is pretty<br />
similar with norms of life insurance. Separate provisions have<br />
been put in place for insurance of big and smaller livestock. The<br />
initial cost incurred while registering for the livestock insurance<br />
is borne equally by the members and PAF. The cost of renewal,<br />
however, needs to be shouldered by the livestock owners<br />
themselves.<br />
If a livestock died due to natural reason, the insurer CO<br />
compensates to members 80 per cent of its total cost price.<br />
“Insurance has been arranged considering the overall needs<br />
of the VDCs,” said Pramod Joshi, PAF’s Portfolio Manager for<br />
Achham district.<br />
The introduction of the service has greatly relieved the farmers<br />
who used to suffer the most from loss of livestock. Many farmers<br />
are already enjoying the benefits from this financial cover. As a<br />
result, people who made mockery of the service in the beginning<br />
too have started to take the service. “The motive of the service<br />
is not to earn profit, but to support the CO members that are<br />
pursuing livestock rearing,” said Khamba BC, a member of the<br />
CO that introduced the service with PAF support.<br />
Mangalsen CO that is formed by 25 PAF COs is implementing<br />
the livestock insurance service. “The demand for the service<br />
has increased as more community members started to realize<br />
its importance,” said Jung Bahadur <strong>Nepal</strong>i, Chairman of<br />
Mangalsen CO.<br />
(Bagchand is a BBC Correspondent)<br />
ANNUAL PROGRESS REPORT (<strong>2010</strong>/20<strong>11</strong>) 31
Success Story<br />
Pig farming transforms<br />
lives of Dalits<br />
Darabatti Mallik, a member of impoverish Dum community --<br />
one of the poorest and excluded ethnic groups of Siraha district,<br />
has undergone a sea change in her life through pig rearing. This<br />
income generating activity she started with the support of PAF<br />
two <strong>year</strong>s ago not only helped her save her husband life when<br />
he suffered brain hemorrhage while working in others’ pig farm,<br />
but also enabled her enroll children for education and owner of a<br />
residential plot and herd of pigs.<br />
Darabatti had started rearing pigs with <strong>11</strong> piglets that she bought<br />
with loans support of Saraswoti-Jyoti Community Organization<br />
of PAF. “Brain hemorrhage of my husband suddenly landed me<br />
in helpless situation. I needed to treat him and also take care of<br />
the children, whereas we had no money and property to support<br />
that,” she recalled her plight.<br />
Commencement of PAF program, however, came as a boon for<br />
her. “Now all my financial woes have vanished -- thanks to soft<br />
loans the CO provided to its members,” she added.<br />
After six months of starting the farm, she jumped into meat<br />
retailing. With assistance of her husband’s younger brother, she<br />
still runs the meat shop in weekly markets in Lahan and Thadi,<br />
the local business hubs.<br />
With the income, she could afford decent treatment for her<br />
husband in Siliguri of India. “This has remarkably improved his<br />
health. Now he even extends me a helping hand in the farm,”<br />
she smiled.<br />
Over these <strong>year</strong>s, her son, Pashupati Mallik, passed out of<br />
school leaving certificate exams. He recently joined <strong>Nepal</strong> Police<br />
service as well. “Other three children are studying in an English<br />
medium school,” she stated.<br />
Darabatti is now planning to build a house in her own residential<br />
plot that she bought along Lahan-Thadi road segment. According<br />
to Darabatti, she cleared her initial loans, but still owes Rs 19,000<br />
that she took as loans from the CO few months ago.<br />
Inspired by Darabatti’s success, 17 of 23 Dalit members of<br />
Saraswoti-Jyoti CO have jumped into pig farming. “These<br />
supports of PAF have spurred very positive outcome in the<br />
lives of the rural poor,” said Tej Narayan Chaudhary, president<br />
of Gramjyoti Development Center, a partner organization of PAF.<br />
He added that the impact could further multiply if rural roads are<br />
extended and markets developed in the villages.<br />
(Courtesy: Gorkhapatra daily)<br />
32 ANNUAL PROGRESS REPORT (<strong>2010</strong>/20<strong>11</strong>)
Chapter 5:<br />
THE OUTCOME<br />
AND RESULT<br />
This chapter discuss the the outcome of some<br />
of the major studies relating to PAF results on<br />
the ground.<br />
During the reporting <strong>year</strong>, some of the few imporatant outcome study<br />
were done including the details report of the impact evaluaiton study<br />
conducted by CEDA, TU.<br />
An Independetn PAF impact evluation, conducted in six sample districts,<br />
and three control districts, show that the programme impact on real<br />
per capita consumption growth was 31 per cent over a two <strong>year</strong> PAF<br />
intervention period. This is impressive in the context of the same analysis<br />
which indicates that in the absence of the PAF programme, the targeted<br />
households would have recorded about negative 2 per cent growth.<br />
The estimated net programme impact on per capita consumption (in real<br />
terms adjusted for price inflation) growth is 13 per cent for PAF Income<br />
Generating (IG) participant households, 28 per cent for PAF money<br />
recipient households and 49 per cent for those beneficiaries who have<br />
received the money for at least six months. The net impact in the growth<br />
in per capita consumption is even higher for Dalit and Janajatis and<br />
for the poorer segments of the population, implying program’s ability to<br />
distribute growth towards targeted groups.<br />
The evaluation data shows a 10 per centage point decrease in incidence<br />
of food insufficiency and 7 per centage point increase in school enrolment<br />
rate for children aged 6-15. The programme effect is also seen in access to<br />
services (agriculture centers, community forest groups, farmer’s groups)<br />
and women’s empowerment. For child malnutrition (stunting, underweight)<br />
a higher, positive impact is seen for children between 1-2 <strong>year</strong>s of age<br />
amongst PAF supported households. (See details in Annex 21)<br />
A social re-assessment study of 289 sample COs from 24 programme<br />
districts covering 8,168 HHs, has shown that the average income of<br />
individual households has increased by 82.5 per cent. The comparative<br />
analysis, with three or more than three <strong>year</strong>s of maturity period, shows<br />
that HH level assets and school enrollment status of the children have<br />
increased while there was a marked improvement in food sufficiency<br />
for individual households. Also,construction and use of toilet/latrine was<br />
increased.<br />
The data also shows that among the 8,168 CO members HHs, the<br />
average real income at the HHs level is increased by 82.5 per cent (See<br />
Annex 13)<br />
One another analysis on revolving fund status at CO level, carried out<br />
during the end of FY 2066/67, shows that communities are managing<br />
their revolving fund satisfactorily. The data collected, shows that PAF<br />
provided fund has increased by 7.8 per cent. Similarly, among the<br />
total CO members, 84.6 per cent of the members have accessed the<br />
fund at least for once to initiate their income generation activities.<br />
The assessment also shows 83.8 per cent of the total fund has been<br />
invested as loan to its members, 14.1 per cent deposited at the bank<br />
and the remaining fund is with the COs in the form of cash. Further,<br />
assessment shows that the average rate of repayment is 76.1 per cent.<br />
(See Annex 14)<br />
ANNUAL PROGRESS REPORT (<strong>2010</strong>/20<strong>11</strong>) 33
34 ANNUAL PROGRESS REPORT (<strong>2010</strong>/20<strong>11</strong>)
Chapter 6:<br />
Financial<br />
Management<br />
This chapter discuss the the outcome of some of the major<br />
studies relating to PAF results on the ground.<br />
6.1. Financial Planning and<br />
Management<br />
PAF Financial Management System consists of three pillars namely-<br />
Financial Planning, Financial Management and Financial Reporting.<br />
Financial management is directed by Applicable Accounting Standards<br />
which is accepted both by Government of <strong>Nepal</strong> and World Bank. It also<br />
fulfills the requirements of partner organizations. Financial Management<br />
System of PAF is governed by Financial Management Manual.<br />
PAF accounting system is based on Cash basis. It maintains all books of<br />
accounts relating to receipts and expenditures. PAF maintains its books<br />
of account on computerized accounting software-Fin App.<br />
For effective implementation of PAF activities and monitoring of<br />
documents, regular auditing is done by internal and external auditors.<br />
M/S P.P. Pradhan & Company is assigned as internal auditor for the<br />
FY 2066/67 and FY 2067/68. Similarly, external audit is carried out by<br />
Office of Auditor General.<br />
For effective planning and monitoring of funds, PAF has signed separate<br />
MoU with Rastriya Banijya Bank (RBB) and <strong>Nepal</strong> Bank Limited<br />
(NBL). PAF has opened Main account and along with main account,<br />
separate bank accounts are opened for PAF operating expenses and for<br />
Programme expenses. Also, RBB and NBL have opened Operating bank<br />
account for each community organization in their concerned districts.<br />
PAF prepares Implementation Progress Report (IPR) on a trimester basis<br />
for the purpose of review by internal management and reporting to the<br />
World Bank., The report is comprised of different sections including brief<br />
description of project progress. The IPR is the comprehensive report<br />
that includes various reporting formats, which cover financial, physical<br />
progress, contract expenditure and procurement information. The report<br />
2A discloses the information on sources and uses of funds. Likewise,<br />
2B provides information on uses of funds by project activity and 2C<br />
is the section that gives information on IDA eligible expenditure and<br />
the disbursement status. Section 2D is for reconciliation statement of<br />
special account and the projection for the forthcoming trimester.<br />
Review of physical progress section provides all information on the<br />
achievement against planned with regards to major physical indicators<br />
set by PAF. Contract expenditure report has two parts- goods and<br />
The funds flow modality of PAF with community organization is as follows:<br />
Figure : PAF <strong>Fund</strong>s Flow Modality<br />
PAF<br />
Level<br />
(Centre)<br />
CO Level<br />
(District)<br />
PAF<br />
Program<br />
A/C<br />
Community<br />
Operating A/C<br />
consultants. Furthermore, goods and consultancy are categorized on the<br />
basis of prior or post review threshold. Similarly, procurement section<br />
has two parts -goods and consultancy. Furthermore, procurement of<br />
consultant has been categorized as individual consultant and firm<br />
consultant. Whether procurement is prior or post review depends upon<br />
the threshold for procurement of goods and consultants.<br />
6.2. Procurement<br />
PAF<br />
Main A/C<br />
Community<br />
Contribution<br />
PAF<br />
Operating<br />
A/C<br />
Partner Organization<br />
(PO) Provide<br />
Technical Assistance<br />
to Community<br />
Organization (CO)<br />
Annual procurement plan (PP) for the FY <strong>2010</strong>/<strong>11</strong> has been prepared<br />
and implemented. The PP covers procurement of services, goods<br />
and non-commodity services. Based on the Public Procurement<br />
Act 2063 Public Procurement Regulation 2064 and the World Bank<br />
Procurement Guideline, PAF has prepared a procurement guideline and<br />
all the procurement of goods and services are procured by following the<br />
guideline.<br />
6.3. Budget and Expenditure<br />
The total expenditure in FY 060/61 (2003-04), FY 2061/62 (2004-05),<br />
FY 2062/63 (2005-06), FY 2063/64 (2006-07), FY 2064/65 (2007-08),<br />
FY 2065/66 (2008-09), FY 2066/67 (2009-10) and FY 2067/68 (<strong>2010</strong>-<br />
ANNUAL PROGRESS REPORT (<strong>2010</strong>/20<strong>11</strong>) 35
<strong>11</strong>) were Rs.5.78M, Rs. 247.32 M, Rs. 493.50 M, Rs 1,210.30 M, Rs. 1,875.48 M, Rs. 1,647.20 M, Rs. 2,481.5 M and 2601.28 M respectively.<br />
Total expenditure of PAF till FY <strong>2010</strong>/<strong>11</strong>is Rs. 10,561 M. Out of the total PAF expenditure of Rs. 10,561 M till FY 2067/68 (<strong>2010</strong>-<strong>11</strong>), 94.12 per cent<br />
was in Program Implementation through CO & PO (CO-77.98 per cent & PO - 16.14 per cent), 2.05 per cent in Monitoring, Training, Studies and Other<br />
Program Support, 0.55 per cent in capital investment for PAF and 3.28 per cent in PAF operation/ recurrent cost. The details are provided in Annex 16.<br />
Out of the total PAF expenditure up to FY 2067/68 (<strong>2010</strong>/<strong>11</strong>), 93.52 per cent is from IDA (International Development Agency- the World Bank) grant,<br />
2.21 per cent is from IFAD (International <strong>Fund</strong> for Agriculture Development) grant and the rest 4.26 per cent from GoN (Government of <strong>Nepal</strong>) source.<br />
chart 30: Number of Sub-projects<br />
Monitoring, Training,<br />
Studies and Other<br />
Program Support<br />
2.05%<br />
Capital Investment<br />
0.55%<br />
Operation/<br />
recurrent cost<br />
3.28%<br />
Program Implementation<br />
through CO & PO 94.12%<br />
(CO 77.98, PO 16.14)<br />
In this FY 2067/68, total expenditure is NRs. 2,60,12,83,022.25 which is 85.59 per cent of total budget of NRs.3, 039,166,000. Expenditure Trend is<br />
as follows:<br />
Table 19 : Expenditure Trend<br />
Activities<br />
FY-2067/68 Expenditure<br />
As of FY-2067/68 Expenditure (Cumulative)<br />
Amount in Nrs % Amount in Nrs %<br />
Programe Cost 2,466,199,122.73 94.81 9,941,161,835.34 94.12<br />
Operating Cost 95,107,597.62 3.66 345,925,336.61 3.28<br />
Capital Cost 369,821.20 0.01 57,877,128.90 0.55<br />
Training Workshop/Consultancy Cost 39,606,480.75 1.52 216,967,416.67 2.05<br />
Total 2,601,283,022.30 10,561,931,717.52<br />
In FY <strong>2010</strong>/<strong>11</strong> (067/068), the annual budget was estimated to be Rs. 3,039,166,000.00. Out of which 3.28 per cent was provisioned under recurrent<br />
cost and the rest 96.72 per cent was under program and capital cost. The expenditure details for FY 2067/68 is provided in Annex 17. Also, PAF<br />
unaudited financial statement and project account for the reporting <strong>year</strong> is provided in Annex 21 and 22.<br />
Currently the PAF Project II is funded by IDA Grant with US$ 100m and IFAD Grant of US$ 4m for four <strong>year</strong>s till January 2012. IDA disbursement to this<br />
PAF II project till date is 98.49 per cent (as advance) i.e. equivalent to about US$ 98.49m. IFAD disbursement to PAF till date is US$ 2.29m. The details<br />
of PAF II project achievment and expenditure status are shown in Annex 18, 19 and 20.<br />
Recently, IDA hs agred to providd additional finacing of US$ 75 M (out of which US$65 M is from IDA grant and US$ 10M grant is from FPCRTF) for<br />
PAF II project.<br />
IDA grant for PAF Project I of US$ 40 M (Initial US$ 15 M and Additional US$ 25 M) has been made utilised by January 2009.<br />
36 ANNUAL PROGRESS REPORT (<strong>2010</strong>/20<strong>11</strong>)
6.4. Disbursement to Community Organizations<br />
<strong>Fund</strong> Disbursement has to be made against contracts (sub-project agreements) with Community Organization (CO) in two or more trenches while it<br />
needs to maintain controlling mechanism based on agreed upon milestones.<br />
Table 20: Disbursement Expenditure to COs FY 2067/68 (in Million)<br />
District<br />
CO Registered<br />
w/ PAF (No.)<br />
Agreement<br />
With CO No. Amount (NRs.)<br />
Total Amount Released<br />
(NRs.)<br />
Regular 40 Districts<br />
Mountain 6<strong>11</strong> 519 590 250,915,888.41 329,754,215.74<br />
Hill 1367 <strong>11</strong>49 1309 646,462,330.02 1,127,736,555.05<br />
Terai 1066 <strong>11</strong>44 1229 705,177,294.31 630,448,194.13<br />
40 Dist. Total 3,044 2,812 3,128 1,602,555,513 2,087,938,965<br />
Innovative Programme Districts<br />
Innovative Tot. 26 20 20 6,022,585.00 9,076,643<br />
Total = 3,070 2,832 3,148 1,608,578,098 2,097,015,608<br />
Based on the community demand, several activities related to income generation and small infrastructure sub-projects are being implemented. The<br />
disbursment status in FY 2067/68 is shown in Annex 2. Untill FY <strong>2010</strong>/<strong>11</strong> (2067/68) PAF has disbursed NRs 8,266 m directly to community account.<br />
The region wise distribution of disbursement shows that the hilly region has the highest share followed by Terai and Mountain regions.<br />
6.5. Disbursement to Partner Organizations<br />
During the reporting <strong>year</strong>, altogether 370 Partner Organizations (POs) have been working with PAF to facilitate and provide necessary technical supports<br />
to the COs in the PAF districts for which PAF has disbursed Rs. 456 M. On the basis of the expenditure on PO, the hilly region has the highest share<br />
with 50.86 per cent and then Mountain and Terai regions with 14.65 per cent and 34.45 per cent respectively. Similarly the NDM programme stands for<br />
0.03 per cent of the total disbursement to POs.<br />
Table 21 : Disbursement Expenditure to POs<br />
S.N. Districts Disbursed in FY-67/68 %<br />
Disbursed as of<br />
FY-67/68 (Cumulative)<br />
%<br />
A Hill 232,431,712.30 50.86 894,418,028.48 52.47<br />
B Mountain 66,970,882.78 14.65 238,824,716.66 14.01<br />
C Terai 157,442,657.05 34.45 525,067,088.32 30.80<br />
D NDM 145,000.00 0.03 46,270,292.95 2.71<br />
Total 456,990,252.13 1,704,580,126.41<br />
6.6. Additional <strong>Fund</strong>ing<br />
The World Bank has agreed to provide 75 million US$ grant assistance package (IDA US $ 65M and FPCRTF US $ 10 M) for the Government of <strong>Nepal</strong><br />
to help meet its objectives to alleviate poverty through PAF.<br />
The additional US$ 75 million support for PAF will continue supporting these activities in more communities. It will also help improve food security in<br />
response to the drought and price fluctuations, particularly among the 3.7 million <strong>Nepal</strong>ese most vulnerable to the spiraling cost of food.<br />
6.7. Audit<br />
Internal Audit of PAF for the FY 2067/68 has been carried out by PP Pradhan and Co., Charter Accountants on a trimester basis. External Audit for the<br />
FY 2067/68 has been carried out by the Office of the Auditor General on annual basis. After completion of the contract, Community Organizations (COs)<br />
submit their Audit to PAF. Also social audit is being carried out by COs. Partner Organizations (PO) also submit audit report of their contract to PAF. Also<br />
PAF undertakes audit of POs on a sample basis. PAF has plans to undertake audit of all PO and sample CO’s of each PO.<br />
ANNUAL PROGRESS REPORT (<strong>2010</strong>/20<strong>11</strong>) 37
Chapter 7:<br />
Lessons<br />
and Future<br />
Directions<br />
This chapter discuss the the outcome of some of<br />
the major studies relating to PaAF results on the<br />
ground.<br />
7.1. Lessons<br />
PAF will work on the expansion of its programme in new VDCs and<br />
districts. However, different strategies will be taken for poorest districts<br />
and districts with greater access and livelihood opportunities. While<br />
expanding in districts with greater access and livelihood opportunities,<br />
emphasis will be given to the most deprived community.<br />
Based on lessons learned and considering the immense demand for<br />
both Income Generating and Infrastructure sub-projects effort will be<br />
given for more prudent use of available resources by giving due attention<br />
in selection of target communities and the sub-project activities. PAF's<br />
participatory project formulation and implementation management<br />
process will be reviewed so that priorities of ultra poor/ marginalized be<br />
addressed. To reduce duplication of efforts and redundancies, inclusion<br />
of PAF activities in integrated district plan and co-financing from DDC/<br />
VDC and other agencies will be highly prioritized.<br />
Community people are engaged in diversified IG activities including<br />
agriculture, livestock, manufacturing, service sector and trading.<br />
These activities need to be modernized by improving technology and<br />
by methods such as using improved animal breeds/seeds, animal<br />
health facilities and husbandry methods coupled with proper marketing<br />
planning of the produced goods. Effort will be given to synchronize<br />
these activities with community infrastructures such as irrigation, road,<br />
drinking water and marketing management.<br />
PAF's current initiative to build the Community's Capacity to Manage<br />
Revolving <strong>Fund</strong> and Operate the Sub-Projects and raise the awareness<br />
of the community through functional literacy will be further intensified.<br />
To this, social mobilization will be kept unabated. Considerable input<br />
will be given to establish COs linkages with basic health, education and<br />
youth training.<br />
Provisions for innovation and special programme will be reviewed<br />
and emphasis will be given to replicate and scale up the successful<br />
innovations. PAF will continue its efforts to explore an alternative to<br />
livestock and agriculture based activities for landless poor.<br />
As PAF is maturing, technical assistance for activities under high<br />
demand needs to be provided regularly and attention should be paid to<br />
the quality of service providers. This is an important factor in ensuring<br />
that efforts made by communities are sustained and served to bring<br />
them permanently out of poverty. A new system of PO performance<br />
evaluation with involvement of COs has been started this <strong>year</strong>, this<br />
process will be will be continued with further improvements in coming<br />
days.<br />
Efforts will be given to increase collaboration with private sector,<br />
governmental agencies, local governments and donor agencies<br />
at all level to implement the programme and sub-projects in the<br />
communities to bring marked impact in considerably less time by<br />
complementing and supplementing each other's effort. Several<br />
Memorandums of Understanding (MoUs) has already been signed with<br />
different organizations to facilitate collaboration. PAF's effort will be to<br />
materialize it in implementation to benefit the poor while exploring further<br />
collaborative efforts in the future.<br />
Increased governmental and civil society ownership in the programme<br />
will be achieved by regularizing productive workshops, reviews,<br />
coordination meetings with relevant stakeholders in both central,<br />
regional and district levels. In addition monitoring and supervision visits<br />
by central level and district governmental agencies, DDCs, VDCs, civil<br />
societies, political representatives and journalists in PAF project sites in<br />
the district will be organized regularly.<br />
Community institutionalization is taking place with the formation of CO<br />
Federations, enterprises, multi-purpose or single purpose cooperatives<br />
and VDC wise informal networks of COs as per communities' felt need.<br />
PAF will give effort in formalizing (and legalizing) these institution<br />
development process while ensuring that poor community will gain<br />
maximum benefits from these institutions. For sustaining incomegenerating<br />
activities initiated by communities, important initiatives will<br />
be taken to establish the linkage with financial institutions, market as<br />
well and the availability of Insurance Safety-Net.<br />
PAF is working with its exit strategy focusing on its strategic thrust to<br />
enable community to go to sustained path to get out of poverty within<br />
a stipulated 5-6 <strong>year</strong>s of time. In this line, PAF will work on activity<br />
based pocket area development approach by building on the potential<br />
strength of the area, linking with market and at the same time focus will<br />
be given on improvement in nutrition. PAF will also give apecial focus<br />
to upliftment of marginalised community. Moving ahead, PAF will pay<br />
increased attention to research and development, monitoring processes<br />
and outcomes, improving financial management and capacity building<br />
of CO, PO, Local Bodies and PAF.<br />
38 ANNUAL PROGRESS REPORT (<strong>2010</strong>/20<strong>11</strong>)
7.2. Challenges<br />
In view of the wide varieties of activities undertaken within the subproject,<br />
the challenges faced for sustainability of the sub-projects include<br />
the linkage with market for sustaining income-generating activities as well<br />
as the availibility of Insurance Safety-Net particularly for livestock. PAF<br />
is also to explore an alternative to livestock based activities for landless<br />
poor as the huge demand are mainly livestock related. Another important<br />
challenge before PAF is to build the Community Capacity to Manage<br />
Revolving <strong>Fund</strong> and Operate the Sub-Projects and raise the awareness<br />
of the communit through functional literactcy. Also, there is a need to<br />
adopt different approaches for poorest districts and districts with greater<br />
access and livelihood opportunities and special support to vulnernble<br />
poor, backward ethnic groups such as Mushhar, Dom, Chamar, Raute,<br />
among others.<br />
7.3. The Future strategy<br />
PAF is now working for the expansion of its programme in new VDCs and<br />
districts and important initiatives are taken for the institutionalization of<br />
Community Organizations as co-operative or other forms of higher tier<br />
institution as per their decision and link with financial institution and markets<br />
where programme is already in implementation. Also the PAF is laying<br />
special emphasis on the capacity building of community organization,<br />
partner organization and PAF while co-ordination and collaboration is<br />
being accorded high priority. This <strong>year</strong> onwards PAF is strenghening on<br />
syststmatic Grievance Handling Process with stakeholders’ views on<br />
the effective Performance Management System of COs, POs and PAF<br />
secretariat.<br />
Marginalized Community Development Programme<br />
Despite the project interventions in the poor districts, diffferent<br />
monitoring result shows that the marginalized community is still<br />
lagging behind to reap the advantage of programme. So PAF is<br />
working to remedial steps in this regard. The special focus will be<br />
made to the marginalized communities including Mushhar, Dom,<br />
Dushadh, Chamar, Khatwe, Byadha, Kusunda, Raute, Gandharva,<br />
Badi, Patharkatta, Muslims, Haliya, Deuki, Jhuma, Disabled, single<br />
women, and HIV infected people, who are deprived, backward,<br />
illiterate, socially excluded. The government of <strong>Nepal</strong> has also<br />
entrusted PAF to carry out special programme for these groups<br />
under the immediate relief programme of the fiscal <strong>year</strong> 20<strong>11</strong>/12.<br />
Under the programme, specially tailored social mobilization is being<br />
conducted This kind of training covers- plumbing, house wiring/<br />
electrification, mechanic-cycle/rickshaw/motorcycle, welding, bet/<br />
bamboo product making, candle making, driving etc. More focus<br />
is to be given to youth force of the community. This kind of skill<br />
also enables them to seek employment in different organisationsprivate,<br />
NGO, INGO etc. Special attention is given to commercialize<br />
the traditional occupation of poor through enhancing their capacity,<br />
supporting appropriate equipment/technology, and creating linkages<br />
with markets.To this effect, PAF has developed a strategy for<br />
speically focussed programme for marginalied community.<br />
Pocket Area Development Programme<br />
PAF has realized that the beauty of diversification of IGA activities<br />
is being limited to fullfill the local market demand and building<br />
confidence to initiate income generation activities for small<br />
producers. In order to commercialize particular products, linkage<br />
of external market is pre-requisite and to establish marketing<br />
chain, volume of markatable production is important.<br />
Diversification of IG activities has limited the potential of<br />
establishing necessary business services required to poor<br />
producers from public as well as private sectors. In many of COs,<br />
activity based areas have emerged in different clusters. But POs<br />
are not clear to link those activities of cluster with market, and<br />
for their institutionalization. It has, heneceforth, been inevitable to<br />
encourage POs to link activity based areas of cluster with markets<br />
and sustain them. To this effect, PAF has develpved a strategy on<br />
activity based pocket area development.<br />
ANNUAL PROGRESS REPORT (<strong>2010</strong>/20<strong>11</strong>) 39
Annex 1<br />
Current Board of Governors (as of January 2012)<br />
Chairperson<br />
Rt. Hon. Dr Babu Ram Bhattarai<br />
Prime Minister<br />
Vice Chairperson<br />
Member<br />
Member<br />
Member<br />
Member<br />
Member<br />
Member<br />
Member<br />
Member<br />
Member<br />
Member<br />
Secretary PAF Board<br />
Mr. Janak Raj Joshi<br />
Mr. Yuba Raj Bhusal<br />
Secretary, National Planning Commission<br />
Mr. Rishi Raj Lumsaili<br />
Chairperson, Association of District Development<br />
Committees of <strong>Nepal</strong><br />
Ms. Mahin Limbu<br />
Chairperson, Association of Village Development<br />
Committees of <strong>Nepal</strong><br />
Ms. Chand Tara Kumari<br />
Chairperson, National Women Commission<br />
Ms. Sushila Shirpali Thakuri<br />
Chairperson , National Dalit Commission<br />
Mr. Akhileshwor Lal Das<br />
Mr. Basanta Bahadur Telar<br />
Ms. Durga Neupane(Bhattarai)<br />
Dr. Kal Bahadur Rokaya<br />
Ms. Kamala Rai<br />
Mr. Raj Babu Shrestha<br />
Ex-Board Members who served during the reporting <strong>year</strong> (FY <strong>2010</strong>-<strong>11</strong>)<br />
Vice Chairperson<br />
Member<br />
Member<br />
Member<br />
Member<br />
Member<br />
Member<br />
Member<br />
Member<br />
Mr. Vidyadhar Mallik<br />
Mr. Bijul Kumar Bishwokarma<br />
National Dalit Commission<br />
Mrs. Nainkala Thapa<br />
National Women Commission<br />
Dr. Bal Gopal Baidya<br />
Dr. Arju Rana<br />
Mr. Shree Krishna Upadyaya<br />
Mr. Khalil Miya<br />
Dr. Duman Thapa<br />
Mr. Yub Raj Panday, National Planning Commission<br />
40 ANNUAL PROGRESS REPORT (<strong>2010</strong>/20<strong>11</strong>)
ANNEX 2<br />
CO registration, agreement for sub-project and disbursement status (<strong>Fiscal</strong> <strong>year</strong> <strong>2010</strong>/<strong>11</strong> only)<br />
District<br />
CO Registered w/ PAF<br />
(No.)<br />
Agreement<br />
With CO No. Amount (NRs.)<br />
Total Amount Released<br />
(NRs.)<br />
Hill<br />
Darchula 1 27 33,347,0<strong>11</strong> 136,413,197<br />
Pyuthan 20 123 140 60,549,806 104,715,<strong>11</strong>6<br />
Ramechhap 37 63 76 32,077,662 104,468,820<br />
Achham 106 127 133 <strong>11</strong>3,543,057 94,575,856<br />
Baitadi 85 89 100 53,321,530 79,077,301<br />
Bajhang 139 68 81 51,698,628 59,497,890<br />
Bajura 5 6 <strong>11</strong> 10,154,210 36,877,853<br />
Dadeldhura 4 15 14,461,725 53,448,505<br />
Dailekh 38 38 42 15,780,170 45,589,367<br />
Doti 55 47 50 13,8<strong>11</strong>,869 39,126,806<br />
Jajarkot 1 2 5 6,910,459 51,733,649<br />
Kalikot 48 49 64 43,588,367 72,892,250<br />
Rolpa 77 77 81 24,168,491 20,347,084<br />
Rukum 54 38 43 28,047,520 58,910,<strong>11</strong>1<br />
Sindhuli 24 18 31 20,004,742 59,210,463<br />
Dhading 85 78 83 22,753,216 23,021,790<br />
Khotang 156 57 58 28,218,602 23,601,350<br />
Panchthar 210 54 54 15,426,859 13,312,733<br />
Salyan 122 123 123 24,762,179 22,476,322<br />
Terhathum 59 45 49 12,639,626 10,704,780<br />
Udayapur 46 42 43 21,196,601 17,735,314<br />
Lalitpur 150,000<br />
Makwanpur 1,687,397<br />
Hill Total 1,367 1,149 1,309 646,462,330 1,129,573,952<br />
Mountain<br />
Mugu 22 25 70 30,901,407 36,262,930<br />
Dolpa 43 43 45 33,252,207 33,522,362<br />
Humla 14 15,470,378 20,324,553<br />
Jumla 9 10 16 20,806,146 104,987,283<br />
Rasuwa 16 7 7 4,619,700 24,322,713<br />
Okhaldhunga 87 87 87 17,633,125 14,068,378<br />
Sindhupalchok 186 125 125 37,293,255 28,417,906<br />
Solukhumbu 38 55 55 16,810,992 10,582,433<br />
Taplejung 210 167 171 74,128,678 57,265,658<br />
Mountain Total 6<strong>11</strong> 519 590 250,915,888 329,754,216<br />
Terai<br />
Kapilbastu 78 79 82 55,031,783 66,731,6<strong>11</strong><br />
Siraha 36 35 35 12,425,808 74,908,444<br />
Mahottari 32 32 47 25,630,014 56,236,030<br />
Rautahat 438 399 421 303,136,958 219,526,666<br />
Sarlahi <strong>11</strong>2 147 81,020,501 51,090,133<br />
ANNUAL PROGRESS REPORT (<strong>2010</strong>/20<strong>11</strong>) 41
District<br />
CO Registered w/ PAF<br />
(No.)<br />
Agreement<br />
With CO No. Amount (NRs.)<br />
Total Amount Released<br />
(NRs.)<br />
Bara 79 106 106 36,129,445 26,044,376<br />
Bardiya 102 99 104 29,897,633 21,806,988<br />
Dhanusha 130 131 131 85,443,827 56,682,928<br />
Parsa 73 68 73 40,233,064 36,162,094<br />
Saptari 98 83 83 36,228,262 21,258,923<br />
Chitawan 7 7 7 1,048,535 2,449,546<br />
Kanchanpur 19 13 13 4,974,050 4,789,700<br />
Terai Total 1,092 1,164 1,249 7<strong>11</strong>,199,879 637,687,440<br />
Total 3,070 2,832 3,148 1,608,578,098 2,097,015,608<br />
Annex 3<br />
CO registration, agreement for sub-project and disbursement status (Cumulative)<br />
District<br />
CO Registered w/ PAF<br />
(No.)<br />
Agreement<br />
With CO No. Amount (NRs.)<br />
Total Amount Released<br />
(NRs.)<br />
% Released<br />
Hill<br />
Darchula 885 866 1,236 579,210,992 547,637,756 95%<br />
Pyuthan 1,127 1,095 1,267 610,175,203 602,972,908 99%<br />
Ramechhap 1,189 1,157 1,294 5<strong>11</strong>,880,353 500,476,747 98%<br />
Achham 595 587 671 397,<strong>11</strong>0,801 330,930,339 83%<br />
Baitadi 668 532 635 3<strong>11</strong>,802,657 286,536,441 92%<br />
Bajhang 452 365 468 243,676,055 205,623,986 84%<br />
Bajura 401 389 455 264,005,047 258,648,919 98%<br />
Dadeldhura 378 373 421 224,007,734 217,055,319 97%<br />
Dailekh 418 418 434 231,766,778 228,376,189 99%<br />
Doti 473 455 479 225,833,718 224,300,4<strong>11</strong> 99%<br />
Jajarkot 360 295 316 227,044,139 179,950,720 79%<br />
Kalikot 602 556 588 300,837,093 253,989,378 84%<br />
Rolpa 175 175 179 71,902,3<strong>11</strong> 63,244,004 88%<br />
Rukum 334 258 272 142,039,582 122,776,067 86%<br />
Sindhuli 800 789 955 492,041,451 480,225,059 98%<br />
Dhading 101 94 105 36,449,547 31,235,597 86%<br />
Khotang 156 57 58 28,218,602 23,601,350 84%<br />
Panchthar 210 54 54 15,426,859 13,312,733 86%<br />
Salyan 137 129 132 32,090,489 27,293,082 85%<br />
Terhathum 59 45 49 12,973,738 10,704,780 83%<br />
Udayapur 46 42 43 21,196,601 17,735,314 84%<br />
Baglung 1 1 1 722,165 722,165 100%<br />
Dhading 81 81 98 40,283,561 39,807,021 99%<br />
Kavrepalan 1 1 1 1,735,037 1,735,037 100%<br />
Lalitpur 2 2 2 6,784,220 6,784,224 100%<br />
Makwanpur <strong>11</strong>1 98 105 41,947,304 39,437,593 94%<br />
42 ANNUAL PROGRESS REPORT (<strong>2010</strong>/20<strong>11</strong>)
District<br />
CO Registered w/ PAF<br />
(No.)<br />
Agreement<br />
With CO No. Amount (NRs.)<br />
Total Amount Released<br />
(NRs.)<br />
% Released<br />
Surkhet 1 1 1 3,015,982 3,015,982 100%<br />
Hill Total 9,763 8,915 10,319 5,074,178,018 4,718,129,121 93%<br />
Mountain<br />
Mugu 266 244 380 152,853,467 142,775,656 93%<br />
Dolpa 208 208 213 128,977,487 124,410,036 96%<br />
Humla 329 329 375 179,096,005 178,669,096 100%<br />
Jumla 474 472 509 394,425,975 366,584,097 93%<br />
Rasuwa 274 262 272 125,574,086 <strong>11</strong>2,415,380 90%<br />
Okhaldhunga 87 87 87 17,633,125 14,068,378 80%<br />
Sindhupalch 186 125 125 37,293,255 28,417,906 76%<br />
Solukhumb 60 55 55 16,810,992 10,582,433 63%<br />
Taplejung 210 167 171 74,128,678 57,265,658 77%<br />
Mountain Total 2,094 1,949 2,187 1,126,793,072 1,035,188,640 92%<br />
Terai<br />
Kapilbastu 905 887 931 524,501,2<strong>11</strong> 485,052,370 92%<br />
Siraha 1,328 1,319 1,341 515,923,195 488,315,873 95%<br />
Mahottari 578 565 585 254,732,973 226,302,083 89%<br />
Rautahat 1,449 1,343 1,402 835,659,348 620,826,328 74%<br />
Sarlahi 912 1,024 1,059 479,960,630 420,834,668 88%<br />
Bara 120 106 106 36,129,445 26,044,376 72%<br />
Bardiya 102 99 104 29,897,633 21,806,988 73%<br />
Dhanusha 130 131 131 85,443,827 56,682,928 66%<br />
Parsa 151 141 146 73,048,478 54,513,655 75%<br />
Saptari 98 83 83 36,228,262 21,476,717 59%<br />
Chitawan 47 47 74 18,031,856 17,617,264 98%<br />
Kanchanpur 141 132 132 43,065,392 40,099,342 93%<br />
Morang 79 77 77 48,165,610 32,087,755 67%<br />
Nawalparasi 1 1 1 1,551,248 1,551,248 100%<br />
Terai Total 6,041 5,955 6,172 2,982,339,107 2,513,2<strong>11</strong>,595 84%<br />
Total 17,898 16,819 18,678 9,183,310,197 8,266,529,356 90%<br />
Annex 4<br />
POs, COs and Coverage (<strong>Fiscal</strong> <strong>year</strong> <strong>2010</strong>/<strong>11</strong> only)<br />
District<br />
No. of Working<br />
Pos<br />
Total VDC +<br />
Municipality in<br />
District<br />
PO Committed<br />
No. of VDC<br />
CO Working<br />
VDC<br />
Sub Proj. No.<br />
IG Infra CO Member HH<br />
Beneficiary HH<br />
Total Beneficiary<br />
HH<br />
Hill<br />
Darchula 10 41 41 41 7 20 294<br />
Pyuthan 12 49 50 49 129 <strong>11</strong> 465 4320<br />
Ramechhap 9 55 55 55 63 13 841 1427<br />
Achham 16 75 67 64 130 3 3456 4524<br />
Baitadi 14 63 63 62 90 10 1935 2494<br />
Bajhang 10 47 47 45 63 18 1859 1483<br />
ANNUAL PROGRESS REPORT (<strong>2010</strong>/20<strong>11</strong>) 43
District<br />
No. of Working<br />
Pos<br />
Total VDC +<br />
Municipality in<br />
District<br />
PO Committed<br />
No. of VDC<br />
CO Working<br />
VDC<br />
Sub Proj. No.<br />
IG Infra CO Member HH<br />
Beneficiary HH<br />
Total Beneficiary<br />
HH<br />
Bajura 4 27 27 27 6 5 138 244<br />
Dadeldhura 8 21 21 21 2 13 277<br />
Dailekh 5 56 25 25 38 4 <strong>11</strong>73 1267<br />
Doti 5 51 36 34 47 3 1267 1406<br />
Jajarkot 8 30 26 26 2 3 51 229<br />
Kalikot 6 30 30 30 49 15 1370 2152<br />
Rolpa 5 51 22 22 77 4 2166 1422<br />
Rukum 10 43 33 33 33 10 942 1354<br />
Sindhuli 10 54 54 38 18 13 462 896<br />
Dhading 8 50 20 19 75 8 1971 1056<br />
Khotang 7 76 38 30 50 8 1655 2949<br />
Panchthar 7 41 21 21 54 1443 746<br />
Salyan 6 47 27 27 123 3376 1797<br />
Terhathum 4 32 16 16 35 14 1237 762<br />
Udayapur 10 45 23 23 34 9 <strong>11</strong>09 1695<br />
Baglung 0 60 0 1<br />
Dhading 1 50 6 6<br />
Kavrepalanchok 1 90 1 1<br />
Lalitpur 2 42 4 2<br />
Surkhet 0 48 0 1<br />
Hill Total 178 1,274 753 719 1,125 184 26,916 32,794<br />
Mountain<br />
Mugu 6 24 24 24 51 19 299 1308<br />
Dolpa 3 23 23 23 43 2 1236 1297<br />
Humla 5 27 27 27 14 178<br />
Jumla 7 30 30 30 <strong>11</strong> 5 336 419<br />
Rasuwa 6 18 18 16 7 221 206<br />
Okhaldhunga 7 56 28 28 87 2244 1330<br />
Sindhupalchok <strong>11</strong> 79 33 33 125 3318 1969<br />
Solukhumbu 3 34 14 14 55 865 1073<br />
Taplejung 9 50 41 40 167 4 3341 3363<br />
Mountain Total 57 341 238 235 546 44 <strong>11</strong>,860 <strong>11</strong>,143<br />
Terai<br />
Kapilbastu 15 78 78 71 60 22 1875 1839<br />
Siraha 17 108 108 88 35 756 756<br />
Mahottari 12 77 46 46 42 5 862 1020<br />
Rautahat 9 97 97 74 395 26 9576 12785<br />
Sarlahi 16 100 67 67 <strong>11</strong>2 35 957<br />
Bara 13 99 46 45 106 2106 2177<br />
Bardiya 6 32 18 15 99 5 2540 1787<br />
Dhanusha 14 102 51 51 131 3519 3698<br />
Parsa <strong>11</strong> 83 48 48 56 17 1900 1765<br />
Saptari 15 <strong>11</strong>5 48 48 83 2345 4303<br />
Chitawan 1 38 7 7 7 195 3<strong>11</strong><br />
44 ANNUAL PROGRESS REPORT (<strong>2010</strong>/20<strong>11</strong>)
District<br />
No. of Working<br />
Pos<br />
Total VDC +<br />
Municipality in<br />
District<br />
PO Committed<br />
No. of VDC<br />
CO Working<br />
VDC<br />
Sub Proj. No.<br />
IG Infra CO Member HH<br />
Beneficiary HH<br />
Total Beneficiary<br />
HH<br />
Kanchanpur 1 20 20 8 13 308 294<br />
Makwanpur 2 44 18 18<br />
Morang 3 65 4 3<br />
Nawalparasi 0 74 0 1<br />
Terai Total 135 1,132 656 590 1,139 <strong>11</strong>0 25,982 31,692<br />
Total 370 2,747 1,647 1,544 2,810 338 64,758 75,629<br />
Annex 5<br />
POs, COs and Coverage (cumulative to date)<br />
District<br />
No. of Working<br />
Pos<br />
Total VDC +<br />
Municipality in<br />
District<br />
PO Committed No.<br />
of VDC<br />
CO Working<br />
VDC<br />
Sub Proj. No.<br />
Sub Proj. No.<br />
IG Infra CO Member HH<br />
Total Beneficiary<br />
HH<br />
Hill<br />
Darchula 10 41 41 41 851 393 17,828 28,734<br />
Pyuthan 12 49 50 49 1018 258 31,324 35,490<br />
Ramechhap 9 55 55 55 <strong>11</strong>39 190 27,873 30,679<br />
Achham 16 75 67 64 609 62 19,331 21,928<br />
Baitadi 14 63 63 62 526 109 17,272 20,262<br />
Bajhang 10 47 47 45 297 171 9,246 19,394<br />
Bajura 4 27 27 27 389 66 <strong>11</strong>,826 14,564<br />
Dadeldhura 8 21 21 21 371 50 <strong>11</strong>,033 <strong>11</strong>,613<br />
Dailekh 5 56 25 25 418 16 14,990 15,181<br />
Doti 5 51 36 34 455 24 14,776 14,972<br />
Jajarkot 8 30 26 26 293 23 10,760 15,971<br />
Kalikot 6 30 30 30 556 32 16,239 17,226<br />
Rolpa 5 51 22 22 175 4 5,094 4,341<br />
Rukum 10 43 33 33 242 30 7,849 8,403<br />
Sindhuli 10 54 54 38 792 163 24,533 28,692<br />
Dhading 8 50 20 19 91 14 2,418 1,547<br />
Khotang 7 76 38 30 50 8 1,655 2,949<br />
Panchthar 7 41 21 21 54 1,443 746<br />
Salyan 6 47 27 27 128 4 3,594 1,973<br />
Terhathum 4 32 16 16 35 14 1,237 762<br />
Udayapur 10 45 23 23 34 9 1,109 1,695<br />
Baglung 0 60 0 1 1 13 142<br />
Dhading 1 50 6 6 81 17 2,394 2,887<br />
Kavrepalanchok 1 90 1 1 1 1 <strong>11</strong> 125<br />
Lalitpur 2 42 4 2 2 416 516<br />
Surkhet 0 48 0 1 1 9 655<br />
Hill Total 178 1,274 753 719 8,605 1,662 254,273 301,447<br />
ANNUAL PROGRESS REPORT (<strong>2010</strong>/20<strong>11</strong>) 45
District<br />
No. of Working<br />
Pos<br />
Total VDC +<br />
Municipality in<br />
District<br />
PO Committed No.<br />
of VDC<br />
CO Working<br />
VDC<br />
Sub Proj. No.<br />
Sub Proj. No.<br />
IG Infra CO Member HH<br />
Total Beneficiary<br />
HH<br />
Mountain<br />
Mugu 6 24 24 24 275 121 7,094 12,385<br />
Dolpa 3 23 23 23 208 5 6,178 6,264<br />
Humla 5 27 27 27 331 44 7,860 8,579<br />
Jumla 7 30 30 30 481 91 16,958 17,898<br />
Rasuwa 6 18 18 16 261 12 7,730 8,450<br />
Okhaldhunga 7 56 28 28 87 2,244 1,330<br />
Sindhupalchok <strong>11</strong> 79 33 33 125 3,318 1,969<br />
Solukhumbu 3 34 14 14 55 1,378 1,073<br />
Taplejung 9 50 41 40 167 4 3,341 3,363<br />
Mountain Total 57 341 238 235 1,990 277 56,101 61,3<strong>11</strong><br />
Terai<br />
Kapilbastu 15 78 78 71 862 440 24,539 34,902<br />
Siraha 17 108 108 88 1302 257 31,365 32,619<br />
Mahottari 12 77 46 46 580 5 14,302 14,312<br />
Rautahat 9 97 97 71 1338 228 36,760 44,964<br />
Sarlahi 16 100 67 67 1024 35 26,462 27,292<br />
Bara 13 99 46 45 106 3,<strong>11</strong>6 2,177<br />
Bardiya 6 32 18 15 99 5 2,540 1,787<br />
Dhanusha 14 102 51 51 131 3,519 3,698<br />
Parsa <strong>11</strong> 83 48 48 129 17 4,166 3,892<br />
Saptari 15 <strong>11</strong>5 48 51 83 2,345 4,303<br />
Chitawan 1 38 7 7 52 28 1,229 2,055<br />
Kanchanpur 1 20 20 8 132 3,049 3,079<br />
Makwanpur 2 44 18 18 66 39 3,154 3,130<br />
Morang 3 65 4 3 77 45 3,090 3,099<br />
Nawalparasi 0 74 0 1 1 <strong>11</strong> 705<br />
Terai Total 135 1,132 656 590 5,981 1,100 159,647 182,014<br />
Total 370 2,747 1,647 1,544 16,576 3,039 470,021 544,772<br />
Innovative Programme Districts<br />
NDM-2005 12 25 25 10 2 8,999<br />
NDM-2008 25 52 52 17 8 5,228<br />
NDM Total 37 0 77 77 27 10 0 14,227<br />
Total 407 2,747 1,724 1,621 16,603 3,049 470,021 558,999<br />
46 ANNUAL PROGRESS REPORT (<strong>2010</strong>/20<strong>11</strong>)
Annex 6<br />
PAF in Terai Border VDCs<br />
Terai Border VDC<br />
District Total VDC PAF Coverage VDC CO Registration Nos CO Agreement Nos<br />
CO Member<br />
Beneficiary HH<br />
Total PAF Agreement<br />
Amount (Rs.)<br />
IG No. IG Amount INFRA No. INFRA Amount<br />
Bara 16 15 14,468,370 40 14,468,370 0<br />
Bardiya 9 4 18 18 453 3,860,966 18 3,860,966 0<br />
Chitawan 4 1 5 5 145 1,530,197 5 1,530,197 0<br />
Dhanusha 13 4 10 10 279 7,044,580 10 7,044,580 0<br />
Kanchanpur 8 1 4 4 85 1,226,300 4 1,226,300 0<br />
Kapilbastu 18 18 186 175 5132 121,770,446 163 70,207,763 93 51,562,684<br />
Mahottari 7 5 74 74 1557 28,429,663 74 28,429,663 0<br />
Parsa 20 <strong>11</strong> 37 36 <strong>11</strong>16 18,001,080 34 15,249,300 3 2,751,780<br />
Rautahat 6 6 166 157 4790 97,197,882 158 93,655,177 7 3,542,705<br />
Saptari 16 7 13 12 371 5,169,215 12 5,169,215 0<br />
Sarlahi 15 15 95 99 2607 48,185,477 99 48,003,643 1 181,834<br />
Siraha 14 8 93 92 2159 35,555,803 92 33,329,382 3 2,226,421<br />
Total 146 95 745 722 20,015 382,439,980 709 322,174,556 107 60,265,424<br />
100% 65% 100% 84% 16%<br />
Annex 7<br />
PAF in Karnali<br />
Karnali Households (HH) Karnali Households (HH)<br />
District No. Of PO Total VDC PAF Coverage VDC CO Registration Nos CO Agreement Nos Total HH Poor HH CO Member Beneficiary HH<br />
Total HH Poor HH CO Member Beneficiary<br />
HH<br />
Dolpa 3 23 23 5,816 2,309 6,178 128,977,487.42<br />
Humla 5 27 27 329 329 6,951 2,885 7,860 179,096,005.41<br />
Jumla 7 30 30 474 472 15,856 5,454 16,958 394,425,975.39<br />
Kalikot 6 30 30 602 556 18,490 10,503 16,239 300,837,093.05<br />
Mugu 6 24 24 266 244 8,259 4,212 7,094 152,853,467.00<br />
Total 27 134 134 1879 1809 55,372 25,363 54,329 1,156,190,028.27<br />
100% 100% 96% 100% 98%<br />
ANNUAL PROGRESS REPORT (<strong>2010</strong>/20<strong>11</strong>) 47
District<br />
Total PAF Agreement<br />
Amount (Rs.)<br />
IG No. IG Agreement Amount (Rs.) Infra No.<br />
Infrastructure Agreement<br />
Amount (Rs.)<br />
Dolpa 128,977,487.42 208 <strong>11</strong>4,401,794.00 5 14,575,693.42<br />
Humla 179,096,005.41 331 141,038,444.00 44 38,057,561.41<br />
Jumla 394,425,975.39 481 346,684,533.00 91 47,741,442.39<br />
Kalikot 300,837,093.05 556 270,852,781.20 32 29,984,3<strong>11</strong>.85<br />
Mugu 152,853,467.00 275 80,867,724.00 121 71,985,743.00<br />
Total 1,156,190,028.27 1,851 953,845,276.20 293 202,344,752.07<br />
100% 82% 18%<br />
Annex 8<br />
Community Institutional Development<br />
List of CO Federations in Districts<br />
S.N.<br />
District<br />
No of CO<br />
Federation<br />
Specific Objectives/Activities<br />
Accham 18 Five federations have been formed for Pasu Bima Programme, 2 for ICT (Information and communication<br />
technologies) at Bayalpata, 2 for construction of micro hydro sub projects, 5 for school buildings and 4 for<br />
solar school systems at various VDCs.<br />
1 Bajhang 1 Seven COs from Hemantawada and Luyata VDC have been federated to run a Seti Saipal V-SAT Center at<br />
Chainpur to promote capacity building, entrepreneurs' skill and knowledge at local level.<br />
2 Bajura 13 13 federations have been formed for following activities in Bajura<br />
• 9 federations for School building construction<br />
• 2 federations for water supply project<br />
• 2 federations for Micro Hydro project<br />
Dadeldhura 16 16 Federations have been made for the following activities;<br />
• 9 federations for School building construction in 7 VDCs i.e. Jogbudha, Shirsha, Shirsha, Bhadrapur,<br />
Alital, Bhageshwor, Koteli and Manileka.<br />
• 5 Federations for Drinking Water Supply Scheme in 5 VDCs i.e. Ghankhet, Bhadrapur, Mastamandu and<br />
Nvadurga.<br />
• 2 Federations for suspended bridge projects in 2 VDCs i.e. Ajaimeru and Navadurga.<br />
2 Darchula 14 <strong>11</strong> CO federations have been formed to implement micro hydro sub project and three CO federations to<br />
implement electric line extension schemes at various VDCs.<br />
3 Doti 10 10 Federations have been made for the following activities;<br />
• 4 federations for School building construction in 4 VDCs named Pokhari, Ganjari, Gairagaun, Basudevi.<br />
• 3 Federations for Drinking Water Supply Scheme in 3 VDCs named Bhumirajmandau, Daud and Toleni.<br />
• 2 Federations for micro hydro projects in 2 VDCs named Daud and Toleni.<br />
• 1 Federation for constructing a health post building in Ranagaun VDC.<br />
• Formed 29 COs networking in 29 VDCs for practicing their higher level organization.<br />
• Established a cooperative in Toleni VDC for running & maintaining a micro-hydro projects involving 3<br />
COs.<br />
4 Kalikot 2 Two CO federations have been formed to implement a micro hydro sub project at Phoi mahadev VDC and a<br />
pico hydro sub project at Chilkhaya VDC for rural electrification.<br />
5 Kapilvastu 1 357 buffalo raising farmers of 5 VDCs namely Ganeshpur, Biddhyanagar, Bhagamanpur, Sirshihawa and<br />
Ramnagar have been federated and formed Shivam Dugdha Utpadak CO for collecting milk and operating<br />
chilling centre and cattle insurance scheme for members.<br />
6 Mugu 3 Two federated COs have been formed for constructing and operating micro hydro scheme for rural<br />
electrification and one for micro irrigation.<br />
7 Pyuthan 44 41 CO federations has been formed for implementation of different infrastructure sub projects like link road,<br />
drinking water, irrigation, micro hydro, school building in various VDCs.<br />
Two CO federations have been formed to operate community livestock Insurance program in Tusara and<br />
Bangesal VDC.<br />
One CO federation has been formed for the establishment of Vegetable Collection Centre at Lung VDC.<br />
8 Rautahat 9 9 CO federations have been formed in 9 VDCs for livestock management and insurance policy<br />
9 Sindhuli 12 To implement infrastructure schemes like rural road, irrigation, drinking water, mechanized bridge etc.<br />
10 Siraha 9 One federated CO for operating a chilling centre at Bishnupurkalti VDC and another one to run breeding centre<br />
at Dhodhana and Bhadaiya VDC<br />
Five CO federations have been formed to construct culverts in various VDCs<br />
Two CO federations have been formed in Mukshar VDC to construct to construct Agriculture roads<br />
<strong>11</strong> Rukum 5 4 Water Users group and 1 school users group<br />
48 ANNUAL PROGRESS REPORT (<strong>2010</strong>/20<strong>11</strong>)
S.N.<br />
District<br />
No of CO<br />
Federation<br />
Specific Objectives/Activities<br />
12 Dailekh 9 One federation for Drinking Water Supply Project and 8 Federation for School Building Project.<br />
13 Ramechhap 9 For Micro-Hydro, Irrigation and Community Building projects<br />
List of Cooperatives formed through CO’s initiatives in Districts<br />
S.N. District No of Cooperatives Specific Objectives/Activities<br />
1 Accham 35 To manage all COs within the VDC.<br />
2 Darchula 9 Six cooperatives have been established in 6 VDCs to provide saving and credit services to CO members<br />
Three cooperatives established to provide electricity extension and distribution service by leasing<br />
agreement with NEA.<br />
3 Kapilvastu 1 A multipurpose cooperative has been established to run agro vet service and milk collection & marketing<br />
center<br />
Total 19 Cooperatives has been established till date<br />
4 Mugu 1 Rara Bahuudesiya cooperative has been established with the joint efforts of <strong>11</strong> COs of three VDCs namely<br />
Pina, Karkiwada and Shreenagar to provide agro-vet services to its members, to establish hatchery and<br />
make available chicks in district for its members To run dairy at district headquarter collecting milk from<br />
its members.<br />
5 Pyuthan 2 Two cooperatives have been established at Arkha and Rajbara VDC to manage revolving fund & saving<br />
credit fund, provide micro finance services to its members and for institutional development and<br />
sustainability of CO efforts.<br />
6 Rautahat 2 A cooperative has been formed in Bishanpurwar Manpur VDC to establish and operate milk chilling center<br />
for marketing milk products produced by the members.<br />
A cooperative has been established at Santapur Dostiya VDC to provide saving and credit service for<br />
agricultural and livestock management<br />
7<br />
8<br />
Siraha<br />
Chitwan<br />
1<br />
1<br />
Three COs in Muskar VDC are in process to register Cooperative to run saving credit and provide technical<br />
services to its member<br />
Eight different COs in Khaireni VDC have teamed up to form a muti-purpose cooperative. 90 per cent of<br />
the cooperatives members are women. They are carrying cooperative farming in lease-land, marketing of<br />
vegetable products and saving credits, among others.<br />
9 Makwanpur 1 One Cooperative ( Basamadi Agriculture Chepang Cooperative Org.) has been formed with collaborative<br />
efforts of 3 Community Organizations at Basamadi VDC.<br />
Annex 9<br />
Status of the On-going Innovative Sub-projects<br />
S.N. Name of the POs and its address Innovative Concept Working areas Remarks<br />
1. Multipurpose Development Management<br />
Services, (MDMS) <strong>Nepal</strong>, Morang<br />
Breed Improvement of Goat and Pig Seed<br />
Improvement in Vegetable Production<br />
2. Mahila Byabasayik Krishi Samuha, Morang Organic fertilizer production for Community<br />
Livelihood Improvement.<br />
3. Manohari Development Institute, (MDI),<br />
Makawanpur<br />
Integrating Livelihood of Tribal People<br />
(Chepang and Tamang people) through<br />
Agro-Forestry livelihood improvement,<br />
Small Infrastructures like rural road and<br />
plastic pond<br />
4. Focus <strong>Nepal</strong>, Dhading Social Mobilization for Local Resource<br />
Management and Enterprise Development<br />
for Deprived Groups Chepang Community<br />
5. Made <strong>Nepal</strong> Vegetable cultivation in lease land for<br />
<strong>Poverty</strong> Reduction<br />
Sisbani Badahare VDC<br />
Tankisunawari and Baijanath<br />
VDC<br />
Ongoing<br />
Ongoing<br />
Ongoing<br />
6 VDCs of Dhading The same VDCs are covered<br />
through regular programme<br />
since last <strong>year</strong> and the same<br />
PO is facilitating.<br />
5 VDCs of Chitwan District Ongoing<br />
6. NNWA, Kanchanpur Livelihood Improvement 9 VDCs and 1 Municipality Ongoing<br />
7 <strong>Nepal</strong> Water Conservation Foundation Facilitation support to social mobilization for Lalitpur<br />
Completed<br />
Lalitpur<br />
ropeway construction Bhattedanda<br />
8 Madan Bhandari Memorial Academy,<br />
Urlabari, Morang<br />
Education Loan Program for Vocational<br />
Training for Deprived Education<br />
Selected students from<br />
Siraha, Mahottari, Sindhuli,<br />
Rauthahat, Ramechap,<br />
Rasuwa, Sarlahi, Jhapa,<br />
Morang Districts<br />
Ongoing<br />
ANNUAL PROGRESS REPORT (<strong>2010</strong>/20<strong>11</strong>) 49
Annex 10<br />
Various trainings to the members of COs by districts<br />
S.N.<br />
Description of Training, Orientation<br />
& Exposures<br />
No. of<br />
Event<br />
No. of COs<br />
Participate<br />
Gender & Ethnicity Wise No. of Participants<br />
Male Female Dalit Janajati Muslim Others Total<br />
Remarks<br />
1 Training on Leadership and group<br />
Management<br />
226 1996 1698 3409 1558 689 <strong>11</strong>0 2751 5078 Baitadi, Mugu, Bhajang, Rukum, Jumla, Bardiya, Parsa,<br />
Rautahat, Sindhuli, Solokhumbu<br />
2 Training on Enterprise<br />
Development/SIYB (TOPE &<br />
TOSE)<br />
77 900 370 <strong>11</strong>89 790 397 97 285 1559 Rukum, Sindhupalchwok, Parsa, Udayapur, Mahottari<br />
3 Orientation on Demand Led<br />
Proposal Preparation<br />
9 202 76 126 64 127 0 <strong>11</strong> 202 Sindhupalchwok<br />
4 Training on Account Management 238 2716 2045 3869 2016 1574 137 2149 5876 Baitadi, Mugu, Bhajang, Rolpa, Bardiya, Kapilbastu,<br />
Rautahat, Sarlahi, Parsa,Bara, Siraha, Saptari, Sindhuli,<br />
Sindhupalchwok,Khotang, Solokhumbu,<br />
5 Refresher Training on Account<br />
management<br />
42 408 317 296 123 163 0 327 613 Rukum, Jumla, Terthathum<br />
6 Training on Revolving <strong>Fund</strong> &<br />
Saving-Credit Management<br />
233 942 1732 4462 1985 3277 140 1792 6194 Baitadi, Jumla, Rolpa, Humla Bardiya, Kapilbastu,<br />
Rasuwa, Bara, Rautahat, Khotang, Okhaldhunga,<br />
Terthathum, Udayapur, Siraha<br />
7 Training on Institutional Building<br />
and Cooperative Mgmt.<br />
53 274 198 677 350 195 13 317 875 Darchula, Doti, Rasuwa, Parsa, Rautahat, Sindhuli,<br />
Udayapur<br />
8 Training on Business Management 6 6 0 21 21 0 0 0 21 Parsa<br />
9 Training on Community Based<br />
Livestock Insurance System<br />
16 214 186 188 70 176 0 128 374 Sindhuli, Jumla<br />
10 Training on Animal Husbandry<br />
(Buffalo, Cow, Goat, Pig)<br />
521 1873 4685 9413 3577 3012 461 7028 14098 Parsa, Bara,Sindhuli, Udayapur, Mahottari,<br />
Sindhupalchwok, Solokhumbu, Okhaldhunga,<br />
Terthathum, Doti, Dailekh,Jumla,Bhajang, Kalikot, Mugu<br />
<strong>11</strong> Training on Vegetable Farming 16 54 105 299 70 34 0 300 404 Mugu, Dailekh, Sindhupalchwok, Sindhuli<br />
12 Training on Poultry Farming 37 31 40 27 18 0 26 71 4 Sindhuli, sindhupalchwok, Jumla<br />
13 Training on Ginger Farming 10 33 73 147 50 131 0 39 220 Terthathum, Sindhuli<br />
14 Training on System of Rice<br />
Intensification (SRI)<br />
1 8 <strong>11</strong> 12 7 16 23 Kalikot<br />
15 Training on IPM Mgmt. 4 4 0 82 42 0 0 40 82 Bhajang<br />
16 Training on Bee Keeping 1 10 12 6 4 7 0 7 18 Sindhuli<br />
17 Training on Dairy Development 1 21 18 7 4 6 0 15 25 Sindhuli<br />
18 Training on Livelihood Mgmt. 8 6 20 33 25 0 0 28 53 Mugu<br />
19 Training for Village Level Animal<br />
Health Workers<br />
4 4 4 Rautahat<br />
20 Training on Gothemal & Compost<br />
Mal Mgmt.<br />
1 1 10 5 0 15 0 0 15 Khotang<br />
50 ANNUAL PROGRESS REPORT (<strong>2010</strong>/20<strong>11</strong>)
S.N.<br />
Description of Training, Orientation<br />
& Exposures<br />
No. of<br />
Event<br />
No. of COs<br />
Participate<br />
Gender & Ethnicity Wise No. of Participants<br />
Male Female Dalit Janajati Muslim Others Total<br />
Remarks<br />
21 Training on Dale Ghans & Bhuin<br />
Ghas Mgmt.<br />
2 39 34 38 17 38 0 17 72 Sindhuli<br />
22 Training on Beta -Bans Mgmt. 1 15 13 8 2 17 0 2 21 Sindhuli<br />
23 Training on Fruit Farming 2 4 25 10 23 0 0 12 35 Mugu<br />
24 Training on Carpentry & Furniture<br />
Manufacturing<br />
4 33 86 0 25 0 0 61 86 Mugu, Kalikot, Jumla<br />
25 Training on Tailoring 4 37 6 54 26 0 3 31 60 Doti, Jumla, Parsa<br />
26 Training on Candle making 2 4 1 13 8 0 0 6 14 Parsa<br />
27 Training on Panir/Cottage Cheese<br />
Making<br />
1 5 5 Rautahat<br />
28 Training on Curd Making 1 2 4 Rautahat<br />
29 Training on Motor Bike, Bi-Cycle<br />
and Pumping Set Repairing<br />
3 3 0 2 1 0 0 3 3 Parsa, Rautahat<br />
30 Orientation on Local Resource<br />
Mobilization<br />
8 50 68 45 17 67 0 29 <strong>11</strong>3 Udayapur<br />
31 Training on Aadharsila 28 75 636 46 682 Rautahat<br />
32 Training on Construction and<br />
Operation of various Infrastructures<br />
24 31 244 265 52 321 0 136 509 Parsa, Udayapur, Sindhuli<br />
33 Orientation on Health, Hygiene ,<br />
Sanitation and Social Improvement<br />
87 3137 <strong>11</strong>39 3376 1723 1395 184 1213 4515 Mugu, Parsa, Sarlahi<br />
34 Functional Literacy Class to COs 18 18 206 137 56 63 7 217 343 Sarlahi<br />
35 Exposure Visit 1 8 6 10 4 0 0 12 16 Baitadi<br />
S.N.<br />
Description of Training, Orientation<br />
& Exposures<br />
No. of Event<br />
No. of COs<br />
Participate<br />
Gender & Ethnicity Wise No. of Participants<br />
Male Female Dalit Janajati Muslim Others Total<br />
Remarks<br />
1 Training on Leadership and group<br />
Management<br />
2379 2053 4277 2048 865 146 3271 6330 Baitadi, Mugu, Bhajang, Rukum, Jumla, Bardiya,<br />
Parsa, Rautahat, Sindhuli, Solokhumbu, Dhanusa<br />
2 Training on Enterprise<br />
Development/SIYB (TOPE &<br />
TOSE)<br />
77 900 370 <strong>11</strong>89 790 397 97 285 1559 Rukum, Sindhupalchwok, Parsa, Udayapur, Mahottari<br />
3 Orientation on Demand Led<br />
Proposal Preparation<br />
9 202 76 126 64 127 0 <strong>11</strong> 202 Sindhupalchwok<br />
4 Training on Account Management 268 2923 2109 4418 2344 1637 148 2398 6527 Baitadi, Mugu, Bhajang, Rolpa, Bardiya, Kapilbastu,<br />
Rautahat, Sarlahi, Parsa,Bara, Siraha, Saptari,<br />
Sindhuli, Sindhupalchwok,Khotang, Solokhumbu,<br />
Dhanusa<br />
ANNUAL PROGRESS REPORT (<strong>2010</strong>/20<strong>11</strong>) 51
S.N.<br />
Description of Training, Orientation<br />
& Exposures<br />
No. of Event<br />
No. of COs<br />
Participate<br />
Gender & Ethnicity Wise No. of Participants<br />
Male Female Dalit Janajati Muslim Others Total<br />
Remarks<br />
5 Refresher Training on Account<br />
management<br />
42 408 317 296 123 163 0 327 613 Rukum, Jumla, Terthathum<br />
6 Training on Revolving <strong>Fund</strong> &<br />
Saving-Credit Management<br />
257 <strong>11</strong>23 1800 4944 1927 3022 155 1640 6744 Baitadi, Jumla, Rolpa, Humla Bardiya, Kapilbastu,<br />
Rasuwa, Bara, Rautahat, Khotang, Okhaldhunga,<br />
Terthathum, Udayapur, Siraha , Dhanusa<br />
7 Training on Institutional Building<br />
and Cooperative Mgmt.<br />
53 274 198 677 350 195 13 317 875 Darchula, Doti, Rasuwa, Parsa, Rautahat, Sindhuli,<br />
Udayapur<br />
8 Training on Business Management 6 6 0 21 21 0 0 0 21 Parsa<br />
9 Training on Community Based<br />
Livestock Insurance System<br />
16 214 186 188 70 176 0 128 374 Sindhuli, Jumla<br />
10 Training on Animal Husbandry<br />
(Buffalo, Cow, Goat, Pig)<br />
521 1873 4685 9413 3577 3012 461 7028 14098 Parsa, Bara,Sindhuli, Udayapur, Mahottari,<br />
Sindhupalchwok, Solokhumbu, Okhaldhunga,<br />
Terthathum, Doti, Dailekh,Jumla,Bhajang, Kalikot,<br />
Mugu<br />
<strong>11</strong> Training on Vegetable Farming 16 54 105 299 70 34 0 300 404 Mugu, Dailekh, Sindhupalchwok, Sindhuli<br />
12 Training on Poultry Farming 37 31 40 27 18 0 26 71 4 Sindhuli, sindhupalchwok, Jumla<br />
13 Training on Ginger Farming 10 33 73 147 50 131 0 39 220 Terthathum, Sindhuli<br />
14 Training on System of Rice<br />
Intensification (SRI)<br />
1 8 <strong>11</strong> 12 7 16 23 Kalikot<br />
15 Training on IPM Mgmt. 4 4 0 82 42 0 0 40 82 Bhajang<br />
16 Training on Bee Keeping 1 10 12 6 4 7 0 7 18 Sindhuli<br />
17 Training on Dairy Development 1 21 18 7 4 6 0 15 25 Sindhuli<br />
18 Training on Livelihood Mgmt. 8 6 20 33 25 0 0 28 53 Mugu<br />
19 Training for Village Level Animal<br />
Health Workers<br />
4 4 4 Rautahat<br />
20 Training on Gothemal & Compost<br />
Mal Mgmt.<br />
1 1 10 5 0 15 0 0 15 Khotang<br />
21 Training on Dale Ghans & Bhuin<br />
Ghas Mgmt.<br />
2 39 34 38 17 38 0 17 72 Sindhuli<br />
22 Training on Beta -Bans Mgmt. 1 15 13 8 2 17 0 2 21 Sindhuli<br />
23 Training on Fruit Farming 2 4 25 10 23 0 0 12 35 Mugu<br />
24 Training on Carpentry & Furniture<br />
Manufacturing<br />
4 33 86 0 25 0 0 61 86 Mugu, Kalikot, Jumla<br />
25 Training on Tailoring 4 37 6 54 26 0 3 31 60 Doti, Jumla, Parsa<br />
26 Training on Candle making 2 4 1 13 8 0 0 6 14 Parsa<br />
27 Training on Panir/Cottage Cheese<br />
Making<br />
1 5 5 Rautahat<br />
28 Training on Curd Making 1 2 4 Rautahat<br />
52 ANNUAL PROGRESS REPORT (<strong>2010</strong>/20<strong>11</strong>)
S.N.<br />
Description of Training, Orientation<br />
& Exposures<br />
No. of Event<br />
No. of COs<br />
Participate<br />
Gender & Ethnicity Wise No. of Participants<br />
Male Female Dalit Janajati Muslim Others Total<br />
Remarks<br />
29 Training on Skill and Capacity<br />
Enhancement<br />
7 56 16 152 104 12 0 52 168 Dhanusa<br />
30 Training on Motor Bike, Bi-Cycle<br />
and Pumping Set Repairing<br />
3 3 0 2 1 0 0 3 3 Parsa, Rautahat<br />
31 Orientation on Local Resource<br />
Mobilization<br />
8 50 68 45 17 67 0 29 <strong>11</strong>3 Udayapur<br />
32 Training on Aadharsila 28 75 636 46 682 Rautahat<br />
33 Training on Construction<br />
and Operation of various<br />
Infrastructures<br />
24 31 244 265 52 321 0 136 509 Parsa, Udayapur, Sindhuli<br />
34 Orientation on Health, Hygiene ,<br />
Sanitation and Social Improvement<br />
87 3137 <strong>11</strong>39 3376 1723 1395 184 1213 4515 Mugu, Parsa, Sarlahi<br />
35 Functional Literacy Class to COs 18 18 206 137 56 63 7 217 343 Sarlahi<br />
36 Exposure Visit 1 8 6 10 4 0 0 12 16 Baitadi<br />
ANNUAL PROGRESS REPORT (<strong>2010</strong>/20<strong>11</strong>) 53
Annex <strong>11</strong><br />
PO Capacity Development Status<br />
S.N.<br />
Description of Training, Orientation<br />
& Exposures<br />
No. of Event<br />
No. of POs<br />
Participate<br />
Gender & Ethnicity Wise No. of Participants<br />
Male Female Dalit Janajati Muslim Others Total<br />
Remarks<br />
1 Orientation on PAF Implementation<br />
process<br />
4 21 120 26 12 22 2 <strong>11</strong>0 146 Kalikot, Siraha, Dhanusa<br />
2 Orientation on PAF Environmental<br />
Frameworks<br />
1 4 20 2 6 7 0 12 22 Terthathum<br />
3 Training on Social mobilization and<br />
leadership Development<br />
8 57 197 70 36 64 4 163 267 Rukum, Bardiya, Mahottari, Khotang, Solokhumbu,<br />
Dhanusa<br />
4 ToT on Account and Revolving<br />
<strong>Fund</strong> Management<br />
18 89 403 139 68 206 7 261 542 Dolpa, Rolpa, Kapilbastu, bara, Rautahat, Sarlahi,<br />
Saptari, Sindhuli,Okhaldhunga,Khotang,Solokhumbu,<br />
Sindhupalchwok<br />
5 Training on Livelihood<br />
Improvement Planning<br />
2 15 75 19 7 20 2 65 94 Dhanusa<br />
6 Training on Aadharsila 2 15 75 19 7 20 2 65 94 Dhanusa<br />
7 Training on Report and Proposal<br />
Writing<br />
2 15 75 19 7 20 2 65 94 Dhanusa<br />
8 Workshop on Potentiality<br />
Exploration<br />
1 15 150 Dhanusa<br />
9 Orientation on PAF Revolving <strong>Fund</strong><br />
Management Guidelines<br />
10 41 185 49 33 57 0 145 235 Doti, Kalikot, Jumla, Khotang, Terthathum,<br />
Sindhupalchwok, Humla,<br />
10 Orientation on Community<br />
Level Various infrastructures<br />
Implementation Process<br />
5 35 <strong>11</strong>1 34 25 46 0 74 145 Kalikot, Rolpa, Kapilbastu, Saptari, Terthathum<br />
<strong>11</strong> Orientation on Community Based<br />
Livestock Insurance System<br />
1 4 21 4 0 10 0 16 26 Humla<br />
12 Orientation on Programme<br />
Management Information System<br />
(PMIS)<br />
1 4 10 1 2 3 0 5 <strong>11</strong> Terthathum<br />
13 Training on Value Chain 1 2 23 9 3 1 0 28 32 Doti<br />
14 Training on Cooperative Mgmt. 2 15 4 24 38 7 0 19 64 Baitadi, Dolpa<br />
15 Exposure Visit of POs 1 <strong>11</strong> 24 9 4 <strong>11</strong> 0 19 33 Sindhupalchwok<br />
16 Training on Report Writing 1 5 1 4 0 4 0 1 5 Sindhupalchwok<br />
17 Orientation on Health & Sanitation 1 98 81 17 7 23 0 68 98 Sarlahi<br />
18 Coordination & Review Meeting<br />
With DDCs and Line Agencies<br />
17 Ramechhap, Rasuwa, Parsa, Bara, Rautahat,<br />
Sindhuli, Dhanusa<br />
54 ANNUAL PROGRESS REPORT (<strong>2010</strong>/20<strong>11</strong>)
Annex 12<br />
Gross Annual Income Change of CO members<br />
District<br />
No. of COs<br />
Total CO<br />
Members<br />
HH level Annual Gross Income change in Rs. (Range)<br />
0-15000 15000-30000 30000-60000 >60000<br />
Average income<br />
Increased (%)<br />
Achham 9 269 236 9 13 <strong>11</strong> 41.2<br />
% 87.7 3.3 4.8 4.1<br />
Bajhang 8 174 158 10 6 0 50.6<br />
% 90.8 5.7 3.4 0.0<br />
Bajura 6 190 65 60 44 21 176.1<br />
% 34.2 31.6 23.2 <strong>11</strong>.1<br />
Dadeldhura 8 221 150 50 15 6 <strong>11</strong>5.5<br />
% 67.9 22.6 6.8 2.7<br />
Dailekh 8 264 173 58 25 8 <strong>11</strong>3.9<br />
% 65.5 22.0 9.5 3.0<br />
Darchula 25 565 460 76 15 14 40.2<br />
% 81.4 13.5 2.7 2.5<br />
Dolpa 6 202 200 2 0 0 7.3<br />
% 99.0 1.0 0.0 0.0<br />
Doti 10 306 245 44 13 4 18.3<br />
% 80.1 14.4 4.2 1.3<br />
Humla 10 282 189 37 36 20 41.5<br />
% 67.0 13.1 12.8 7.1<br />
Jajarkot 9 285 143 109 28 5 277.2<br />
% 50.2 38.2 9.8 1.8<br />
Jumla 8 232 145 30 20 37 <strong>11</strong>4.7<br />
% 62.5 12.9 8.6 15.9<br />
Kalikot 8 318 313 1 2 2 -0.1<br />
% 98.4 0.3 0.6 0.6<br />
Kapilvastu 25 709 531 80 36 62 142.7<br />
% 74.9 <strong>11</strong>.3 5.1 8.7<br />
Mahottari 13 313 179 55 48 31 51.1<br />
% 57.2 17.6 15.3 9.9<br />
Mugu 6 251 221 10 8 12 45.0<br />
% 88.0 4.0 3.2 4.8<br />
Pyuthan 16 400 247 97 45 <strong>11</strong> 98.3<br />
% 61.8 24.3 <strong>11</strong>.3 2.8<br />
Ramechhap 23 579 465 61 37 16 47.1<br />
% 80.3 10.5 6.4 2.8<br />
Rasuwa 10 284 221 36 14 13 59.5<br />
% 77.8 12.7 4.9 4.6<br />
Rautahat 15 416 144 108 104 60 125.7<br />
% 34.6 26.0 25.0 14.4<br />
Rolpa 6 225 83 59 60 23 <strong>11</strong>5.1<br />
% 36.9 26.2 26.7 10.2<br />
Rukum 7 191 93 36 47 15 164.7<br />
% 48.7 18.8 24.6 7.9<br />
ANNUAL PROGRESS REPORT (<strong>2010</strong>/20<strong>11</strong>) 55
District<br />
No. of COs<br />
Total CO<br />
Members<br />
HH level Annual Gross Income change in Rs. (Range)<br />
0-15000 15000-30000 30000-60000 >60000<br />
Average income<br />
Increased (%)<br />
Sarlahi 10 296 234 42 13 7 59.1<br />
% 79.1 14.2 4.4 2.4<br />
Sindhuli 19 655 433 <strong>11</strong>6 77 29 79.6<br />
% 66.1 17.7 <strong>11</strong>.8 4.4<br />
Siraha 24 541 319 <strong>11</strong>2 68 42 61.8<br />
% 59.0 20.7 12.6 7.8<br />
Total 289 8,168 5,647 1,298 774 449 82.5<br />
% 69.1 15.9 9.5 5.5<br />
56 ANNUAL PROGRESS REPORT (<strong>2010</strong>/20<strong>11</strong>)
Annex 13<br />
Summary Results of Revolving <strong>Fund</strong> Status <strong>2010</strong><br />
Districts No. of POs<br />
No. of<br />
VDCs<br />
No. of COs No. of Members RF from PAF<br />
RF from other<br />
sources<br />
No. of members<br />
accessing RF<br />
Average Loan<br />
Period<br />
Average<br />
Interest rate<br />
Average<br />
repayment rate<br />
Loan size<br />
Maximum Minimum<br />
Achham 8 23 286 9,549 103,613,693 8,369,437 7,873 2.0 7.1 74.4 100,000 200<br />
Baitadi 6 23 <strong>11</strong>6 4,197 41,725,964 4,031,059 4,630 2.0 5.7 28.9 92,000 1,000<br />
Bajhang 3 18 197 4,067 43,658,284 1,756,849 3,853 2.9 9.0 92.5 133,000 500<br />
Bajura 4 27 318 9,843 127,633,257 5,075,455 8,547 2.4 4.4 61.5 100,000 900<br />
Dadeldhura 8 18 378 <strong>11</strong>,198 99,167,898 4,300,986 8,855 2.1 7.5 59.8 40,000 650<br />
Dailekh 5 25 282 10,728 134,203,907 26,098,895 9,420 1.5 5.0 87.2 84,650 1,000<br />
Darchula 10 41 781 15,412 184,589,884 5,894,544 13,554 1.9 7.4 64.6 222,500 500<br />
Dolpa 3 12 134 4,093 59,534,491 8,250,831 3,234 2.0 6.0 15.6 28,406 3,330<br />
Doti 5 21 273 8,790 109,708,980 4,228,063 9,679 2.1 6.0 41.4 150,000 2,700<br />
Humla 5 22 277 5,817 <strong>11</strong>9,209,648 2,872,556 1,334 2.2 5.2 57.9 100,000 900<br />
Jajrkot 7 20 164 6,814 62,797,731 6,575,106 6,855 2.1 <strong>11</strong>.6 48.2 160,000 1,000<br />
Jumla 7 29 423 15,<strong>11</strong>3 209,235,344 24,170,767 10,071 1.9 3.8 83.3 100,000 1,500<br />
Kalikot 6 24 281 7,924 86,874,798 24,3<strong>11</strong>,318 6,192 2.8 12.0 80.3 32,000 2,000<br />
Mahottari 8 20 438 10,669 123,075,590 8,573,827 8,450 1.8 3.9 80.8 56,000 900<br />
Mugu 5 24 131 4,066 29,002,755 26,038 2,479 2.8 1.0 25.2 33,000 500<br />
Pyuthan 12 49 959 27,258 225,937,076 5,238,890 25,721 1.8 7.3 93.1 125,070 225<br />
Rauthat 8 44 828 22,582 335,977,312 29,579,038 17,781 1.8 7.1 88.8 100,000 1,000<br />
Rolpa 1 4 98 2,944 35,247,090 2,765,192 2,265 1.2 9.3 100.0 48,600 2,250<br />
Rukum 3 12 <strong>11</strong>4 3,187 36,272,122 5,337,705 3,029 1.5 9.4 94.0 54,600 1,500<br />
Sindhuli 10 35 700 27,747 272,582,704 15,464,158 21,<strong>11</strong>9 2.1 5.6 96.3 63,000 100<br />
Siraha 15 63 969 22,693 284,948,003 17,916,180 18,293 2.7 6.7 71.6 260,000 900<br />
Morang 2 3 61 2,375 23,827,681 3,971,577 2,375 1.0 6.0 81.6 60,000 2,000<br />
Makawanpur 2 18 38 1,436 10,267,958 1,368,364 1,160 1.7 9.5 84.3 29,367 500<br />
Total 143 575 8,246 232,502 2,759,092,169 216,176,836 196,769 2.0 6.8 76.0 260,000 100<br />
Remarks<br />
ANNUAL PROGRESS REPORT (<strong>2010</strong>/20<strong>11</strong>) 57
Annex 14<br />
PAF Result Matrix<br />
NEPAL: <strong>Poverty</strong> <strong>Alleviation</strong> <strong>Fund</strong><br />
<strong>Nepal</strong> – PAF II Project<br />
RESULTS FRAMEWORK<br />
As of 16 July 16, 20<strong>11</strong><br />
Impact: Reduced poverty through improved living conditions of poor<br />
Objective Summary Performance Indicators<br />
Means of Verification/Source of<br />
Information<br />
Progress<br />
PAF II (100M) Cumulative<br />
Project level: OUTCOMES<br />
1. Livelihood Improved P1.1.Increased by 30% poor<br />
households with access to<br />
improved infrastructure facilities at<br />
End-of-Project (EOP).<br />
P1.1 Report available from Infra<br />
division<br />
No. of households: 69,374 HHs<br />
IG+INFRA: 3,575<br />
No. of households: 69,374 HHs<br />
IG+INFRA: 3,575<br />
P1.2 No. of improved community<br />
water points constructed or<br />
rehabilitated under the project<br />
P1.2 Report available from Infra<br />
division<br />
Total: 2139 Total: 3,603<br />
P1.3. 25% of poor households<br />
with minimum of 15% increased<br />
incomes through project activities<br />
by EOP.<br />
P1.2.1 Follow-up baseline survey<br />
of PAF<br />
Per centage of HHs: 66% [Based on the Beneficiary assessment<br />
of sample households in <strong>year</strong> <strong>2010</strong>, who have received PAF<br />
support at least 3 <strong>year</strong>s or more. A new beneficiary assessment is<br />
under preparation.] The Follow up survey <strong>2010</strong> shows: Per capita<br />
consumption of money reciepient CO members increased by 28%<br />
( in real term) and the money received at least six or more months<br />
increased by 49%<br />
2. 2. Empowered women<br />
and targeted groups’<br />
members<br />
P2.1 30 % of key positions in<br />
Project Community Organizations<br />
(COs) filled by women and persons<br />
from the targeted households<br />
P2.1 Status report of CO with<br />
disaggregated data<br />
Women: 65%<br />
Dalit and Janajati: 57%<br />
Total: 35,810<br />
Women: 63%<br />
Dalit and Janajati: 62%<br />
Total: 50,129<br />
P2.2. 25% of COs lead<br />
(Chairperson) by women and the<br />
targeted HHs<br />
P2.2 CO status report with<br />
disaggregated data<br />
Women: 7,0<strong>11</strong> (56%)<br />
Dalit and Janajati: 7,454 (60%)<br />
Total: 12,438<br />
Women: 9,310 (53%)<br />
Dalit and Janajati: <strong>11</strong>,416<br />
(65%)<br />
Total: 17,514<br />
P2.3. 30% of members of Project<br />
community organization from<br />
targeted households<br />
P2.3 CO status report Dalit and Janajati: 52%<br />
Total: 310,143<br />
Dalit and Janajati: 58%<br />
Total: 470,021<br />
INTERMEDIATE OUTCOMES INDICATORS<br />
COMPONENT 1: Infrastructure Development<br />
Remarks<br />
“Poor Households” means those families with<br />
less than one <strong>year</strong>’s supply of (staple) food and/or<br />
categorized by PAF ‘A’, ‘B’ & ‘C’.<br />
“Non-poor HHs” means other HHs that live in the<br />
vicinity of poor HHs having access to the same<br />
facilities and/or categorized by PAF ‘D’.<br />
“Access” means having possible use of facilities.<br />
“Improved facilities” means community<br />
infrastructure facilities which have been improved<br />
by the Project.<br />
“incomes” means total household cash incomes<br />
“Targeted households (HHs)” are: Dalit and<br />
Janajati, within the Poor Households.<br />
“Key positions “ means Chairperson, Secretary and<br />
Treasurer of the Community Organizations<br />
“Project COs” means the groups formed under the<br />
Project.<br />
58 ANNUAL PROGRESS REPORT (<strong>2010</strong>/20<strong>11</strong>)
Objective Summary Performance Indicators<br />
C.1 Small scale village and<br />
community infrastructure<br />
C.1.1 No. of projects completed (a)<br />
with target community participation,<br />
and (b) according to quality<br />
standards, as verified by Technical<br />
staff of Partners Organizations<br />
and PAF’s Infra. Division and TAC<br />
(Technical Appraisal Committee).<br />
C.1.2 All completed infrastructure<br />
with O&M measures satisfactorily<br />
operating at least one <strong>year</strong> after<br />
sub-project completion.<br />
COMPONENT 2: Income Generating Activities (IGA)<br />
C.2 Income generation<br />
projects<br />
C.2.1 30% of each IGA community<br />
organization belonging to targeted<br />
HHs.<br />
C.2.2 Increased 15% average net<br />
income generated from IGA, by<br />
locality.<br />
COMPONENT 3: Innovations<br />
C.3 Innovations Window C.3.1 100% of Innovation Grants<br />
awarded according to the agreed<br />
criteria<br />
C.3.2 60% of project-funded<br />
innovations completed minimum<br />
of the first <strong>year</strong> of their approved<br />
implementation program and<br />
submitted their detailed progress<br />
report to PAF Management by EOP.<br />
COMPONENT 4: Capacity Building<br />
C.4.1 Capacity building for<br />
Community Organizations<br />
C.4.1 At least 60% of Community<br />
Organizations participated in<br />
orientation program is successfully<br />
implementing approved subprojects.<br />
Means of Verification/Source of<br />
Information<br />
Progress<br />
PAF II (100M) Cumulative<br />
C1.1.1 Report of Infra division<br />
and sub projects report of MIS<br />
1. No. of INFRA subprojects<br />
verified and approved: 1,754<br />
2. No. of INFR subprojects<br />
completed: 1,084<br />
3. No. of target HHs benefited<br />
(INFRA): 69,454 (Dalit: 15,241;<br />
Janajati: 18,259)<br />
IG + Infra: HH: 3,575/Dalit: 901/<br />
Janajati: 561)<br />
1. No. of INFRA subprojects<br />
verified and approved: 3,039<br />
2. No. of INFR subprojects<br />
completed: 2,331<br />
3. No. of target HHs benefited<br />
(INFRA): 100,351 (Dalit:<br />
22,991; Janajati: 25,141)<br />
IG + Infra: HH: 32,092/Dalit:<br />
10,960/Janajati: 10,713)<br />
C.1.2 Status report on O&M<br />
study of Infrastructure<br />
No. of Infra. Sub projects operating<br />
O&M measures:200<br />
No. of Infra. Sub projects<br />
operating O&M measures:1450<br />
C2.1.1 Compiled district report<br />
and MIS<br />
Targeted HHs in IGA community<br />
organization: 52% (Total: 302,503)<br />
Targeted HHs in IGA community<br />
organization: 61.8% (Total:<br />
436,097)<br />
C2.2 Baseline and follow up<br />
surveys and social assessmnt<br />
of COs<br />
Average gross annual income increased 82.5% in real term. [Based<br />
on the Beneficiary assessment of sample households in <strong>year</strong> <strong>2010</strong>,<br />
who have received PAF support at least 3 <strong>year</strong>s or more. A new<br />
beneficiary assessment is under preparation.]<br />
C3.1 Assessment report of<br />
innovative sub project awarded<br />
1. No. of Innovative grants<br />
awarded: comprisinga.<br />
<strong>Nepal</strong> Development Marketplace<br />
(NDM): 0<br />
b. Other: 253<br />
1. No. of Innovative grants<br />
awarded: comprisinga.<br />
<strong>Nepal</strong> Development<br />
Marketplace (NDM): 37<br />
b. Other: 534<br />
C3.2 Progress reports 1. No. of Innovative subprojects<br />
completed (Progress reports<br />
available on standard template):<br />
NDM: 0<br />
Other: 80% (out of 253)<br />
1. No. of Innovative subprojects<br />
completed (Progress reports<br />
available on standard template):<br />
NDM: 67% (out of 37)<br />
Other: 86% (out of 534)<br />
C.4 Training reports Per centage of COs successfully<br />
Implementing approved<br />
Subprojects: 88.5% ( out of<br />
12,370)<br />
Per centage of COs<br />
successfully implementing<br />
approved Sub projects: 92.5%<br />
(out of 17,892)<br />
Remarks<br />
“Quality standards” means use of materials and<br />
work as mentioned in design & estimate of the sub<br />
projects. It will ensure during final installment of<br />
projects.<br />
“Satisfactorily” means operating well, being well<br />
maintained, O&M funds available, etc.<br />
Criteria for Project-funded Innovation include:<br />
those that benefit the poor and targeted population,<br />
as defined above<br />
are cost-effective<br />
are replicable<br />
have a detailed implementation plan for at least 2<br />
<strong>year</strong>s<br />
“Successful implementation” means over half of<br />
the group members are involved in the sub-project,<br />
have agreed operating procedures, and an agreed<br />
implementation plan, including processes and<br />
sharing of cost and revenue and also fund is<br />
granted by PAF.<br />
ANNUAL PROGRESS REPORT (<strong>2010</strong>/20<strong>11</strong>) 59
Objective Summary Performance Indicators<br />
C.4.2 Capacity building for<br />
Local Bodies<br />
C.4.2 50% of Local Bodies (LBs)<br />
trained and involved in monitoring<br />
PAF activities in their localities<br />
C.4.3 Capacity building for<br />
IGA Groups<br />
C.4.3 60% of trained IGA<br />
community organization members<br />
successfully operating IGA<br />
C.4.4 Community Groups<br />
trained to access funds<br />
C.4.4 50% of trained IGA<br />
community organization members<br />
successfully obtained and managed<br />
financing for their business<br />
activities.<br />
COMPONENT 5: PAF managed effectively and efficiently<br />
C.5 PAF is well-managed at<br />
national & district levels<br />
C.5 1 # of project managed<br />
smoothly, with timely response at<br />
PO and CO level.<br />
C.5.2 Project management receives<br />
PO Progress and monitoring reports<br />
and Audit reports according to<br />
Project standards of timeliness from<br />
100% POs.<br />
C.5.3 100% of complaints received<br />
by PAF recorded, addressed<br />
satisfactorily and the actions<br />
documented through compliant<br />
handling mechanism.<br />
Means of Verification/Source of<br />
Information<br />
Progress<br />
PAF II (100M) Cumulative<br />
C4.2 Training reports and review<br />
workshop report of LBs<br />
1. No. of monitoring visits by the<br />
staff of LBs: 252<br />
1. No. of monitoring visits by<br />
the staff of LBs: 447<br />
C.4.3 Training reports and<br />
follow up survey as well as case<br />
studies.<br />
1. No. of IG sp: 9,356<br />
2. No. of IGA members trained:<br />
252605<br />
IG + INFRA: 4,5<strong>11</strong><br />
1. No. of IG sp: 14,669<br />
2. No. of IGA members trained:<br />
383,929<br />
IG + INFRA: 26,465<br />
3. % of trained IGA members successfully operating IGA: 85.4%<br />
(based on RF status assessment)<br />
C.4.4 Status reports of revolving<br />
fund of COs<br />
% of IGA CO members obtaining and managing the funds for intended<br />
purpose: 85.4% [Based on the assessment carried out on RF access<br />
by the CO members for their business activities during <strong>2010</strong>. The<br />
new assessment of 20<strong>11</strong> is in progress ]<br />
C.5.1 Project completion reports PO: 898<br />
CO: 9,166<br />
PO: 1,144<br />
CO: 14,802<br />
C.5.2 Project completion reports<br />
of POs and MIS.<br />
PO progress reports: 898 CO level<br />
Social Audit reports: 5,699<br />
PO progress reports: <strong>11</strong>44<br />
CO level Social Audit reports:<br />
5,699<br />
C.5.3 Reports on compliant<br />
handling mechanism<br />
1. % of Complaints received and recorded and addressed: 91.6% (<br />
Total complaints received: 36)<br />
Remarks<br />
• ‘Local bodies’ means VDCs, DDCs and<br />
Municipalities<br />
• “Trained” means participated in orientation<br />
and other monitoring training.<br />
“Successfully operating” means that the enterprises<br />
are showing positive and increasing net income<br />
• “Successfully managed” means complying<br />
with the conditions of the financing,<br />
including use and management of funds for<br />
the intended purposes, diligence in timely<br />
servicing of debt.<br />
• ‘<strong>Fund</strong>s’ means PAF revolving fund or other<br />
funds.<br />
• “Project Managed” means status of proposal<br />
received, agreement done, fund transfer and<br />
completion of sub/projects.<br />
• “On time” means 7 and 15 days after months<br />
completed in the case of 20 accessible and<br />
20 remote districts respectively.<br />
60 ANNUAL PROGRESS REPORT (<strong>2010</strong>/20<strong>11</strong>)
Annex 15<br />
Year wise Target vs. Achievements<br />
Physical Progress<br />
<strong>Fiscal</strong> Year<br />
Target in Nos. Achievement in Nos. % of achievement<br />
FY 2060/61 - -<br />
FY 2061/62 - 541<br />
FY 2062/63 1,597 <strong>11</strong>66 73%<br />
FY 2063/64 2,750 3483 126%<br />
FY 2064/65 3,776 3<strong>11</strong>7 83%<br />
FY 2065/66 4,048 3343 83%<br />
FY 2066/67 3,923 3882 99%<br />
FY 2067/68 2,193 3148 144%<br />
Total 18,287 541 102%<br />
Financial Progress<br />
<strong>Fiscal</strong> Year<br />
Budget (NRs) Expenditure (NRs) %<br />
FY 2060/61 10,000,000.00 5,781,379.00 57.81<br />
FY 2061/62 268,000,000.00 247,322,606.00 92.28<br />
FY 2062/63 507,925,000.00 493,505,927.00 97.16<br />
FY 2063/64 1,254,070,000.00 1,210,296,385.00 96.51<br />
FY 2064/65 1,970,732,000.00 1,875,485,349.00 95.17<br />
FY 2065/66 2,978,865,000.00 1,647,207,175.00 55.30<br />
FY 2066/67 2,723,717,000.00 2,481,049,874.47 91.09<br />
FY 2067/68 3,039,166,000.00 2,601,283,022.25 85.59<br />
Total 12,752,475,000.00 10,561,931,717.72 82.82<br />
Annex 16<br />
Details of expenditure up to July 16, 20<strong>11</strong> (Cumulative PAF-I and PAF-II)<br />
Details 40M Expenditure 100M Expenditure Total Expenditure<br />
Community Organization (IG) 1,381,890,497.49 4,471,353,214.74 5,853,243,712.23<br />
Community Organization (INFRA) 391,685,432.51 1,229,519,625.48 1,621,205,057.99<br />
Community Organization (INNOVATIVE) 654,004,180.22 107,814,513.00 761,818,693.22<br />
Total Community Organization (I) 2,427,580,<strong>11</strong>0.22 5,808,687,353.22 8,236,267,463.44<br />
Partner Organization (II) 373,442,9<strong>11</strong>.49 1,331,451,460.41 1,704,894,371.90<br />
Sub Total (A=I+II) 2,801,023,021.71 7,140,138,813.63 9,941,161,835.34<br />
Monitoring, Training/Workshop (B) 108,181,431.90 108,785,984.77 216,967,416.67<br />
PAF Capital Cost (C) 34,438,454.82 23,438,674.08 57,877,128.90<br />
PAF Recurrent Cost (D) 120,946,304.52 224,979,032.04 345,925,336.56<br />
Total (A+B+C+D) 3,064,589,212.95 7,497,342,504.52 10,561,931,717.47<br />
Note:(i) Including PPF Expenditure and KA-1-6 (Beruju) Expenses Amount<br />
(ii) Project PAF-I is closed<br />
ANNUAL PROGRESS REPORT (<strong>2010</strong>/20<strong>11</strong>) 61
Annex 17 (1)<br />
Program <strong>Fund</strong>ing Status of FY-2067/68 (<strong>2010</strong>/<strong>11</strong> only)<br />
Target<br />
Progress<br />
Descriptions<br />
Yearly Budget Yearly Expenditure %<br />
Block Grant to Cos<br />
Income Generation Sub Projects 1,498,802,000.00 1,526,897,895.45 101.87<br />
Infrastructure Sub Projects 668,271,000.00 470,910,094.15 70.47<br />
Innovative Sub-Projects 88,343,000.00 <strong>11</strong>,400,881.00 12.91<br />
Total Sub-Projects Block Grants (A) 2,255,416,000.00 2,009,208,870.60 89.08<br />
Partner Organization 529,048,000.00 456,990,252.13 86.38<br />
Goods & Equipment, Vehicle And Furniture 14,769,000.00 369,821.20 2.50<br />
Consultancy, Training, Workshop, Seminar <strong>11</strong>3,764,000.00 39,606,480.75 34.81<br />
Incremental Operating Expenses 126,169,000.00 95,107,597.57 75.38<br />
Sub Total (B) 783,750,000.00 592,074,151.65 75.54<br />
Grand Total (A+B) 3,039,166,000.00 2,601,283,022.25 85.59<br />
62 ANNUAL PROGRESS REPORT (<strong>2010</strong>/20<strong>11</strong>)
Annex 17 (2)<br />
District wise Target Vs Achievement in FY-2067/68 (<strong>2010</strong>/<strong>11</strong> only)<br />
District<br />
Target Physical Achievement Achievement in % Beneficiaries<br />
IG INFRA Amount IG INFRA Amount IG INFRA Amount Co members Total<br />
Initial 6 Districts<br />
Darchula 7 10 149,175,130.00 7 20 136413196.8 100% 200% 91% - 294<br />
Kapilbastu 28 19 73,173,881.00 60 22 66731610.87 214% <strong>11</strong>6% 91% 1,875 1,839<br />
Mugu 45 4 47,817,321.00 51 19 36262929.8 <strong>11</strong>3% 475% 76% 299 1,308<br />
Pyuthan 0 3 73,176,944.00 129 <strong>11</strong> 104715<strong>11</strong>5.8 367% 143% 465 4,320<br />
Ramechhap 21 5 98,163,839.00 63 13 104468819.6 300% 260% 106% 841 1,427<br />
Siraha 38 9 <strong>11</strong>3,706,731.00 35 74908444.23 92% 0% 66% 756 756<br />
Sub Total 139 50 555,213,846.00 345 85 523,500,<strong>11</strong>7 248% 170% 94% 4,236 9,944<br />
19 Additional Districts<br />
Achham 44 20 91,104,746.00 130 3 94575856.4 295% 15% 104% 3,456 4,524<br />
Baitadi 9 8 60,870,320.00 90 10 79077301.2 1000% 125% 130% 1,935 2,494<br />
Bajhang 28 <strong>11</strong> 57,861,377.00 63 18 59497889.58 225% 164% 103% 1,859 1,483<br />
Bajura 10 4 44,666,970.00 6 5 36877853.41 60% 125% 83% 138 244<br />
Dadeldhura 4 4 55,652,572.00 2 13 53448505 50% 325% 96% 277<br />
Dailekh 34 9 51,4<strong>11</strong>,664.00 38 4 45589366.57 <strong>11</strong>2% 44% 89% 1,173 1,267<br />
Dolpa 52 3 31,746,126.00 43 2 33522361.93 83% 67% 106% 1,236 1,297<br />
Doti 40 5 42,616,782.00 47 3 39126805.61 <strong>11</strong>8% 60% 92% 1,267 1,406<br />
Humla 0 0 25,023,445.00 14 20324553.04 81% 178<br />
Jajarkot 2 4 41,126,799.00 2 3 51733648.62 100% 75% 126% 51 229<br />
Jumla 7 6 <strong>11</strong>6,063,381.00 <strong>11</strong> 5 104987282.5 157% 83% 90% 336 419<br />
Kalikot 0 18 92,279,359.00 49 15 72892250.09 83% 79% 1,370 2,152<br />
Mahottari 22 5 69,474,916.00 42 5 56236030 191% 100% 81% 862 1,020<br />
Rasuwa 22 5 10,021,657.00 7 24322713.29 32% 0% 243% 221 206<br />
Rautahat 0 29 174,357,393.00 395 26 219526665.9 90% 126% 9,576 12,785<br />
Rolpa 46 0 26,003,623.00 77 4 20347084 167% 78% 2,166 1,422<br />
Rukum 27 19 91,457,389.00 33 10 58910<strong>11</strong>0.88 122% 53% 64% 942 1,354<br />
Sarlahi 0 31 51,328,274.00 <strong>11</strong>2 35 51090133.4 <strong>11</strong>3% 100% 957<br />
Sindhuli 22 <strong>11</strong> 61,678,596.00 18 13 59210462.74 82% <strong>11</strong>8% 96% 462 896<br />
19 Dist. Tot. 369 192 1,194,745,389.00 1,165 188 1,181,296,874 316% 98% 99% 27,050 34,610<br />
25 Dist. Total 508 242 1,749,959,235.00 1,510 273 1,704,796,991.26 297% <strong>11</strong>3% 97% 31,286 44,554<br />
ANNUAL PROGRESS REPORT (<strong>2010</strong>/20<strong>11</strong>) 63
District<br />
Target Physical Achievement Achievement in % Beneficiaries<br />
IG INFRA Amount IG INFRA Amount IG INFRA Amount Co members Total<br />
15 B1 District<br />
Bara 78 1 32,481,853.00 106 26044376 136% 0% 80% 2,106 2,177<br />
Bardiya 80 3 23,478,296.00 99 5 21806988 124% 167% 93% 2,540 1,787<br />
Dhading 56 12 28,638,967.00 75 8 23021789.7 134% 67% 80% 1,971 1,056<br />
Dhanusha 105 1 57,359,688.00 131 56682928.3 125% 0% 99% 3,519 3,698<br />
Khotang 14 4 26,003,187.00 50 8 23601350.18 357% 200% 91% 1,655 2,949<br />
Okhaldhunga 56 1 18,937,895.00 87 14068378 155% 0% 74% 2,244 1,330<br />
Panchthar 32 4 16,471,657.00 54 13312733 169% 0% 81% 1,443 746<br />
Parsa 62 32 52,743,389.00 56 17 36162094.43 90% 53% 69% 1,900 1,765<br />
Salyan 89 12 27,049,570.00 123 22476322 138% 0% 83% 3,376 1,797<br />
Saptari <strong>11</strong>4 2 40,4<strong>11</strong>,<strong>11</strong>4.00 83 21258923 73% 0% 53% 2,345 4,303<br />
Sindhupalch 135 6 33,871,657.00 125 28417906 93% 0% 84% 3,318 1,969<br />
Solukhumb 32 2 <strong>11</strong>,903,186.00 55 10582433.38 172% 0% 89% 865 1,073<br />
Taplejung <strong>11</strong>4 13 41,946,183.00 167 4 57265657.8 146% 31% 137% 3,341 3,363<br />
Terhathum 17 32 13,865,764.00 35 14 10704780 206% 44% 77% 1,237 762<br />
Udayapur 46 <strong>11</strong> 19,871,657.00 34 9 17735313.87 74% 82% 89% 1,109 1,695<br />
19 Dist. Tot. 1,030 136 445,034,063.00 1,280 65 383,141,974 124% 48% 86% 32,969 30,470<br />
40 Dist. Total 1,538 378 2,194,993,298.00 2,790 338 2,087,938,965 181% 89% 95% 64,255 75,024<br />
Innovative Programme Districts<br />
Baglung<br />
Chitawan 7 0 4,609,283.00 7 2449546 100% 53% 195 3<strong>11</strong><br />
Dhading<br />
Kanchanpur 6 2 6,387,986.00 13 4789700 217% 0% 75% 308 294<br />
Kavrepalan 0 0 0<br />
Lalitpur 150000<br />
Makwanpur 0 5 7,157,749.00 1687397 0% 24%<br />
Morang 8 0 8,700,349.00 0% 0%<br />
Nawalparasi<br />
Surkhet<br />
Innovative Tot. 21 7 26,855,367.00 20 0 9,076,643.00 95% 0% 34% 503 605<br />
Total = 1,559 385 2,221,848,665.00 2,810 338 2,097,015,608 180% 88% 94% 64,758 75,629<br />
64 ANNUAL PROGRESS REPORT (<strong>2010</strong>/20<strong>11</strong>)
Annex 18<br />
<strong>Poverty</strong> <strong>Alleviation</strong> <strong>Fund</strong> Project – II Progress Status<br />
Heading Number Amount (NRs.)<br />
Community Organizations (CO) Registered with PAF 12,370<br />
CO Federation Registration 517<br />
Agreement <strong>11</strong>924 6,740,003,674<br />
PAF Investment in CO Income Generating (IG) Activities <strong>11</strong>269 5,238,088,609<br />
Community Infrastructure 1754 1,501,915,065<br />
Partner Organizations (PO) 370<br />
Districts Covered Total 57<br />
Regular PAF Districts 40<br />
Phase I (6 Districts) 6<br />
Phase II (19 Districts) 19<br />
Phase III (15 Districts) 15<br />
Innovative Programme 10<br />
NDM-World Bank Innovative Prog. 24<br />
VDC Covered POs Working 1646<br />
COs Programme Activity 1538<br />
Per centage<br />
CO Member House Holds Total 344,512<br />
(HH)<br />
<strong>Poverty</strong> Hardcore Poor (Ka) 220,926 64.13%<br />
Ranking<br />
Medium Poor (Kha) 91,315 26.51%<br />
Poor (Ga) 31,695 9.20%<br />
Marginal Non-Poor (Gha) 576 0.17%<br />
Gender Male 80,150 23.26%<br />
Female 264,362 76.74%<br />
Ethnicity Dalit 82,987 24.09%<br />
Janajati 97,343 28.26%<br />
Others 164,182 47.65%<br />
Total Beneficiary HH Total 358316<br />
Ethnicity Dalit 89,505<br />
Janajati 93,467<br />
Others 175,344<br />
ANNUAL PROGRESS REPORT (<strong>2010</strong>/20<strong>11</strong>) 65
Annex19<br />
PAF II CO registration, agreement for sub-project and disbursement status (cumulative)<br />
District<br />
CO Registered w/ PAF<br />
(No.)<br />
Agreement<br />
With CO No. Amount (NRs.)<br />
Initial 6 Districts<br />
Darchula 442 571 739 409,226,460<br />
Kapilbastu 428 422 453 271,197,524<br />
Mugu <strong>11</strong>9 137 195 86,919,259<br />
Pyuthan 878 891 997 513,686,962<br />
Ramechhap 799 824 882 375,377,4<strong>11</strong><br />
Siraha 818 813 827 314,690,029<br />
Sub Total 3,484 3,658 4,093 1,971,097,645<br />
19 Additional Districts<br />
Achham 354 393 423 302,589,200<br />
Baitadi 500 417 444 225,825,513<br />
Bajhang 333 252 320 192,966,725<br />
Bajura 286 280 315 194,308,809<br />
Dadeldhura 244 257 286 175,599,<strong>11</strong>0<br />
Dailekh 281 287 297 175,403,701<br />
Dolpa 103 105 108 79,238,973<br />
Doti 294 285 298 146,641,871<br />
Humla <strong>11</strong>8 128 147 85,965,435<br />
Jajarkot 253 192 205 155,450,857<br />
Jumla 287 299 3<strong>11</strong> 261,349,584<br />
Kalikot 498 466 484 253,256,554<br />
Mahottari 305 308 312 156,569,981<br />
Rasuwa 108 101 101 60,207,592<br />
Rautahat 1,191 <strong>11</strong>05 <strong>11</strong>44 702,191,306<br />
Rolpa 155 156 159 60,367,061<br />
Rukum 254 179 192 <strong>11</strong>0,985,778<br />
Sarlahi 726 848 873 414,721,098<br />
Sindhuli 507 551 635 352,170,271<br />
19 Dist. Tot. 6,797 6,609 7,054 4,105,809,419<br />
25 Dist. Total 10,281 10,267 <strong>11</strong>,147 6,076,907,064<br />
15 B1 District<br />
Bara 120 106 106 36,129,445<br />
Bardiya 102 99 104 29,897,633<br />
Dhading 101 94 104 35,649,547<br />
Dhanusha 130 131 131 85,443,827<br />
Khotang 156 57 58 28,218,602<br />
Okhaldhunga 87 87 87 17,633,125<br />
Panchthar 210 54 54 15,426,859<br />
Parsa 151 141 146 73,048,478<br />
Salyan 137 129 132 32,090,489<br />
Saptari 98 83 83 36,228,262<br />
Sindhupalch 186 125 125 37,293,255<br />
66 ANNUAL PROGRESS REPORT (<strong>2010</strong>/20<strong>11</strong>)
District<br />
CO Registered w/ PAF<br />
(No.)<br />
Agreement<br />
With CO No. Amount (NRs.)<br />
Solukhumbu 60 55 55 16,810,992<br />
Taplejung 210 167 171 74,128,678<br />
Terhathum 59 45 49 12,639,626<br />
Udayapur 46 42 43 21,196,601<br />
15 B1 Dist. Total 1853 1415 1448 551835419<br />
40 Dist. Total 12,134 <strong>11</strong>,682 12,595 6,628,742,483<br />
Innovative Programme Districts<br />
Chitawan 30 45 53 12,241,422<br />
Dhading 51 64 68 29,9<strong>11</strong>,566<br />
Kanchanpur 65 56 56 18,491,700<br />
Lalitpur 2 2 2 6,784,220<br />
Makwanpur 70 59 63 27,754,427<br />
Morang 18 16 16 16,077,855<br />
Innovative Tot. 236 242 258 <strong>11</strong>126<strong>11</strong>90<br />
Total = 12,370 <strong>11</strong>,924 12,853 6,740,003,673<br />
Annex 20<br />
PAF II Expenditure (in NRs.)<br />
Details As of FY-66/67 FY-2067/68 Total Expenditure<br />
Community Organization (IG) 2,944,455,319.29 1,526,897,895.45 4,471,353,214.74<br />
Community Organization (INFRA) 758,609,531.33 470,910,094.15 1,229,519,625.48<br />
Community Organization (INNOVATIVE) 96,413,632.00 <strong>11</strong>,400,881.00 107,814,513.00<br />
Total Community Organization (I) 3,799,478,482.62 2,009,208,870.60 5,808,687,353.22<br />
Partner Organization (II) 874,461,208.28 456,990,252.13 1,331,451,460.41<br />
Sub Total (A=I+II) 4,673,939,690.90 2,466,199,122.73 7,140,138,813.63<br />
Monitoring, Training/Workshop (B) 69,179,504.02 39,606,480.75 108,785,984.77<br />
PAF Capital Cost (C) 23,068,852.88 369,821.20 23,438,674.08<br />
PAF Recurrent Cost (D) 129,871,434.47 95,107,597.57 224,979,032.04<br />
Total (A+B+C+D) 4,896,059,482.27 2,601,283,022.25 7,497,342,504.52<br />
Note: Including PPF Expenditure and KA-1-6 (Beruju) Expenses Amount<br />
ANNUAL PROGRESS REPORT (<strong>2010</strong>/20<strong>11</strong>) 67
Annex 21<br />
Summary Results of Follow-on Impact Survey <strong>2010</strong><br />
(Done by TU and the World Bank)<br />
1. PAF’s monitoring data is developed on 5 different databases<br />
which support the process of working with partner and community<br />
organizations and monitoring the sub-project activities (figure 1). These<br />
databases provide a rich source of information on PAF activities and<br />
have been increasingly analyzed to improve planning and address<br />
weaknesses in the project implementation process and to identify areas<br />
of strength that can be scaled up.<br />
2. In addition to the MIS, an independent impact evaluation has also been<br />
integrated into the design of the program. The IE has been a long-term<br />
partnership between the PAF Secretariat, Tribhuvan University (TU) (that<br />
carried out the surveys) and the WB task team (that provided Technical<br />
Assistance- TA during the design phase and carried out the analysis).<br />
Data for the PAF Impact Evaluation (IE) come from two rounds of surveys<br />
Partner<br />
Organization<br />
Selection<br />
Partner<br />
Organization<br />
Selection<br />
of 3,000 households from 200 villages. The baseline was carried out in<br />
late 2007 and the follow-up of the same households in early <strong>2010</strong>. The<br />
survey questionnaire is adapted from the <strong>Nepal</strong> Living Standards Survey<br />
(NLSS) and includes detailed information on consumption and income,<br />
socio-economic and demographic issues, including education, health<br />
and nutrition, housing conditions and physical assets, migration and<br />
remittances, employment, social environment, community relationship,<br />
voice and participation. For comparability with the national household<br />
survey based welfare measures, PAF survey includes a very similar<br />
consumption module and follows the same consumption aggregation<br />
method. The IE analysis uses panel households (2774 out of 3,000),<br />
half of which are PAF beneficiaries (treatment) the rest non-beneficiaries<br />
(control) households. Outcome indicators on PAF beneficiary households<br />
and carefully matched non-beneficiary households are compared for the<br />
periods before and after the initiation of the PAF program. This method<br />
is known as difference-in-difference combined with propensity score<br />
matching.<br />
Consumption Effects<br />
Community<br />
organization<br />
selection and<br />
registration<br />
Community<br />
organizations<br />
database-Beneficiary<br />
Assessment<br />
Community:<br />
Selection<br />
priority<br />
activites<br />
Community<br />
Agreements<br />
database<br />
Subproject<br />
Projects<br />
database<br />
Community:<br />
Implementation<br />
of activites<br />
Revolving<br />
<strong>Fund</strong><br />
database<br />
3. The estimated net program impact on per capita consumption (in<br />
real terms adjusted for price inflation) growth is 13% for PAF Income<br />
Generating (IG) participant households, 28% for PAF money recipient<br />
households and 49% for those beneficiaries who have received the<br />
money for at least six months. It is not a surprise that these impact<br />
estimates are larger for money recipients but it is interesting to note<br />
that this effect remains strong for those who have had the funds for<br />
some time and have invested them in IGAs. The magnitudes of these<br />
estimates are impressive across all three categories of treatments both<br />
in terms of per cent change and absolute change. For example, money<br />
recipients for more than 6 months recorded on net a 49 per cent growth<br />
and Rupees 6,900 (approximately US$100) absolute change in real per<br />
capita consumption in just over two <strong>year</strong>s of time. These results are all<br />
statistically significant and robust across different matching algorithms.<br />
The higher levels of welfare impact over time may suggest that IGA<br />
revenue is contributing to the welfare of these households, a result that<br />
would be desirable from a policy and sustainability point of view.<br />
4. The net impact in the growth in per capita consumption is even higher<br />
for Dalit and Janajatis, implying the program’s ability to distribute growth<br />
towards targeted groups. The net effect for money recipients among this<br />
caste/ethnic group was an increase in real per capita consumption of 34<br />
per cent, compared to 28 per cent for the overall sample of the same<br />
treatment category.<br />
Food Security Effects<br />
5. Chronic food insecurity is a particularly important concern in <strong>Nepal</strong><br />
and substantial amount is spent per <strong>year</strong> on public works programmes<br />
aimed at alleviating hardship for food insecure households. Sustained<br />
food price inflation remains a concern and an estimated 3.7 million<br />
people are currently food insecure. The impact of high prices and food<br />
insecurity is most severe on economically, geographically and socially<br />
marginalized communities. Since <strong>Nepal</strong>‟s poorest households spend<br />
more than 75% of their income on food, high prices will continue to<br />
affect poverty alleviation efforts. The analysis estimates that the net<br />
PAF impact on incidence of food insecurity (as defined as self-reported<br />
food sufficiency for six months or less) is 10 per centage points decline<br />
when the treatment group is PAF money recipients, and 14 per centage<br />
points decrease among money recipients at least 6 months prior to<br />
second-round survey. These effects are stronger for Dalit and Janajati<br />
households. However, there is no impact for PAF IG households (the<br />
base treatment category), possibly implying that the self-reported food<br />
sufficiency indicator (measure of perceived change in household’s ability<br />
to increase their food consumption) is not affected by PAF participation<br />
alone when the household is yet to receive funds and start an IG activity.<br />
Once again, these results are quite robust across different matching<br />
alternatives.<br />
School Enrolment Effects<br />
6. Due to PAF, school enrolment rate among 6-15 <strong>year</strong> old children<br />
increased by a net 7 per centage points for PAF IG households, by a<br />
net 9 per centage points for PAF money recipient households , and a<br />
net 12 per centage points for PAF money recipients for more than six<br />
months. These are all notable and statistically significant impacts. While<br />
child education is not a direct outcome associated with PAF intervention,<br />
one can think of at least two ways by which a treated household would<br />
change its behavior in relation to this outcome. First, PAF households<br />
are part of the larger PAF community organization (CO) are and likely<br />
to benefit from social-networking and mobilization. Second, actual<br />
and perceived positive change in income (PAF funds) will likely reduce<br />
potential constraints to sending a child to school.<br />
68 ANNUAL PROGRESS REPORT (<strong>2010</strong>/20<strong>11</strong>)
Child Underweight Effects<br />
7. For child malnutrition, measured in terms of underweight, the impacts<br />
of PAF are as not strong as they are for other outcome indicators.<br />
Nevertheless, incidence of underweight among children under 5 <strong>year</strong>s of<br />
age is estimated to decrease by 5 to 10 per centage points. The results<br />
are however not statistically significant and also do not hold across<br />
different matching techniques and across multiple treatment groups. We<br />
take this as a sign of overall trend in the right direction and could see<br />
significant effects in the next couple of <strong>year</strong>s.<br />
Other Effects<br />
8. There are, as yet, no significant PAF impact evident on indicators<br />
associated with community/social capital (trust, respect, relationships<br />
between different ethnic groups, community disputes, etc.), although<br />
the overall trend for both groups is positive. Similarly, while there is<br />
no significant impact of PAF program on the use of health services/<br />
facilities, the effects are qualitatively positive on the use of agricultural<br />
centers, community forest services, and farmers’ groups.<br />
Targeting<br />
9. The targeting results are consistent with PAF’s objective of targeting the<br />
poorest households and support monitoring data results as well. Of the<br />
many categories that PAF uses to classify the disadvantaged, one is the<br />
level of food sufficiency. The other is whether the household is from Dalit<br />
or Janajati caste/ethnicity category. For example, the probability of being<br />
selected as PAF money recipient goes up by 25 per centage points if you<br />
are from a Dalit/Janajati household. Similarly, one per cent decrease in<br />
per capita consumption at the baseline is associated with 15 per centage<br />
points increase in the probability of being selected for PAF.<br />
70<br />
60<br />
50<br />
40<br />
30<br />
20<br />
10<br />
0<br />
-10<br />
-20<br />
Reduction in Food insufficency<br />
6.8<br />
60.4<br />
Control<br />
Treatment<br />
17.2<br />
3 months or Less 6 months or Less<br />
10. The impact results are also consistent with PAF’s targeting the<br />
poorest households. Among other categories that PAF uses to classify<br />
the poor, one is the level of food sufficiency. Households are separated<br />
into four different groups under this category: hardcore poor (those with<br />
less than 3 months of food security either via own production or other<br />
-9.1<br />
dependable sources of income), medium poor (those with 3 to 6 months<br />
of food security), poor (those with 6 to <strong>11</strong> months of food security), and<br />
non-poor (those with 12 or more months of food security). The results<br />
show that the per centage of households with food insufficiency of 3<br />
months or less dropped from 13.8% in 2007 to about 5.5% in <strong>2010</strong>, a<br />
reduction of more than 60%, for the PAF beneficiary households (defined<br />
as those engaged in PAF supported income generating activities). The<br />
reduction was only about 6.8% for non-beneficiaries. Similarly, the<br />
per centage of households with food insufficiency of 6 months or less<br />
decreased from 40% in 2007 to about 33% in <strong>2010</strong>, a reduction of about<br />
17.5%, for PAF beneficiary households. There was no reduction for nonbeneficiaries<br />
during this period and in fact, there was an increase in food<br />
insufficiency of these households by about 9%.<br />
Access and Use of Services<br />
<strong>11</strong>. With the second phase of PAF II still ongoing, the number of poor<br />
households with access to improved infrastructure facilities has reached<br />
more than 49,000. The impact evaluation results show that the school<br />
enrollment rate for children from households engaged in PAF supported<br />
income generating activities increased by more than 7 per centage<br />
points. The enrollment rate was even higher for children from Dalit or<br />
Janajati households. While there was no obvious difference between the<br />
PAF beneficiaries and the non-beneficiaries in the use of health services/<br />
facilities, the beneficiary households were found to be making more<br />
use of agricultural centers, community forest services, and farmers’<br />
groups. The increased use of such services supports the monitoring<br />
data findings that PAF beneficiaries are investing in agriculture-related<br />
opportunities and reaching out to service providers to improve and<br />
develop these investments.<br />
Conclusions<br />
12. The evaluation results indicate that there is a positive and significant<br />
impact on household level welfare due to the PAF program relative to<br />
any other poverty reducing efforts that may be on-going at the same<br />
time. The results further indicate that the program is an effective tool for<br />
targeting the population considered most vulnerable in terms of caste<br />
and ethnicity as well as most food insecure. There are many process<br />
related questions that this impact evaluation does not yet answer. For<br />
example, a review of the monitoring data suggests that women groups<br />
are far more diversified in livelihood activities that mixed groups. Impacts<br />
on women only groups would need to be analyzed further as should the<br />
previously related positive indication of nutritional impact on children<br />
under 5 <strong>year</strong>s of age.<br />
13. The household-level panel data provide an opportunity for further<br />
analysis over time which may help us understand changes in poverty<br />
dynamics and for further counterfactual analysis of the outcomes<br />
reported in this paper. As such, a continuation of the survey methodology<br />
and of the impact evaluation analysis would be an important tool for<br />
policy makers and for the implementation of the poverty alleviation fund<br />
at the national level.<br />
(Ref. Impact Evaluation of the <strong>Nepal</strong> <strong>Poverty</strong> <strong>Alleviation</strong> <strong>Fund</strong>, WB/TU)<br />
ANNUAL PROGRESS REPORT (<strong>2010</strong>/20<strong>11</strong>) 69
Annex 22<br />
Un-audited Financial Statement for FY <strong>2010</strong>-<strong>11</strong><br />
70 ANNUAL PROGRESS REPORT (<strong>2010</strong>/20<strong>11</strong>)
ANNUAL PROGRESS REPORT (<strong>2010</strong>/20<strong>11</strong>) 71
Annex 23<br />
Un-audited Project Account for FY <strong>2010</strong>-<strong>11</strong><br />
72 ANNUAL PROGRESS REPORT (<strong>2010</strong>/20<strong>11</strong>)
ANNUAL PROGRESS REPORT (<strong>2010</strong>/20<strong>11</strong>) 73
74 ANNUAL PROGRESS REPORT (<strong>2010</strong>/20<strong>11</strong>)
ANNUAL PROGRESS REPORT (<strong>2010</strong>/20<strong>11</strong>) 75
76 ANNUAL PROGRESS REPORT (<strong>2010</strong>/20<strong>11</strong>)
ANNUAL PROGRESS REPORT (<strong>2010</strong>/20<strong>11</strong>) 77
78 ANNUAL PROGRESS REPORT (<strong>2010</strong>/20<strong>11</strong>)
ANNUAL PROGRESS REPORT (<strong>2010</strong>/20<strong>11</strong>) 79
80 ANNUAL PROGRESS REPORT (<strong>2010</strong>/20<strong>11</strong>)
ANNUAL PROGRESS REPORT (<strong>2010</strong>/20<strong>11</strong>) 81
82 ANNUAL PROGRESS REPORT (<strong>2010</strong>/20<strong>11</strong>)
ANNUAL PROGRESS REPORT (<strong>2010</strong>/20<strong>11</strong>) 83
84 ANNUAL PROGRESS REPORT (<strong>2010</strong>/20<strong>11</strong>)
ANNUAL PROGRESS REPORT (<strong>2010</strong>/20<strong>11</strong>) 85
86 ANNUAL PROGRESS REPORT (<strong>2010</strong>/20<strong>11</strong>)
ANNUAL PROGRESS REPORT (<strong>2010</strong>/20<strong>11</strong>) 87
88 ANNUAL PROGRESS REPORT (<strong>2010</strong>/20<strong>11</strong>)
ANNUAL PROGRESS REPORT (<strong>2010</strong>/20<strong>11</strong>) 89
90 ANNUAL PROGRESS REPORT (<strong>2010</strong>/20<strong>11</strong>)
Annex 24<br />
Current Staff List (as of January 2012)<br />
S.N. Staff Name Designation<br />
1 Raj Babu Shrestha Executive Director<br />
2 Manoj Chipalu Financial Analyst, Chief of Finance & Admin. Division<br />
3 Murari Lal Chaudhary Community Infrastructure Expert, Chief of Community Infrastructure Division<br />
4 Ram Prasad Dhakal Social Inclusion Expert, Chief of Program Coordination Division<br />
5 Kanchan Tamang Lama R&D Officer and Acting Chief of M&E and Research Division<br />
6 Anita Koirala Micro Enterprise Development Officer and Acting Chief of HRD Division<br />
7 Avishesh Neupane Environment Officer<br />
8 Dilip Raj Joshi Finance Officer<br />
9 Prabin Ghimire Finance Officer<br />
10 Shankar Prasad Yadav Civil Engineer<br />
<strong>11</strong> Shree Ram Subedi Communication Officer<br />
12 Sunita Shakya MIS Officer<br />
13 Achut Man Singh Pradhan Portfolio Manager<br />
14 Ajay Kumar Patel Portfolio Manager<br />
15 Akhilesh Chandra Das Portfolio Manager<br />
16 Amar Kumar Pakhrin Portfolio Manager<br />
17 Arun Pandey Portfolio Manager<br />
18 Bal Krishna Bishwakarma Portfolio Manager<br />
19 Bhupananda BK Portfolio Manager<br />
20 Bikam Karki Portfolio Manager<br />
21 Deepa Regmi Portfolio Manager<br />
22 Dhana Raj Shah Portfolio Manager<br />
23 Durga Bahadur Gandhari Portfolio Manager<br />
24 Hare Ram Wagle Portfolio Manager<br />
25 Ishwari Lal Bishwakarma Portfolio Manager<br />
26 Jaya Raj Pant Portfolio Manager<br />
27 Jharendra Bahadur Singh Portfolio Manager<br />
28 Kamal Bahadur Thing Portfolio Manager<br />
29 Krishna Bahadur Sherala Portfolio Manager<br />
30 Lal Bahadur Siwa Portfolio Manager<br />
31 Lokendra Singh Badal Portfolio Manager<br />
32 Mahesh Kumar Shahi Portfolio Manager<br />
33 Malati Chaudhary Portfolio Manager<br />
34 Manoj Kumar Gupta Portfolio Manager<br />
35 Meena Nakarmi Portfolio Manager<br />
36 Nirak Bahadur Sunar Portfolio Manager<br />
37 Nirmal Pant Portfolio Manager<br />
38 Om Prasad Poudel Portfolio Manager<br />
39 Padam Singh Thagunna Portfolio Manager<br />
40 Pradip Paudel Portfolio Manager<br />
41 Pramod Joshi Portfolio Manager<br />
42 Rabindra Suwal Portfolio Manager<br />
43 Ram Bahadur Bhusal Portfolio Manager<br />
ANNUAL PROGRESS REPORT (<strong>2010</strong>/20<strong>11</strong>) 91
S.N. Staff Name Designation<br />
44 Ramesh Lama Portfolio Manager<br />
45 Sajada Khatun Portfolio Manager<br />
46 Sandeep Nath Upreti Portfolio Manager<br />
47 Sanjay Kumar Jha Portfolio Manager<br />
48 Tara Prasad Joshi Portfolio Manager<br />
49 Anita Shrestha Office Assistant<br />
50 Dipesh Ratna Shakya Office Assistant<br />
51 Jaya Hada Office Assistant<br />
52 Lalita Kayastha (Khanal) Finance Assistant<br />
53 Parjun Sapkota Office Assistant<br />
54 Rita Bayalkoti Office Assistant<br />
55 Russell Man Singh Pradhan MIS Assistant<br />
56 Suman Kumar Pandit Finance Assistant<br />
57 Prem Lama Messenger<br />
58 Rajendra Dhakal Messenger<br />
59 Subash Rai Messenger<br />
60 Datta Maharjan Driver<br />
61 Devi Kumar Ale Magar Driver<br />
62 Krishna Bahadur Khatri Driver<br />
63 Shiva Nagarkoti Driver<br />
Ex-staffs who worked during the reporting <strong>year</strong> of <strong>2010</strong>-<strong>11</strong><br />
S.N. Staff Name Designation<br />
1 Krishna Babu Joshi Chief of Monitoring Evaluation and Research Division<br />
2 Mahesh Pokhrel Administration Officer<br />
3 Naveen Prashad Procurement Officer<br />
4 Prabin Manandhar Portfolio Manager<br />
5 Dinesh Gautam Office Assistant<br />
6 Kapila Prajapati Receptionist<br />
7 Satish Chaudhary Finance Assistant<br />
8 Smriti Sharma Receptionist<br />
92 ANNUAL PROGRESS REPORT (<strong>2010</strong>/20<strong>11</strong>)
94 ANNUAL PROGRESS REPORT (<strong>2010</strong>/20<strong>11</strong>)